Tag: Data Visualization
Do you know Metallica’s song “Nothing Else Matters”? Well, when it comes to marketing reports, that’s true because without them nothing else really matters. In the long run, it doesn’t matter what content you make, which channels you use, or which trends you follow because you can’t...
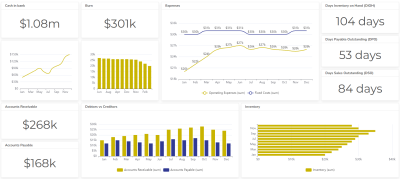
Cash Flow Dashboard Example For Mastering Your Finances
Research from Deloitte indicates that organisations that embrace data-driven decision-making have a 17% higher chance of outshining their competitors. Intriguing, right? Wonder how to achieve that?
One of the ways is creating a cash flow dashboard, as it provides the data you need to make informed...
How To Analyze Data In Excel Spreadsheet
Excel is the workhorse of data analysis in countless businesses. It can unlock valuable insights from spreadsheets, but for many, its power can be overwhelming. If you’re struggling to analyze data in Excel to extract meaningful information, this blog post is for you.
TL;DR
To analyze...
Collaborative Business Intelligence (BI) & Analytics
Imagine a world where everyone in your organization, from sales reps to executives, can easily access, analyze, and discuss data together. 🙌 Collaborative business intelligence (BI) & Analytics breaks down barriers and empowers teams to work together, transforming data into actionable insights.
TL;DR
Collaborative...
Business, Business Intelligence, Data Analytics, Data Visualization, Software
7 Best AI For Data Analysis: Tools You Can’t Miss
Data analysis used to be a slow, manual process. But with the ever-increasing volume and data complexity, traditional methods just don’t cut it anymore. ✍️
AI for data analysis applies artificial intelligence techniques to analyze datasets, uncover patterns, and generate insights that would...
Artificial Intelligence, Data Analytics, Data Visualization, Software
8 Best Ad Hoc Reporting Software 2026
Ad hoc reporting software empowers users to create custom reports and analyze data on-demand, without relying on pre-defined reports or IT assistance. It’s like having a self-service data analysis toolkit.
The ability to access information quickly and analyze information is crucial for any...
What Is Ad Hoc Reporting & Analysis With Examples
Having standardized reports that drop in your mailbox every week is great. But what about those urgent requests that require in-depth analysis and experts’ viewpoints? That’s where ad hoc reporting can come in handy.
Ad Hoc reporting lets you create reports instantly and are made to...
9 Analytics Dashboard Software & Tools 2026
Everyone loves good analytics dashboard software and tools that visualize data in an easy-to-understand way. 📶 The real struggle is behind lovely designs because creating analytics dashboards can become a nightmare.
That’s why picking the right tool for visualizing data is the first and...
Business, Business Intelligence, Data Analytics, Data Visualization, Software
13 Dashboard Design Principles: Ideas & Best Practices
Dashboards have become key players in helping businesses navigate the complexity of information. 📊The main goal is to turn raw data into clear and visually compelling insights. Making it easier for your team to understand and use the information to make informed decisions.
However, just like any...
How To Create Operational Dashboard? Guide With Examples
An operational dashboard is a digital tool that displays key performance indicators (KPIs) to monitor the health of a company’s day-to-day operations.
Do you ever feel like you’re being bombarded by information, but struggle to extract the insights that truly matter? Are key metrics...
Digital Dashboard 101 Guide With Good & Bad Examples
Today data-driven world businesses are flooded with data. From sales figures to customer satisfaction metrics, easy to get lost in the sea of data. The main goal of a digital dashboard is to provide interactive visualization with real-time data and information. 💻
This blog article will cover different...
Small Business Data Visualization: Where To Start?
Businesses of all sizes are collecting and gathering mountains of data. ⛰️But what’s the point of gathering if you don’t analyze it? That’s where small business data visualization plays a vital role.
The main goal of data visualization is to turn raw data tables into actionable...
14 Best Data Visualization Tools Comparison 2026
Data visualization is all about transforming raw numbers into compelling visuals that reveal hidden insights and make complex information easy to grasp. But here’s the thing: one size doesn’t fit all. The best data visualization tools is the one that perfectly aligns with your specific data and business...
Best Data Visualization Tools for Mac 2026
Another data visualization struggle, right? When Excel doesn’t do the work the way we want it. It’s time to explore dashboard software for Mac. 📈
You’re in the right place if you’re looking for trustworthy software that would work without any issues and would be compatible...
Top 5 Klipfolio Alternatives 2026 You Can’t Miss
In a study by MIT, researchers found that people are 65% more likely to retain information when it is presented visually compared to when it is presented textually. Because our brains are naturally wired to process visual information more efficiently.
This is where data visualization tools, such...
5 Best Free Data Visualization Tools 2026 (Comparison)
Visualization is an integral part of any data. Otherwise, how else can you make a decision or understand the correlation between data cells? Visualization makes everything easier, and we all love pretty charts that give us an idea of the current situation.
With so many data visualization tools...
Top 5 Google Data Studio (Looker) Alternatives 2026
Looker was first launched in 2012 in Santa Cruz as a start-up by two developers. In 2019, it was acquired for 2.6$ billion by Google. Some of you might have heard the name Google Data Studio. Yes, it’s the same tool that was renamed to Looker in 2022. Looker is one of the most popular BI tools...
7 Power BI Alternatives You Can’t Miss 2026
Microsoft Power BI is a powerful platform that helps companies manage data and create efficient reporting systems ensuring a data-driven culture. However, it’s not a “one solution fits all”. This article will review the best Power BI alternatives.
Power BI is a complex platform...
Time Series Charts: How To Create & When To Use With Examples
Time series charts are used for data that is measured through the time. Usually, it’s big amounts of data that needs summary to show the data trendline.
Time series chart with inventory example data. Created with Ajelix BI
In the blog article we will show you how to create time series...
Pie Charts: When To Avoid & How To Use Them With Examples
Pie charts are most effective when you need to visualize the proportional distribution of a whole into multiple categories.
Pie chart example with profit per project. Created with Ajelix BI
In this blog we will share examples on how to use pie charts and when to avoid them. You’ll see...
Donut Chart: When To Use Them With Good Examples
In this blog we’ll explain donut chart attributes, uncovering when and how to use them effectively. We’ll provide you with insights into the best practices and case studies for donut charts.
Donut chart example showcasing customers per country. Chart by Ajelix BI
What is a Donut...
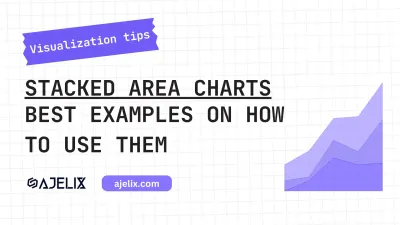
Stacked Area Charts: Best Examples On How To Use Them
Stacked area chart is a type of data visualization that allows us to display quantitative data using a series of colored layers, or “areas,” stacked on top of one another to represent cumulative values. Each layer represents a different category or subgroup of the data.
The total...
How to Rotate a Chart in Excel? (Pie & Bar Graph)
This blog article will walk you through the steps on rotating charts in Excel. Whether it’s a pie chart or bar chart we will show you how it’s done and help you do this in your spreadsheet. In this guide, we will take you through the art of chart rotation in Excel, uncovering its significance,...
How to Sort Bar Chart in Descending Order in Excel
We all want our charts and graphs to present the data correctly. So we can gain an understanding of our visual materials. What’s the point of the report if we can’t understand the data behind it?
In this guide, we will walk you through steps you should take to sort bar chart in...
Exploring Data Visualization Examples, Benefits & Importance
Have you ever struggled to make sense of endless numbers? That’s where data visualization comes in. And no, it’s not just about charts—it’s about turning raw data into a story we all can understand.
In this article, we will start by analyzing the data visualization definition and its importance,...
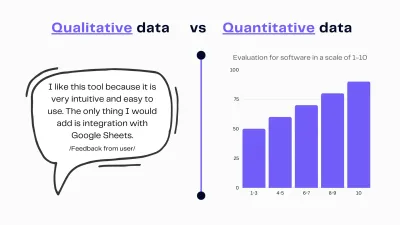
Visualizing Quantitative Data: Best Practices
In an age where data rules the roost, harnessing its potential has become paramount. Enter data visualization, the art and science of representing data in graphical form, transcending numbers into insightful visual narratives.
The Importance of Data Visualization
Data Visualization is the art...
Master Real Estate Data Visualization
Real estate data visualization is turning complex data about properties and the market into easy-to-understand visuals like charts, graphs, and maps. 🏢
Data visualization isn’t just a buzzword; it’s an indispensable tool in the real estate industry. By turning data into visually digestible...
How To Left Align A Pie Chart In Excel: Step-by-Step Guide
In the intricate realm of Excel, where precision and presentation converge, aligning elements takes center stage. In this step-by-step guide, we will explain how to left-align a pie chart in Excel.
What is a Pie Chart?
A pie chart is a circular graph divided into slices to represent numerical...
How to Add and Remove Gridlines in Excel Chart
In the ever-expanding universe of data-driven decision-making, Excel charts stand as celestial bodies illuminating our path. Among the celestial elements of these charts, gridlines play a pivotal role in guiding our understanding of the data constellations.
In this step-by-step guide, we will...
How to Make a Double Bar Graph in Excel
When it comes to visualizing data with precision and clarity, Excel is the go-to tool for many. In this guide, we will explore the art of creating a double bar graph in Excel, a versatile representation of data that allows you to compare two sets of information side by side.
...
How to Add Tick Marks in Excel Graph
Tick marks matter in Excel graphs because they help convey information clearly, even though they might seem like a small detail. In this article, we’ll explore the significance of tick marks and how to use them to enhance your Excel graphs.
What are tick marks and why use them?
Tick marks,...
Your Money GPS: Create a Personal Financial Dashboard
In the intricate landscape of personal finance, the beacon that shines brightest is your Personal Financial Dashboard. This is not just a tool; it’s your financial GPS, navigating you through the twists and turns of your monetary journey. In this comprehensive guide, we will delve into why...
Top 9 Data Visualization Trends 2026
In the ever-evolving landscape of data visualization, 2026 promises to be a year of groundbreaking trends and innovations. We will explore the newest trends in data visualization. It includes using artificial intelligence and the ethical concerns connected to data.
The article also examines how...
Great Qualitative Data Visualization Examples
In the vast realm of data visualization, the ability to effectively convey qualitative data holds immense significance. It transcends mere statistics, unlocking narratives that captivate and engage audiences.
We will study qualitative data visualization. This includes its importance, principles,...
Seeing is Believing: Marketing Data Visualization Practices
The old adage “seeing is believing” perfectly captures the power of data visualization in marketing. Numbers and spreadsheets, while crucial, can leave audiences especially creatives overwhelmed and fail to resonate. 📈
Data visualization bridges this gap, transforming complex information...
Effective Data Visualization Dashboards That Tell a Story
Humans are wired for stories. We connect with narratives on a deeper level and retain information more effectively when presented in a story format. 🎨
Data visualization dashboards can be powerful storytelling tools. Combining data with clear visuals and a logical flow allows you to create digital...
AI Data Visualization & Analytics
AI data visualization and analytics are transforming our understanding and insights from large datasets in our data-focused world. As technology advances, understanding how AI influences data analysis becomes paramount for anyone navigating this landscape.
This article explores AI-powered data...
Financial Data Visualization Examples and Best Practices
Financial data visualization is taking complex financial information like profits, sales, and expenses and turning it into easy-to-understand charts, graphs, and other visuals. It’s basically about making financial data clear and actionable.
In this article, we’ll dive into the significance...
Data Visualization Principles With Good & Bad Examples
Making sense of raw numbers starts with strong data visualization principles. Good visualization brings clarity to your data and helps drive action, while bad visualization can easily confuse or mislead.
With endless chart and dashboard options, it can be hard to know what actually works. In this...
How to Make Bar Chart Bars Wider in Excel
Bar charts are one of the most popular ways of visualizing data in Excel. However, the width of the bars in a bar chart can greatly impact the readability and effectiveness of the chart. In this article, we will provide a step-by-step guide on how to make bar chart bars wider in Excel.
...
How to Create a Budget in Excel + Free Budget Template
Knowing how to create a budget in Excel is essential for financial success, and good old Excel makes budgeting easy. In this article, you’ll learn how to prepare a budget in Excel and also how to make a budget sheet in Excel to keep your finances on track.
We’ll go over setting up the spreadsheet,...
How to Add Power Pivot to Excel
6 minutes read
In today’s business landscape, effective data analysis is the key to understanding customer trends and market shifts. While Excel has been the traditional choice for data analysis, it often struggles with large datasets but… that’s where Power Pivot comes into...
How to Make Your Google Sheets Data Look Professional
6 minutes read
Let’s be honest—staring at a messy spreadsheet is the last thing anyone wants to do. Whether you’re managing budgets, tracking sales, or just trying to keep your data in order, well-organized and professional Google Sheets data makes all the difference.
…but how...


