Top 5 Google Data Studio (Looker) Alternatives 2026
Looker was first launched in 2012 in Santa Cruz as a start-up by two developers. In 2019, it was acquired for 2.6$ billion by Google. Some of you might have heard the name Google Data Studio. Yes, it’s the same tool that was renamed to Looker in 2022. Looker is one of the most popular BI tools and is used widely.
The platform is great for advanced data analytics and big amounts of data. The setup can be challenging as you need help from IT and data analytics experts to set up the reports and edit them. Platform is known as one of the most expensive BI platforms with a start price of 60$K for a year.
Change the way you work with agentic AI
One-click dashboards,KPI tracking, and AI-powered insights—for work that actually gets done.

There are many alternatives in the market with BI tools for every taste and budget. In this article, we will take a look at 5 Looker alternatives for non-tech teams. Or you Google Data Studio alternatives and competitors. You will learn the features and limitations for each alternative with our comparison at the end of the article.
What Are The Best 5 Looker (Google Data Studio) Alternatives for 2026?
There are lots of comparisons out there in the market, so here’s our list of 5 best Looker alternatives for non-tech teams in 2026:
Quick Glance At Looker (Google Data Studio)
Looker serves as a platform for data modeling, governance, and the development of sophisticated data systems. Providing a self-service platform, Looker allows you to construct custom applications and engage in discussions with your business data.
It excels in applications and big data analytics. However, this is not an ideal solution for non-tech teams as the report setup requires SQL knowledge and architecture. As well it’s one of the most expensive solutions out there.
Looker Feature Overview
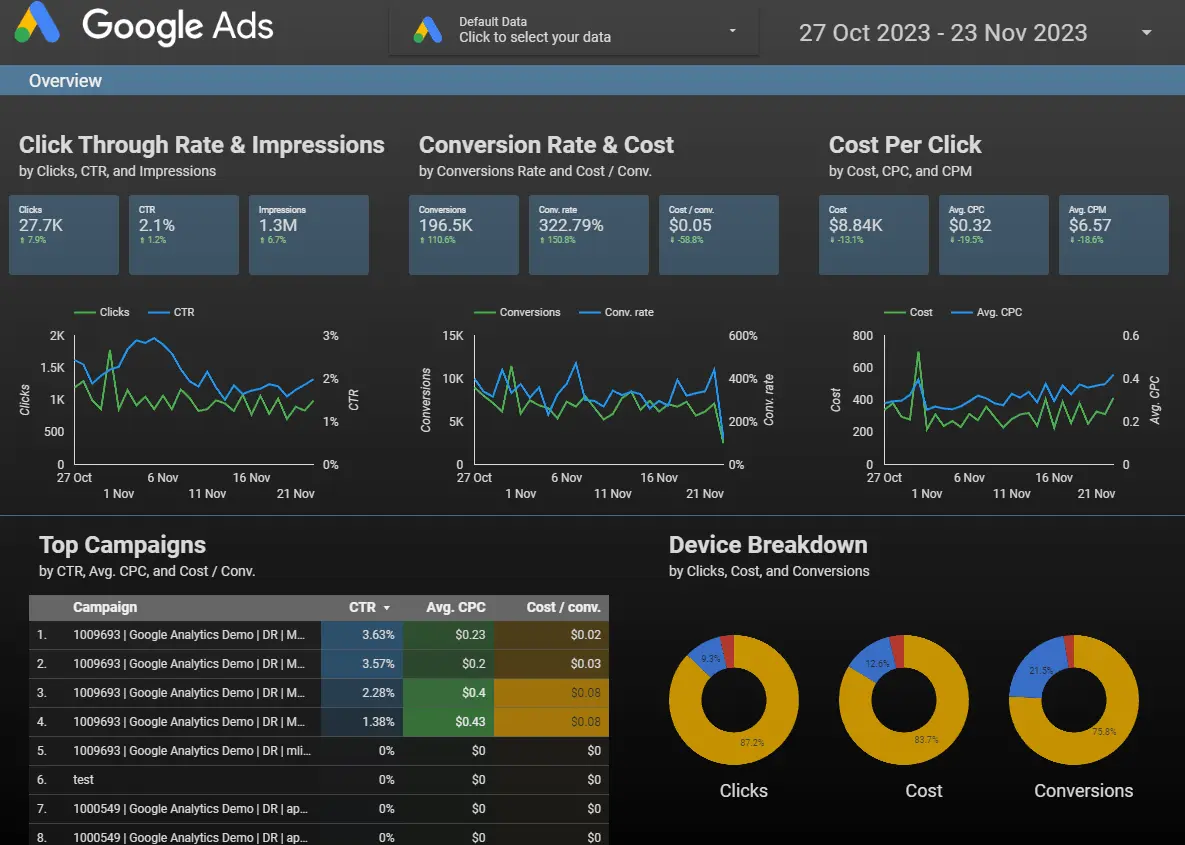
- Real-time insights and reports from your choice of cloud.
- Embedded analytics right into your business applications.
- Can simply do data analytics for an end user, if you have an experienced analytics expert in your company who can create these reports using SQL.
- Data preparation can be automatized for you.
- Option to connect with other BI platforms.
- Advanced sharing settings with high-security standards.
- Large library of custom templates from Looker. There’s also a vast amount of third-party templates that you can purchase. (You can find templates here)
- This platform uses Looker Modeling Language (LookML) which is built around SQL to create semantic data models.
Looker Pricing
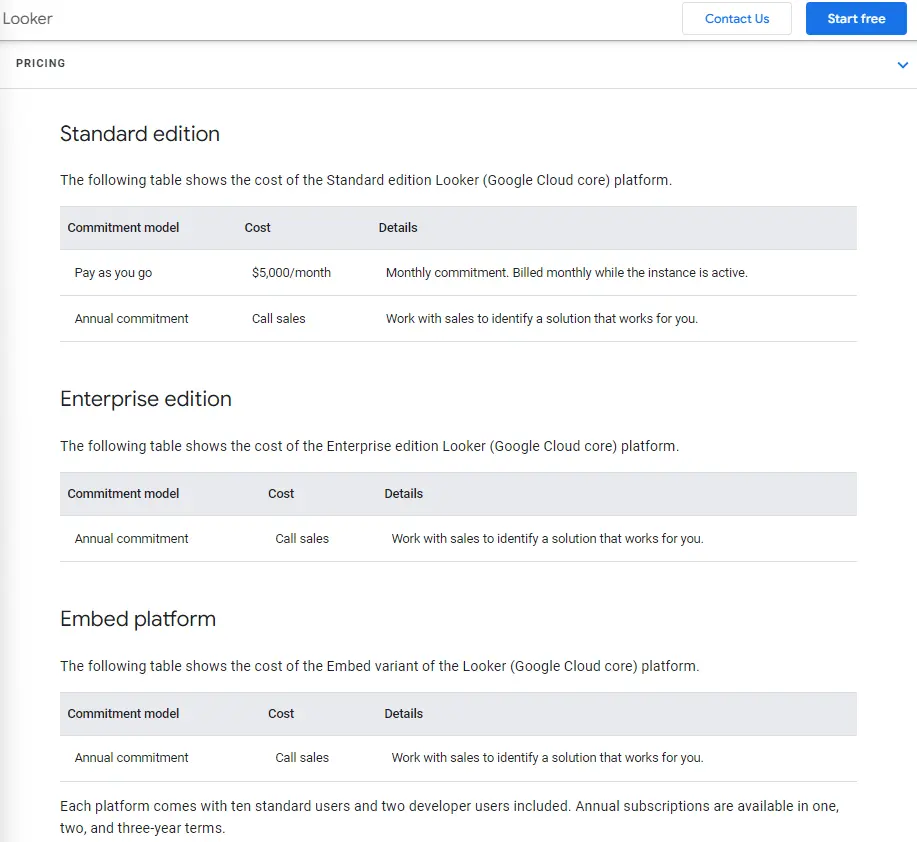
Looker’s pricing structure is divided into two components, encompassing packages and individual licensing for each user. The platform offers three editions: Standard, Enterprise, and Embed.
- Standard is for small organizations up to 50 users and costs $5000/month. With 10 standard users, 2 developer users, up to 1000 query-based API calls and 1000 administrative API calls.
- Enterprise edition provides an equivalent number of licenses, with the primary distinction lying in the quantity of API calls: 100,000 query-based API calls and 10,000 administrative API calls. Get in touch with the sales team to get a quote and be prepared for an annual commitment.
- Embed edition includes an equivalent number of licenses, along with 500,000 query-based API calls and 100,000 administrative API calls. For pricing details, please reach out to the sales team.
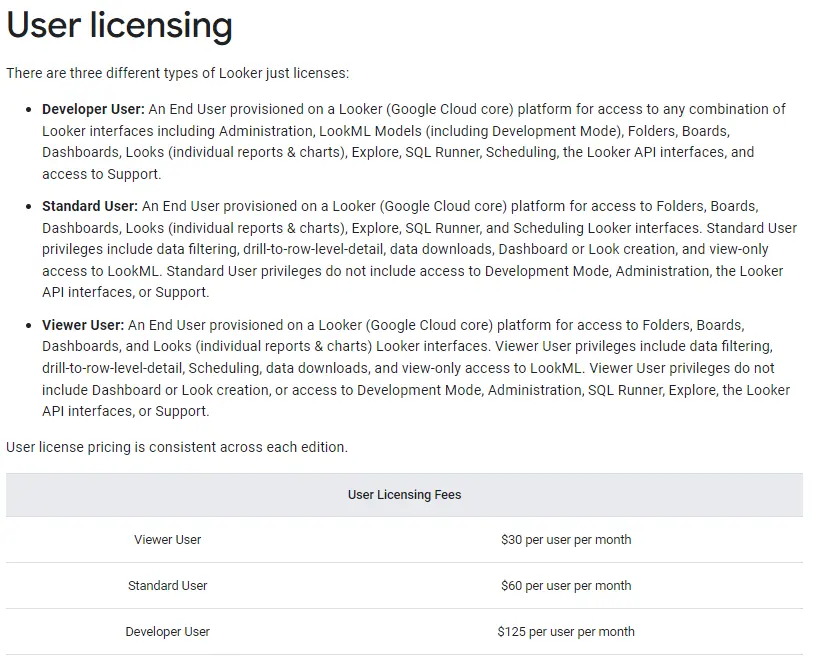
You can also get an individual licensing that you can purchase for Developer, Standard and Viewer user.
- Developer user license grants the ability to create reports with access to all features offered by this BI platform. The price is $125 per user per month.
- Standard user can utilize and analyze created reports but lacks access to development mode, administration, API, and support. The cost for this user is $60 per month.
- Viewer license can only the view and interact with reports and it will cost you a $30 a user per month.
What Are The Cons And Limitations Of Looker?
- Challenging Learning Curve: Proficiency in SQL and advanced analytics is essential for configuring this BI platform.
- Elevated Costs: In our assessment, this platform emerges as one of the pricier options, making it well-suited for enterprises but potentially burdensome for small to medium-sized businesses.
- Limited Customer Support: Obtaining assistance may prove challenging, with extended wait times reported.
- Performance Issues: Some developers have noted concerns about lagging when handling substantial amounts of data.
- Lack of Filtering Functions: Customer reviews highlight the absence of certain filtering functions.
- Complex User Management and Sharing: When constructing dashboards, careful consideration is required regarding the number of users to be added.
- Absence of Advanced Formula Creation: Compared to other tools, there is a lack of advanced formula creation capabilities.
- User Interface and Editing Challenges: Users express difficulties in editing, and the tool is perceived as lacking some visualization functions, indicating room for improvement.
Ideal Users For Looker
- Large-scale enterprises
- Experienced data analysts proficient in SQL and Google solutions
- Companies dealing with substantial amounts of data
Related Article: Top 7 Power BI Alternatives For Data Visualization
Top 5 Looker Alternatives For Non-Tech Teams 2026
Looker is an advanced platform for medium to large enterprises that have analytics teams who deal with data visualization daily. However, many businesses need a solution to empower non-tech teams so that any team member can create reports painlessly.
This top is for those organizations and solo entrepreneurs who need to make data-driven decisions without paying thousands. Looker is one of the well-known platforms in the market but let’s explore the best alternatives.
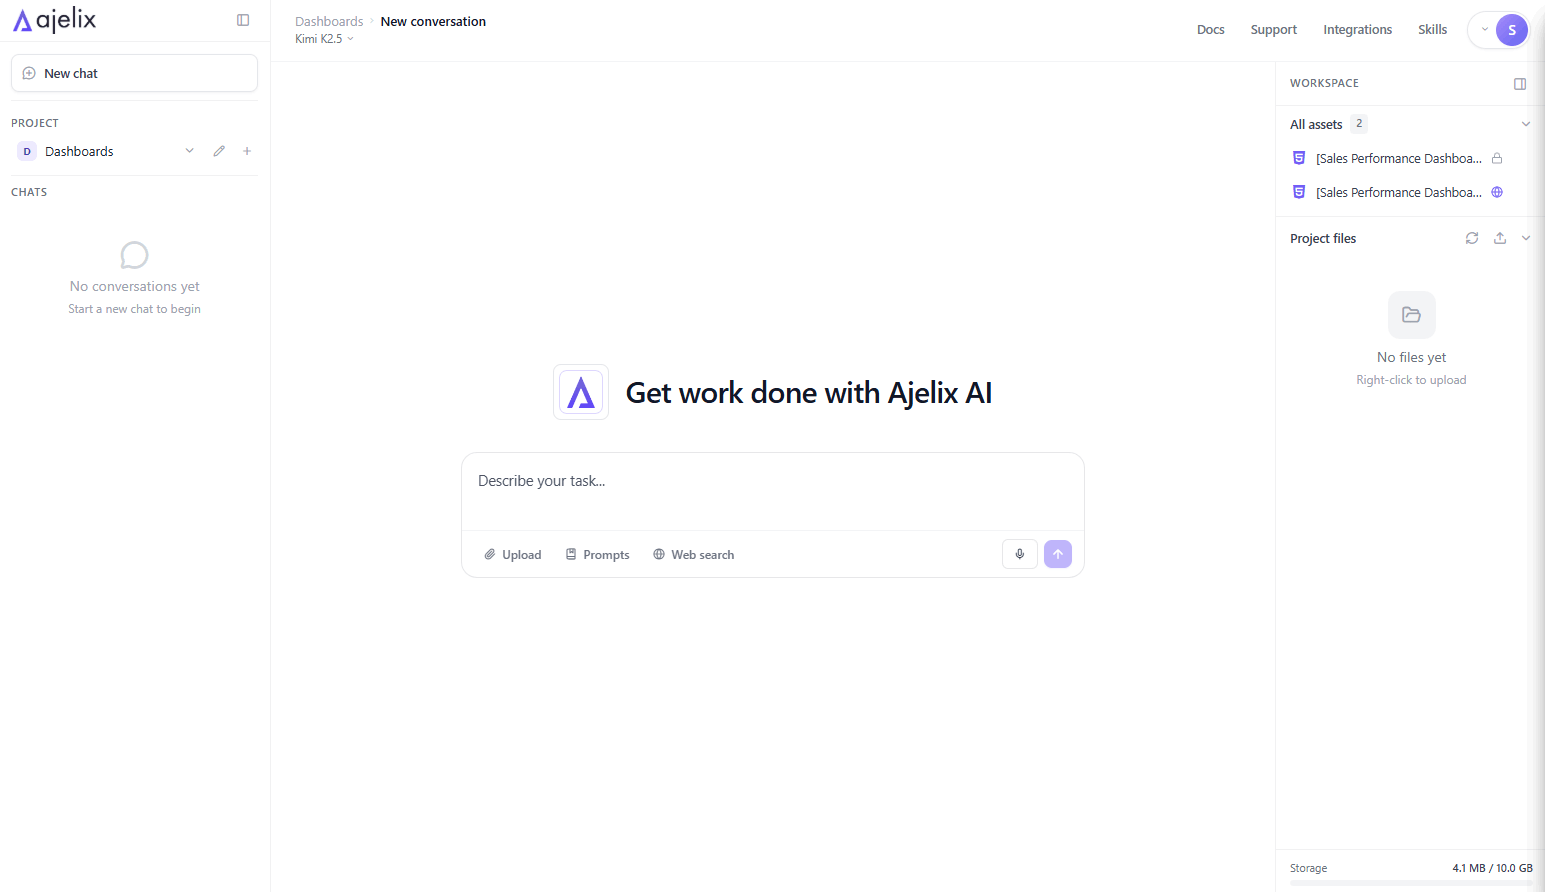
1. Ajelix
Most AI platforms demand technical expertise, long onboarding, and constant IT support. Ajelix was built to eliminate all of that.
It’s an agentic AI platform where anyone in the company, regardless of their technical background, can chat their way to finished reports and board-ready results. No advanced setups, training sessions, or bottlenecks. Just describe what you need and get it done.
What Are The Ajelix Features?
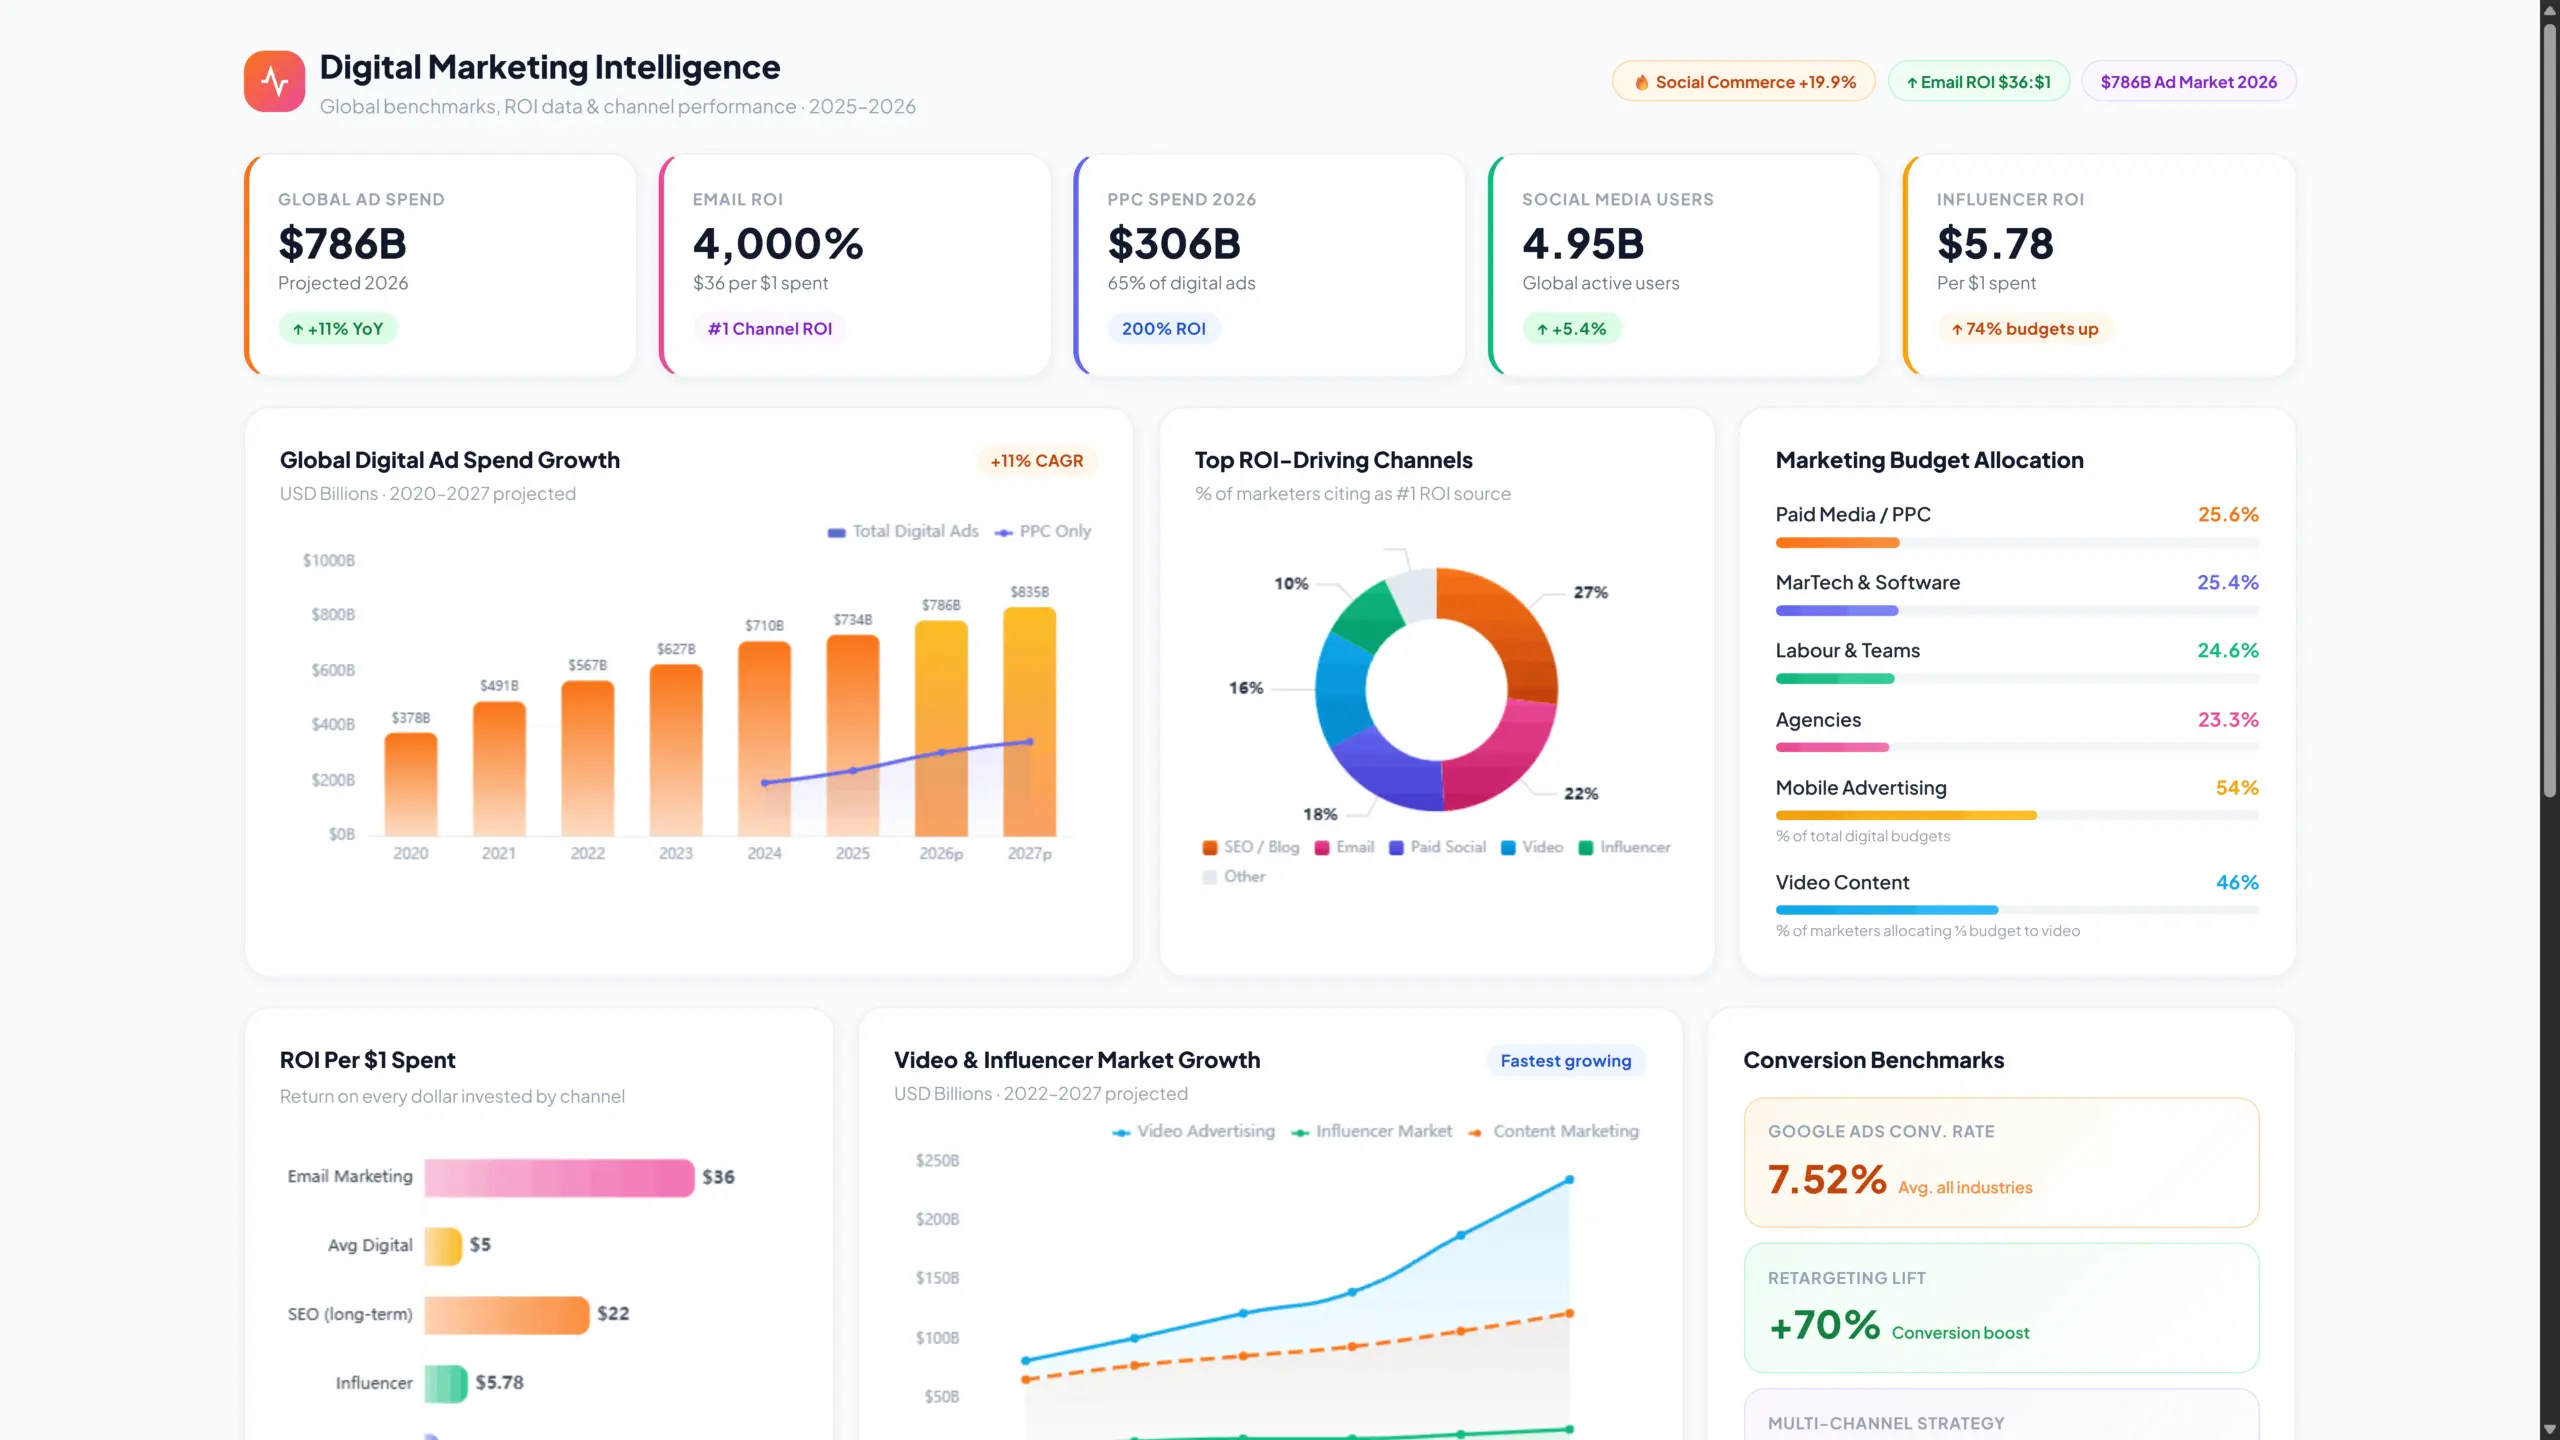
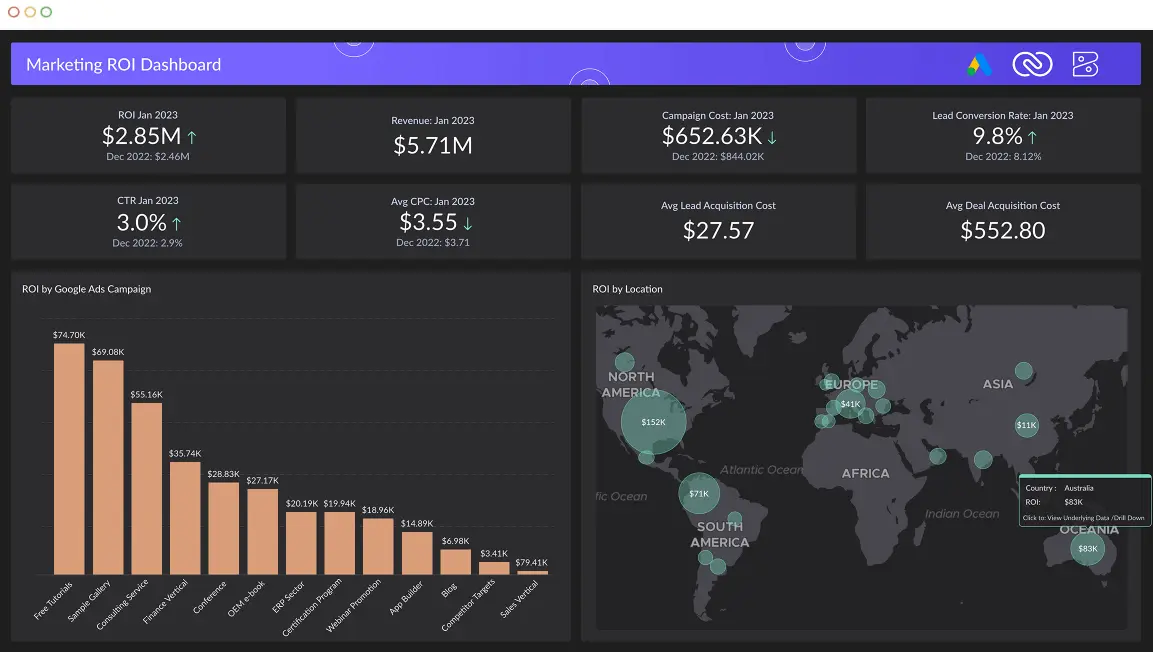
- AI Agent that works the way you think. Describe what you need and get production-ready dashboards, reports, and apps instantly — no back-and-forth.
- Zero setup. Zero training. Sign up and start building immediately. No configuration or technical knowledge required.
- Conversational BI for every employee. Chat with your data in plain English. Any team member can ask questions and get insights, analysis, and visualizations on demand.
- All your data sources in one place. Import Google Sheets, Excel, PDFs, CSVs, and documents — ready to use immediately.
- Leadership-ready dashboards in seconds. Upload files up to 1GB and get fully interactive, formatted dashboards without any manual work.
- Automatic data preparation. Ajelix cleanses messy files, extracts data from PDFs and images, and calculates KPIs automatically.
- One-click sharing. Publish and share dashboards, apps, and reports instantly via a link — ready for collaboration or client presentation.
- A workspace that remembers everything. Files, assets, and history stay saved across sessions. No re-uploading or re-explaining needed.
- Insights beyond the numbers. Get automatic trend detection, contextual analysis, and actionable recommendations — not just raw data.
- Build any asset on demand. Excel files, presentations, web apps, dashboards — describe it once and get a finished deliverable in one click.
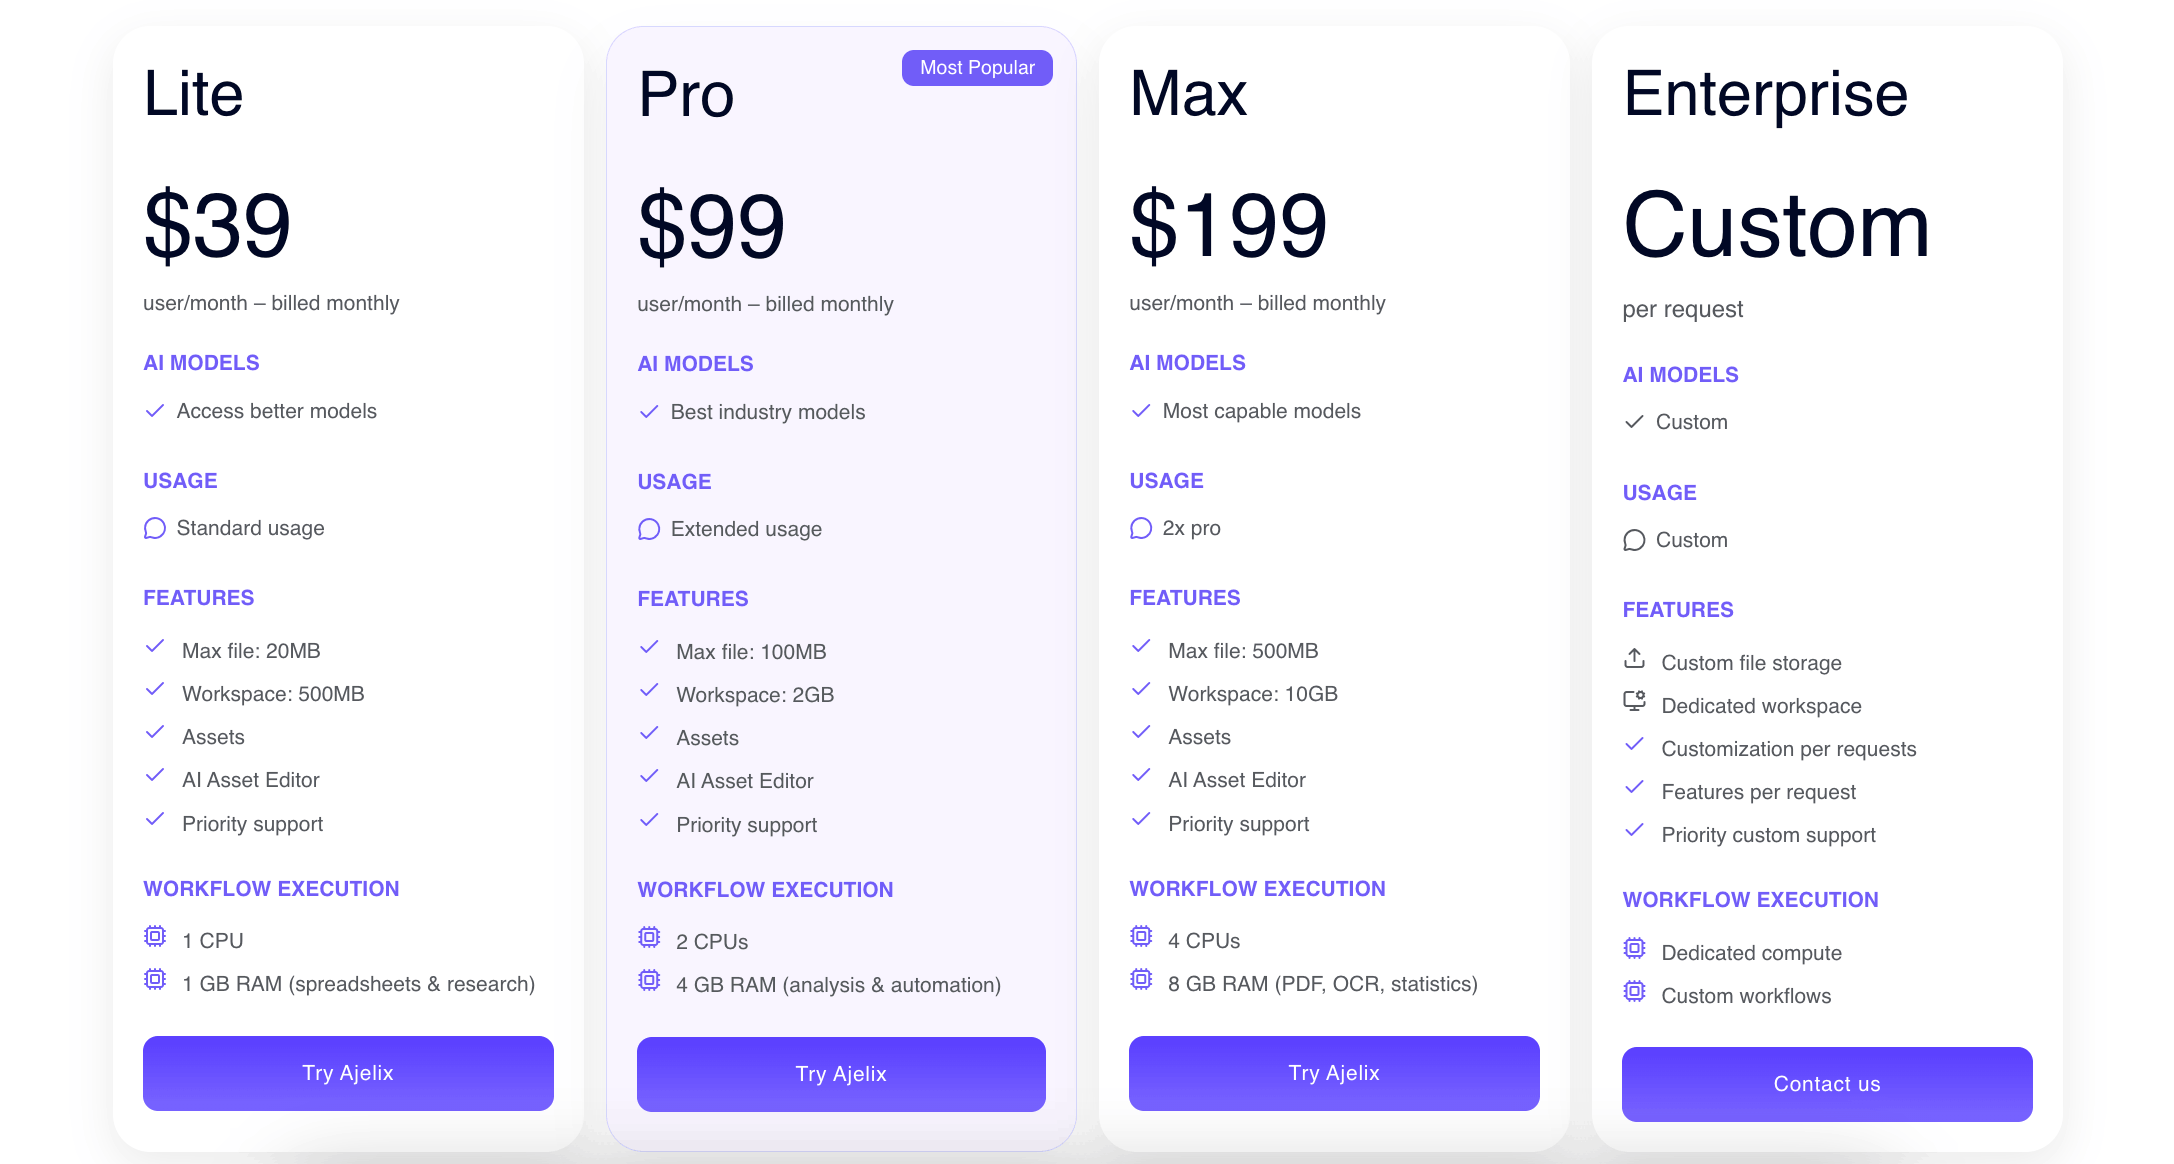
What Is The Pricing For Ajelix?
Ajelix platform offers multiple pricing plans:
- You can try it for free before committing.
- Lite $39/month – The right step up for individuals who need more. Includes asset creation, 20MB file uploads, and 500MB of workspace.
- Pro $99/month – The complete Ajelix experience. Access the best AI models, 100MB file uploads, 2GB workspace, and higher usage limits.
- Max $199/month – Built for serious workloads. Handle 500MB files, 10GB of workspace, and double the processing power for heavy, data-intensive tasks.
“Choosing Ajelix means you are supporting individual developers committed to creating impactful tools that boost business efficiency. With consistent updates and immediate support, you can expect bigger value over time and superior support.“
Who are the ideal Ajelix users?
- Individuals and solo entrepreneurs who need to make data-driven decisions fast.
- Finance teams automating reports and variance analysis.
- Marketing teams turning data into client-ready deliverables.
- Small to medium businesses.
- Non-technical teams.
- Anyone who wants working assets – dashboards, apps, presentations, Excel files in minutes.
Reporting gives you a headache?
Upload your data and create professional reports with agentic AI

Start free
Try free and upgrade whenever
2. Klipfolio
Klipfolio is cloud-based application with great data visualization capabilities and variety of data connections. They offer visualization, and monitoring the key performance indicators (KPIs). They offer real time data collection and sharing. You can create visualizations from spreadsheets to SQL queries with more than 100 data sources.
What Are Klipfolio Features?
- Create your own individual metrics.
- Ability to connect data from more than 100 data sources.
- Get pre-made data dashboards with live data reporting.
- Create your own data feeds with SQL, etc.
- Preparate your data before report creation.
- Data visualization.
- Collaboration and sharing with others.
What Is The Pricing For Klipfolio?
Klipfolio provides 4 pricing plans: Free, Go, Pro, and Business.
- The free version comes with restrictions on the number of users, dashboards, and data sources, but it may suffice for small businesses or those looking to explore its features. They offer a 30-day trial to try out Pro plan.
- Pro version costs 300$ monthly and you’ll be able to add more users, dashboards, datasets, etc.
- Business plan costs 800$ a month. In this plan you can flexibly manage user count, datasets, etc. In addition, you can have a Custom service agreement and vendor assessment.
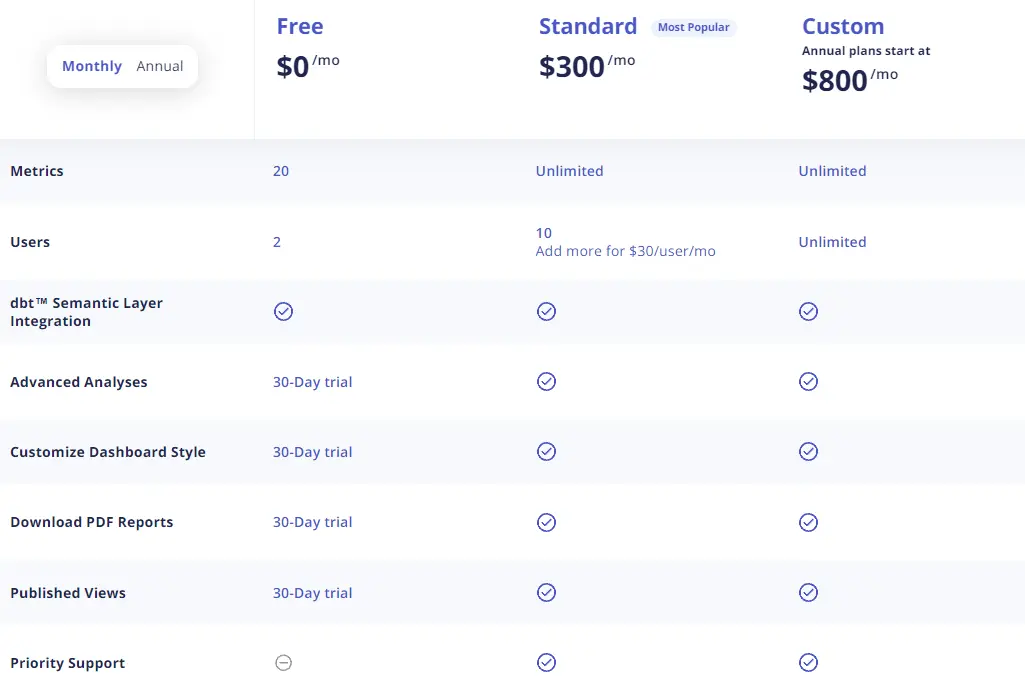
You can also customize the plan by adding individual license 30$ a month for each user.
What Are Klipfolio Limitations & Cons?
- Similar to other BI platforms you might experience lags and speed issues.
- Lack user interactivity, such as, drag and drop functionality.
- Support/help documents are difficult to use and doesn’t always match with the actual product session.
- Backend dashboard creation is a complex process.
- Many users outlined that it can be overwhelming if you want to create something out of the pre-defined reports. As you need previous knowledge and some technical skills.
- You might need an IT professional who will set up & renew API connections.
Who are the ideal Klipfolio users?
- Small to medium companies.
- Non-technical users.
- Great for basic to intermediate data analytics.
Related Article: 5 Tableau Alternatives To Explore Data With AI
3. Zoho
Zoho Analytics is a self-service business intelligence and data analytics software that empowers you to analyze your data, generate compelling data visualizations, and uncover insights within minutes. It’s a great solution for non-tech teams, however, some set-up from an experienced expert is needed.
What Are Zoho Features?
- Data sources. Variety of data source connections from popular data sources and applications.
- Data cleansing and preparation. Cleanse your data using intelligent insights to remove duplicates and invalid entries.
- User-friendly editing. You can use self-service drag-and-drop functionality to create interactive dashboards.
- AI data analytics. Explore data with AI and reveal insights. You can also use conversational analytics, predictive analytics, and what-if analysis.
- Collaborate and share reports with others.
- Embed analytics. Insert dashboards in your applications with no code solutions.
What is the Pricing plan for zoho?
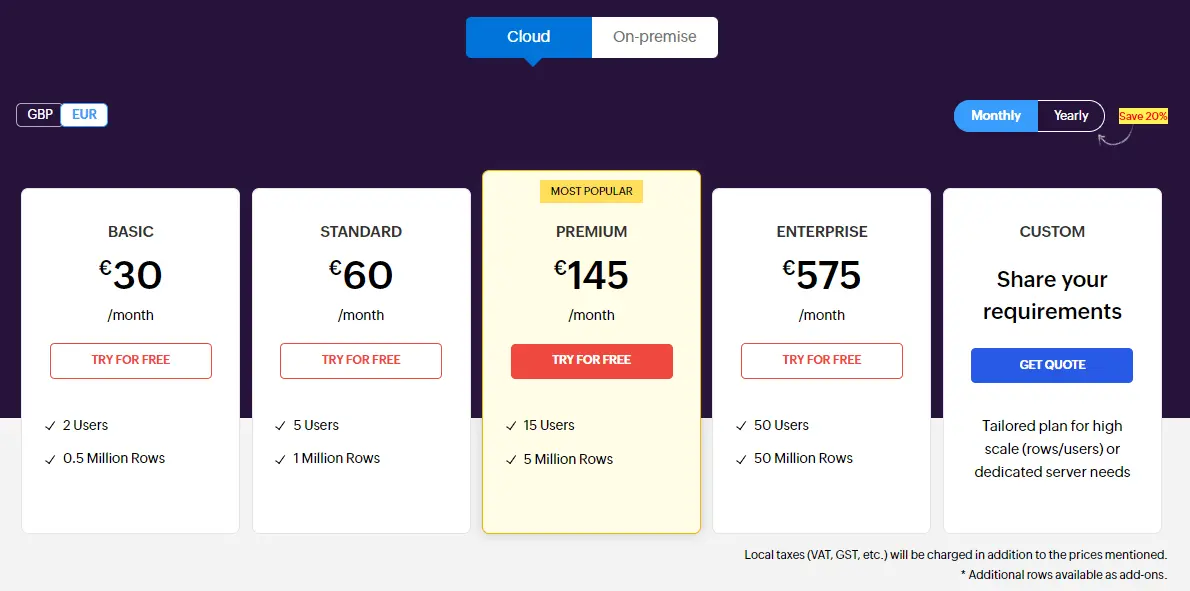
Zoho’s pricing is segmented into two parts: Cloud and On-Premise. The On-Premise option is higher in cost and is additionally subdivided into four plans: Basic, Standard, Premium and Enterprise.
- Basic plan is 30€ per month, covering 2 users and 0.5 million rows.
- Standard plan is 60€ per month, with access for 5 users and 1 million rows.
- Premium plan, costing 145€ per month, with 15 users and 5 million rows.
- Enterprise plan, priced at 575€ per month, with 50 users and 50 million rows.
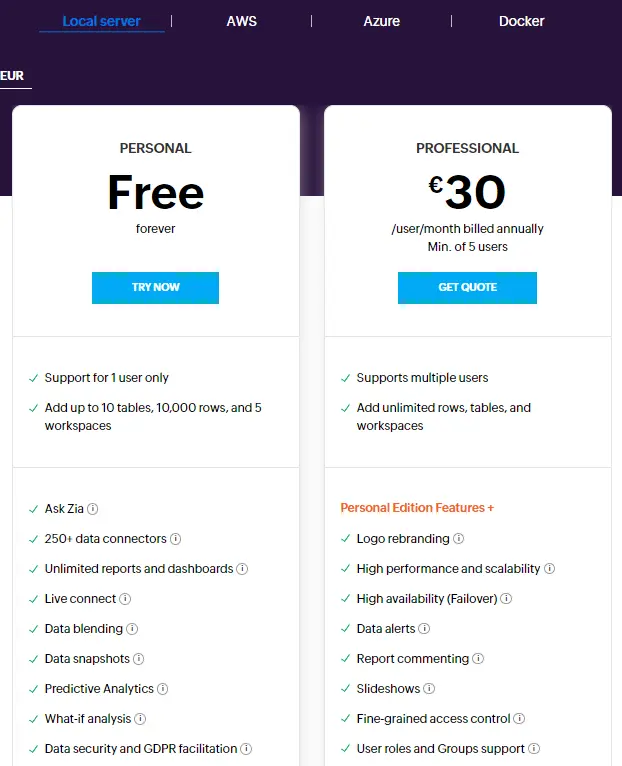
However, choosing the on-premise solution will lead to reduced expenses. Here is a comprehensive breakdown:
- Freemium Zoho is suitable for personal use.
- Professional plan is priced at 30€ user per month if you add 5 users.
What Are Zoho Limitations and Cons?
- Customers complain about the lack of learning videos and resources for onboarding process.
- The costs can add up, however, it’s still relatively reasonable compared to previous BI tools.
- A significant learning curve persists.
- The user experience lacks sufficient intuitiveness, and certain reports may require the assistance of an IT specialist.
- There are some disadvantages to the mobile version.
- Customers complain about the lack of customer support.
- Loading times for embedded charts can be prolonged.
- Full utilization of the platform still requires a grasp of SQL.
Who are The Ideal Users For Zoho?
- Non technical teams.
- Users who are not fluent in data analytics.
- Small to medium businesses.
- Analysts who work with SQL.
Related Article: Master real estate data visualization
4. Trevor
Fast set-up, no SQL knowledge needed and no-code embedded dashboards to level up your non-tech teams. Trevor is a BI platform that is created to free up your engineers, let’s take a look at the features and benefits for this tool.
Benefits and Features
- BI platform is for non-tech teams who don’t know SQL.
- Dashboard creation and data visualization.
- Data alert setup available.
- Self-service platform with no-code editor.
- No-code embedded dashboards for applications.
- Fast set-up.
- Different workflows with possibility to send data to other applications.
- Data sources available from different applications.
Pricing
Trevor pricing is separated in three sections:
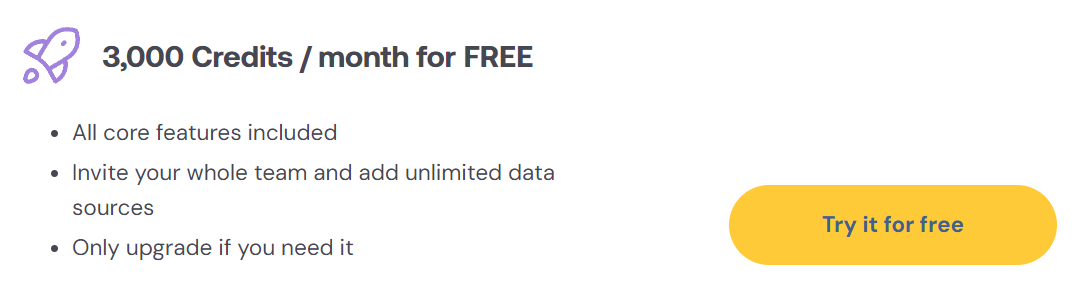
1. Freemium plan with 3000 credits per month with all core features included.
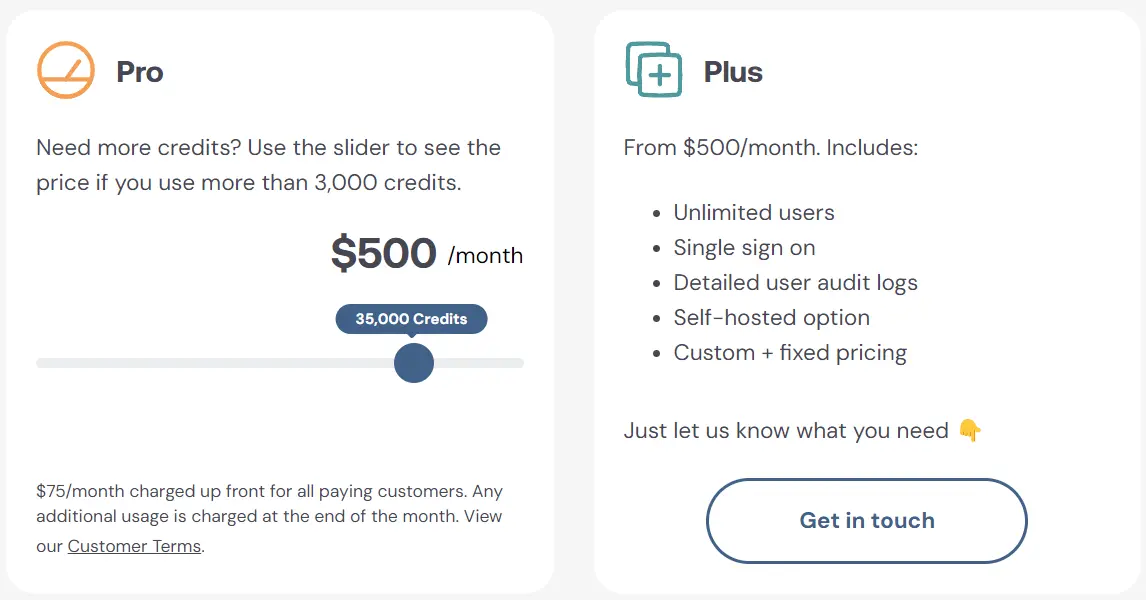
2. Pro plan will cost you 75$ per month and includes 5000 credits. You need to upgrade this plan once you need more credits. Purchasing this plan will let you get more credits. In this plan you will be billed at the end of the month for all the credits you’ve overused. The more credits you need – the more you need.
3. Plus plan costs 500$ a month and includes unlimited users, single sign on, self-hosted option, custom pricing.
Trevor Limitations & Cons
- You can’t upload data manually via files, you can only connect with databases.
- The data sources options are very limited as you can’t combine different databases.
- Limited editing options, it’s hard to align or resize elements evenly. Visuals are very limited.
- Limited information about the company.
Ideal Users
- Non-tech teams
- Small organizations who have only one data source.
Related Article: Data visualization principle’s and best practices
5. Datapad
Datapad is a tool created for small organizations and non-tech teams to power data driven culture. This tool was created so that even grandmas could create reports. Let’s take a look at the benefits and limitations that this tool represent.
Features and Benefits
- No code or complex setups is needed.
- Get that from multiple pre-built integrations and data sources
- More than hundred of pre built KPI templates
- Report sharing with others using public links
- Collaborate and comments data together with colleagues
- Automated reports and scheduled reporting emails
- Mobile applications.

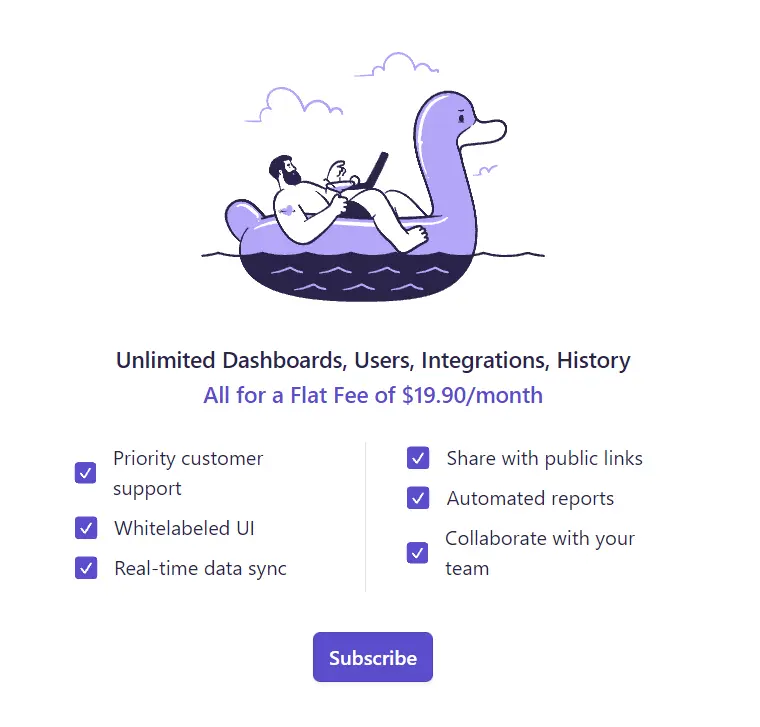
Pricing plan
Datapad provides free trial. And only one pricing plan that is easy to understand, unlimited everything for a 19.90 per month.
Datapad limitations & cons
- Very simple tool with small customization opportunities
- Small amount of data sources
Ideal Users
- Solo entrepreneurs and individuals who need few visualizations
- Organizations with small amount of data
Alternatives to Looker for embedded analytics
The options above are good examples of alternatives to Looker for its primary use case: self serve data analytics for your internal team. However, if you’re hoping to embed analytics into your application for your customers to consume date, then you’ll want to look for a purpose-built embedded analytics solution to save you the trouble and toil of an in-house build.
It’s important to know that the requirements for a customer-facing use case are different. For example you’ll want it to load really fast, look and feel like your platform, and play nicely with your database/stack. Embedding a traditional BI tool with an iframe means you’ll be limited to their menu of charts and components, and typically have to embed using an iframe. Embeddable’s headless embedded analytics tool may be worth exploring. It will give you the full control and flexibility of an in-house build; allow you to manage dashboards easily in an intuitive CRM; and load really fast (with no iframes).
Other Looker Alternatives
Data visualization market is full with solutions and BI tools. Here are a few more tools that are worth mentioning as alternative for Looker:
- Power BI: this BI platform is one of the most popular data visualization tools out there. However, it’s not entirely great solution for non-tech teams.
- Tableau: pioneer in data visualization field and one of the most advanced platforms out there. You will need help from IT and analytics experts to help you set up these dashboards.
- Qlik Sense: another platform that requires advanced knowledge and some coding.
Summary
I hope you had a chance to review many Looker alternatives. Here’s another comparison with most popular features for all Looker alternatives to help you decide.
| Feature | Looker | Ajelix | Klipfolio | Zoho | Trevor | Datapad |
|---|---|---|---|---|---|---|
| Coding needed | ||||||
| Pricing | From 5000$ | 20$-200$ | 300$-800K$ | 30$-575$ | 75$-500$ | Free |
| Easy Pricing | n/a | |||||
| Freemium | ||||||
| Automatic Data Refreshing | ||||||
| AI Data Analytics |
Frequently Asked Questions
Best alternative for each organization will differ. It depends from the size of the company, data amount and goals that you are trying to achieve. Review each tool and compare does this tool support your needs? We can only advise for you to try – Ajelix and see if it suits your needs.
No, unless you’re an advanced data analytics expert with knowledge in IT and SQL. As it can be a complex process to get the reports and maintain.
So what is the best alternative to Looker? That’s the question only you can answer.
Ready to test Ajelix?
From data to report in one minute or less with Ajelix AI Agents


