19+ Small Business KPIs To Measure
As a small business owner, you are improving your business and making it more successful. But how do you know if you’re on the right track? That’s where small business KPIs come in.
KPIs are values that measure the performance of your business against specific goals. By tracking your KPIs, you can get real-time updates on how your business is doing and identify areas where you can improve.
This article will help you understand the main KPIs that small business owners should track. We will explain formulas and provide tools to help you manage this process more easily.
Change the way you work with agentic AI
One-click dashboards,KPI tracking, and AI-powered insights—for work that actually gets done.

5 Key Points Why Track Small Business KPIs
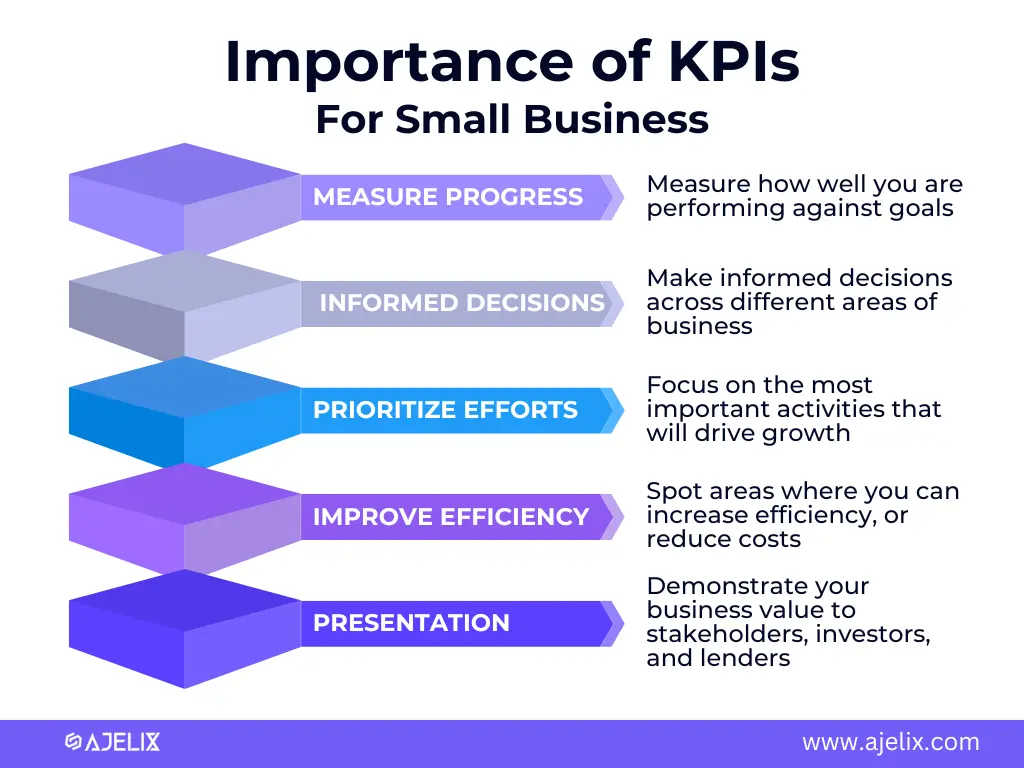
Key Performance Indicators (KPIs) are measurable values that help you track progress toward achieving your goals. For you, a small business owner, tracking KPIs is crucial for several reasons:
- Measuring your progress and success: KPIs provide a clear and objective way to measure how well you are performing against your goals. By metrics over time, you can identify areas of strength and weakness, and make data-driven decisions to improve your business.
- Making informed decisions: KPIs can help with decision-making across your business, from marketing and sales to operations and finance. By understanding how your KPIs are trending, you can make better decisions about allocating resources, investing in new initiatives, and responding to changes in the market.
- Prioritizing efforts: KPIs can help you prioritize your efforts and focus on the most important activities that will drive growth and success. By tracking the metrics that matter most to you, you can identify areas where you can make the most impact.
- Areas for improvement: identify areas where you can improve your business. Track trends and compare your performance to benchmarks, so you can spot areas where make changes to increase efficiency, reduce costs, or improve customer satisfaction.
- Demonstrate your value to stakeholders: present the value of your business to stakeholders, such as investors, lenders, and partners. By tracking and reporting on key metrics, you can show how your business is performing and the impact that you are making.
Tracking KPIs is not just about numbers on a spreadsheet; it’s about using data to drive continuous improvement and achieve your business goals. For deeper insights into setting effective business metrics tailored to your industry, check this article that provides step-by-step guidance on implementing data-driven strategies.
Top 19 Small Business KPIs
- Revenue Growth
- Profit Margin
- Return on investment (ROI)
- Gross Margin
- Expense Ratio
- Customer Lifetime Value (CLV)
- Customer Acquisition Cost
- Customer Churn Rate
- Average Order Value
- Customer Satisfaction
- Conversion Rate (CR)
- Lead Generation Rate
- Sales Cycle Length
- Average Sale Size
- Website Traffic
- Social Media Engagement
- Email Marketing Open Rate
- Email Marketing Click-Through Rate
- Search Engine Optimization (SEO) Ranking
Today, we’re diving into the world of KPIs, specifically focusing on the different types that are crucial for small businesses like yours. Let’s explore each category and its key metrics, so you can start tracking and optimizing your business’s performance like a pro.
Download PDF Cheat Sheet with 18 small business KPIs 👇
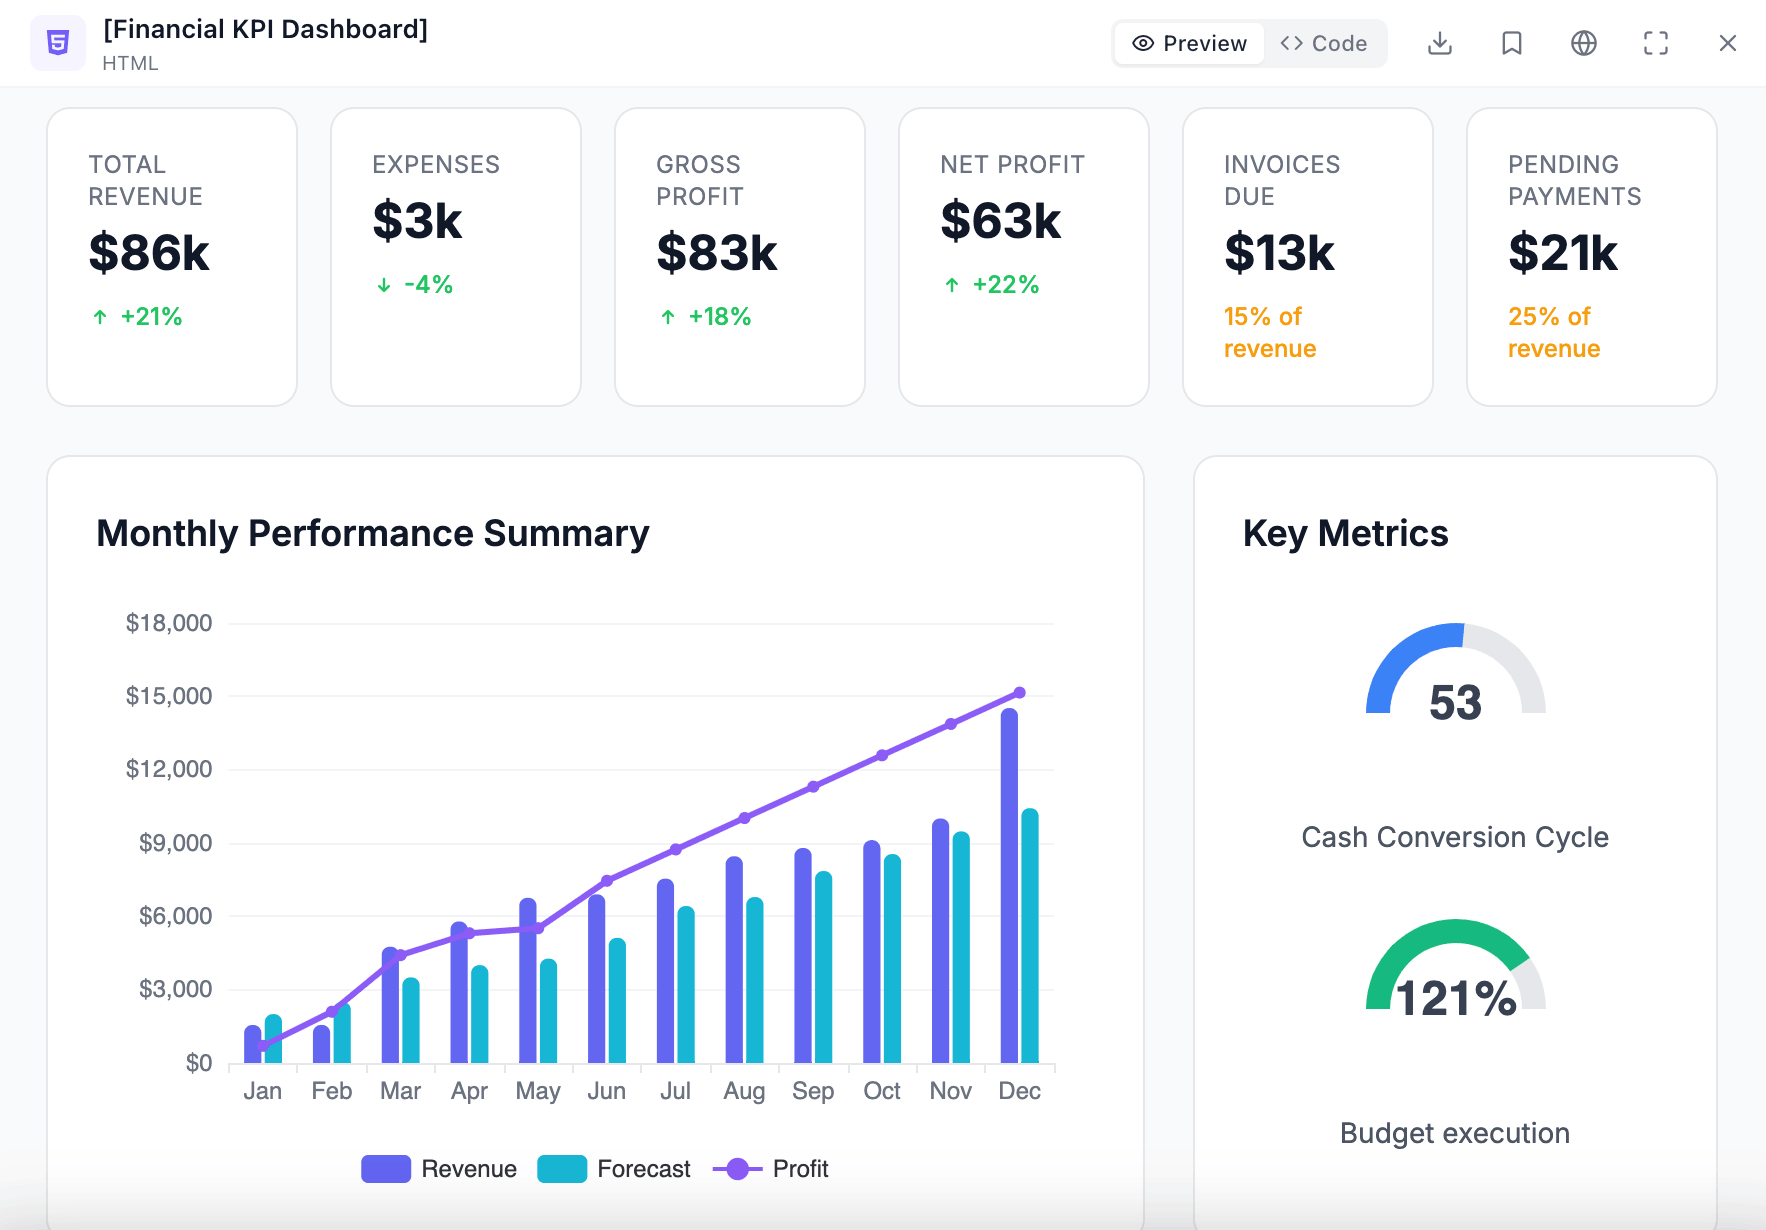
Small Business Financial KPIs
Financial KPIs paint a picture of your business’s financial health, giving you insights into its revenue, profitability, and cash flow.
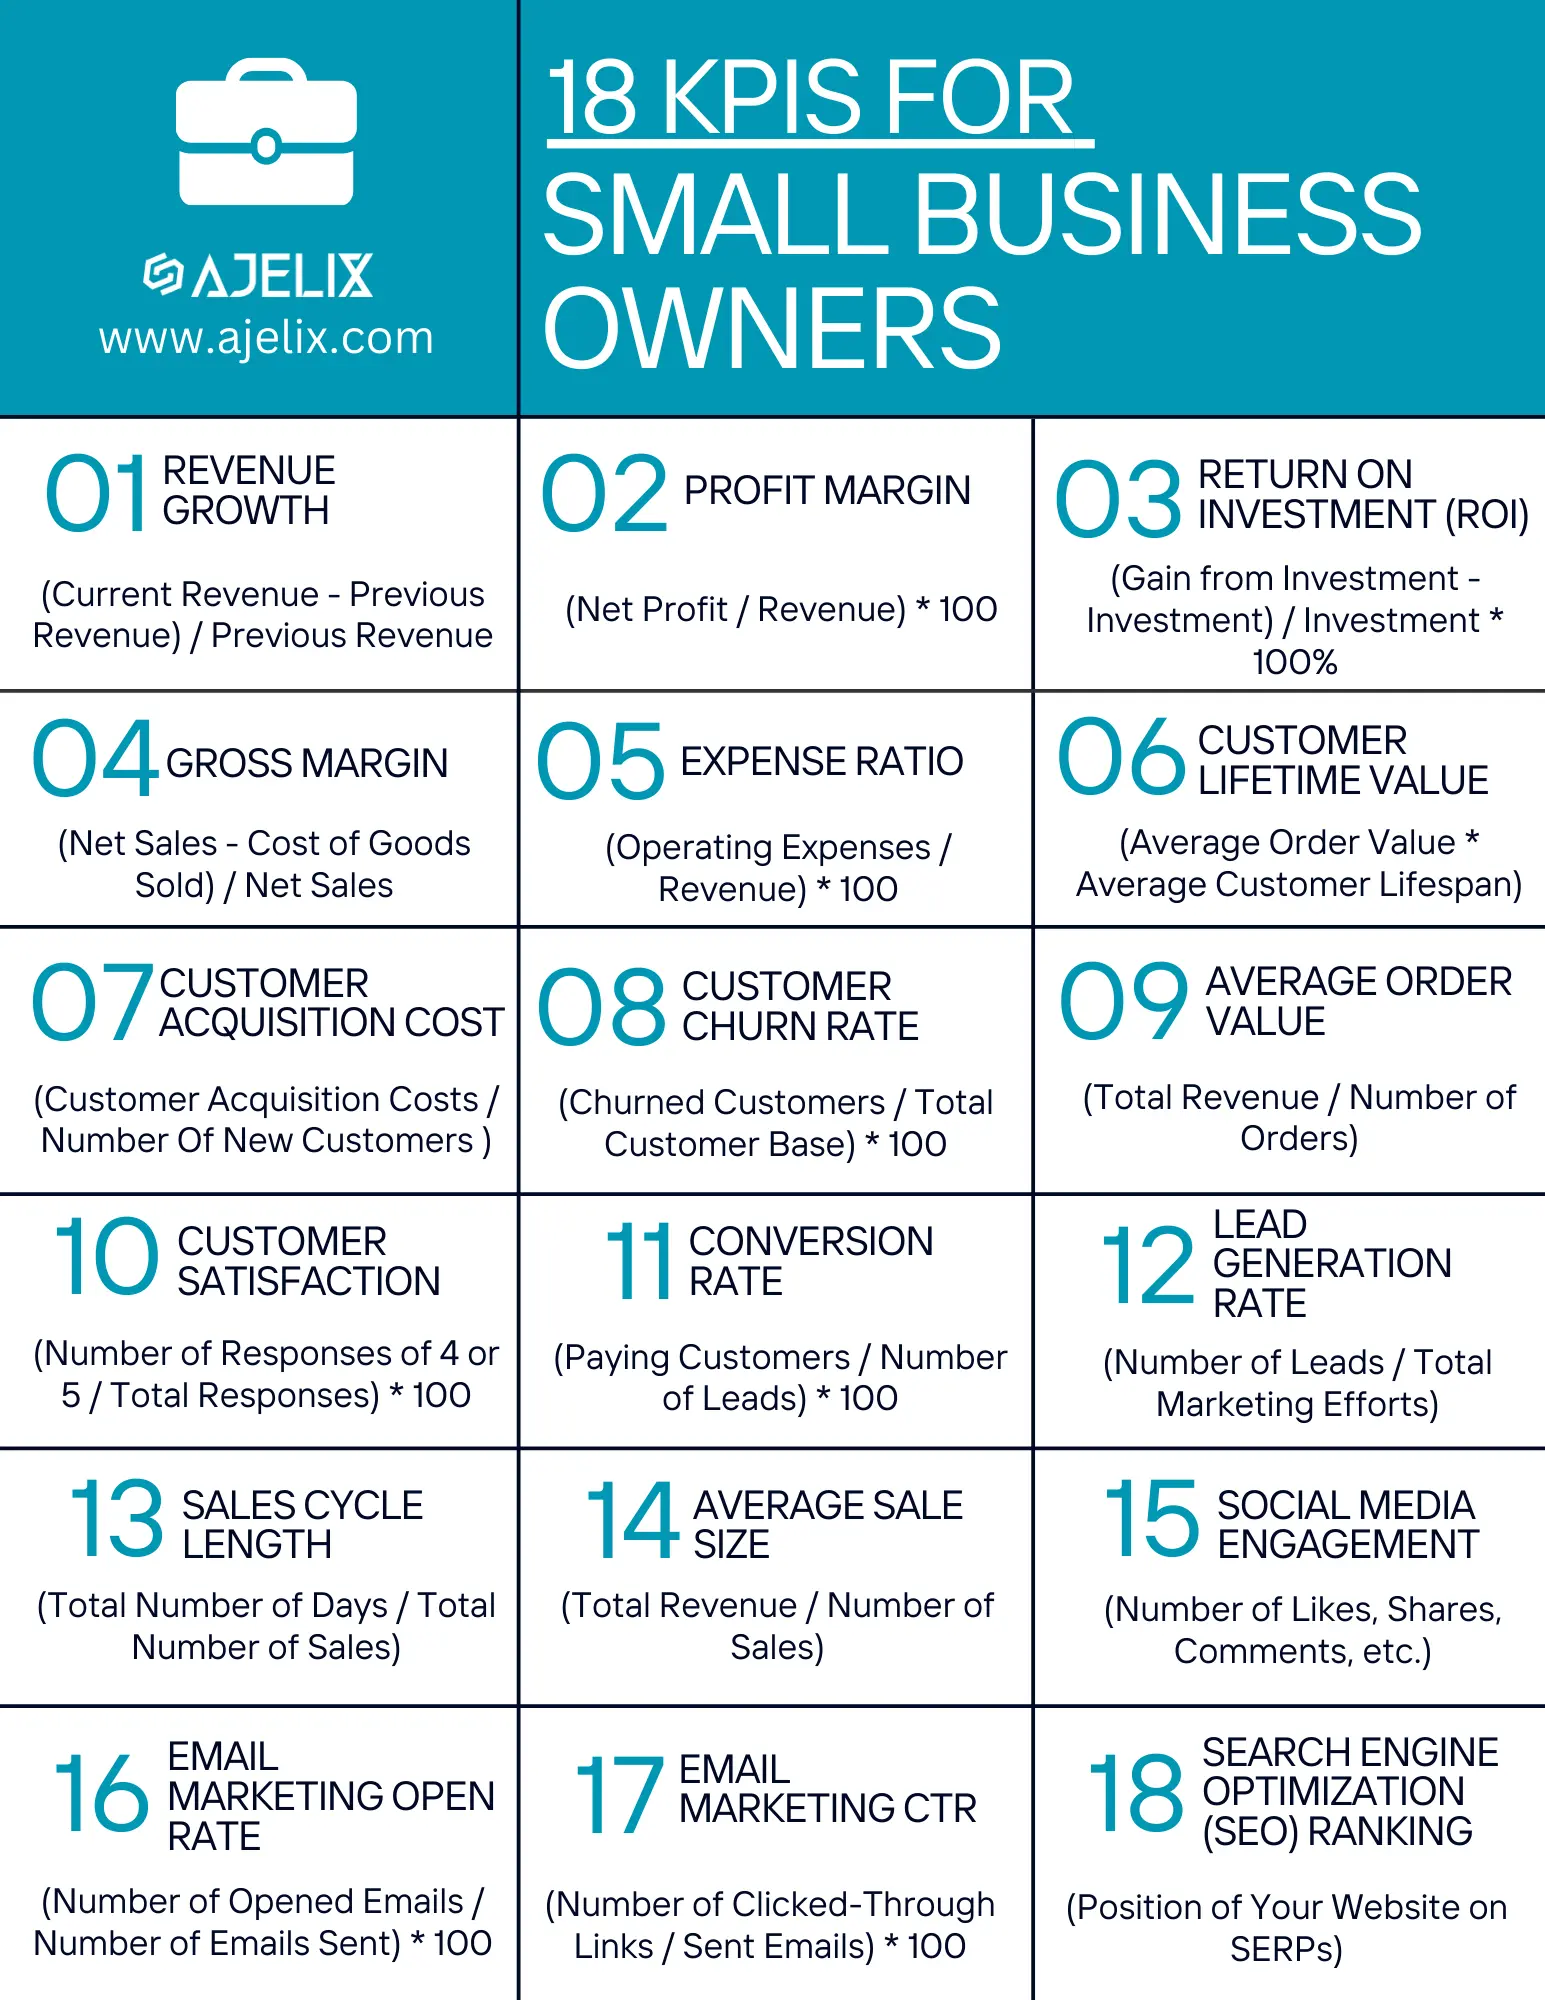
1. Revenue Growth
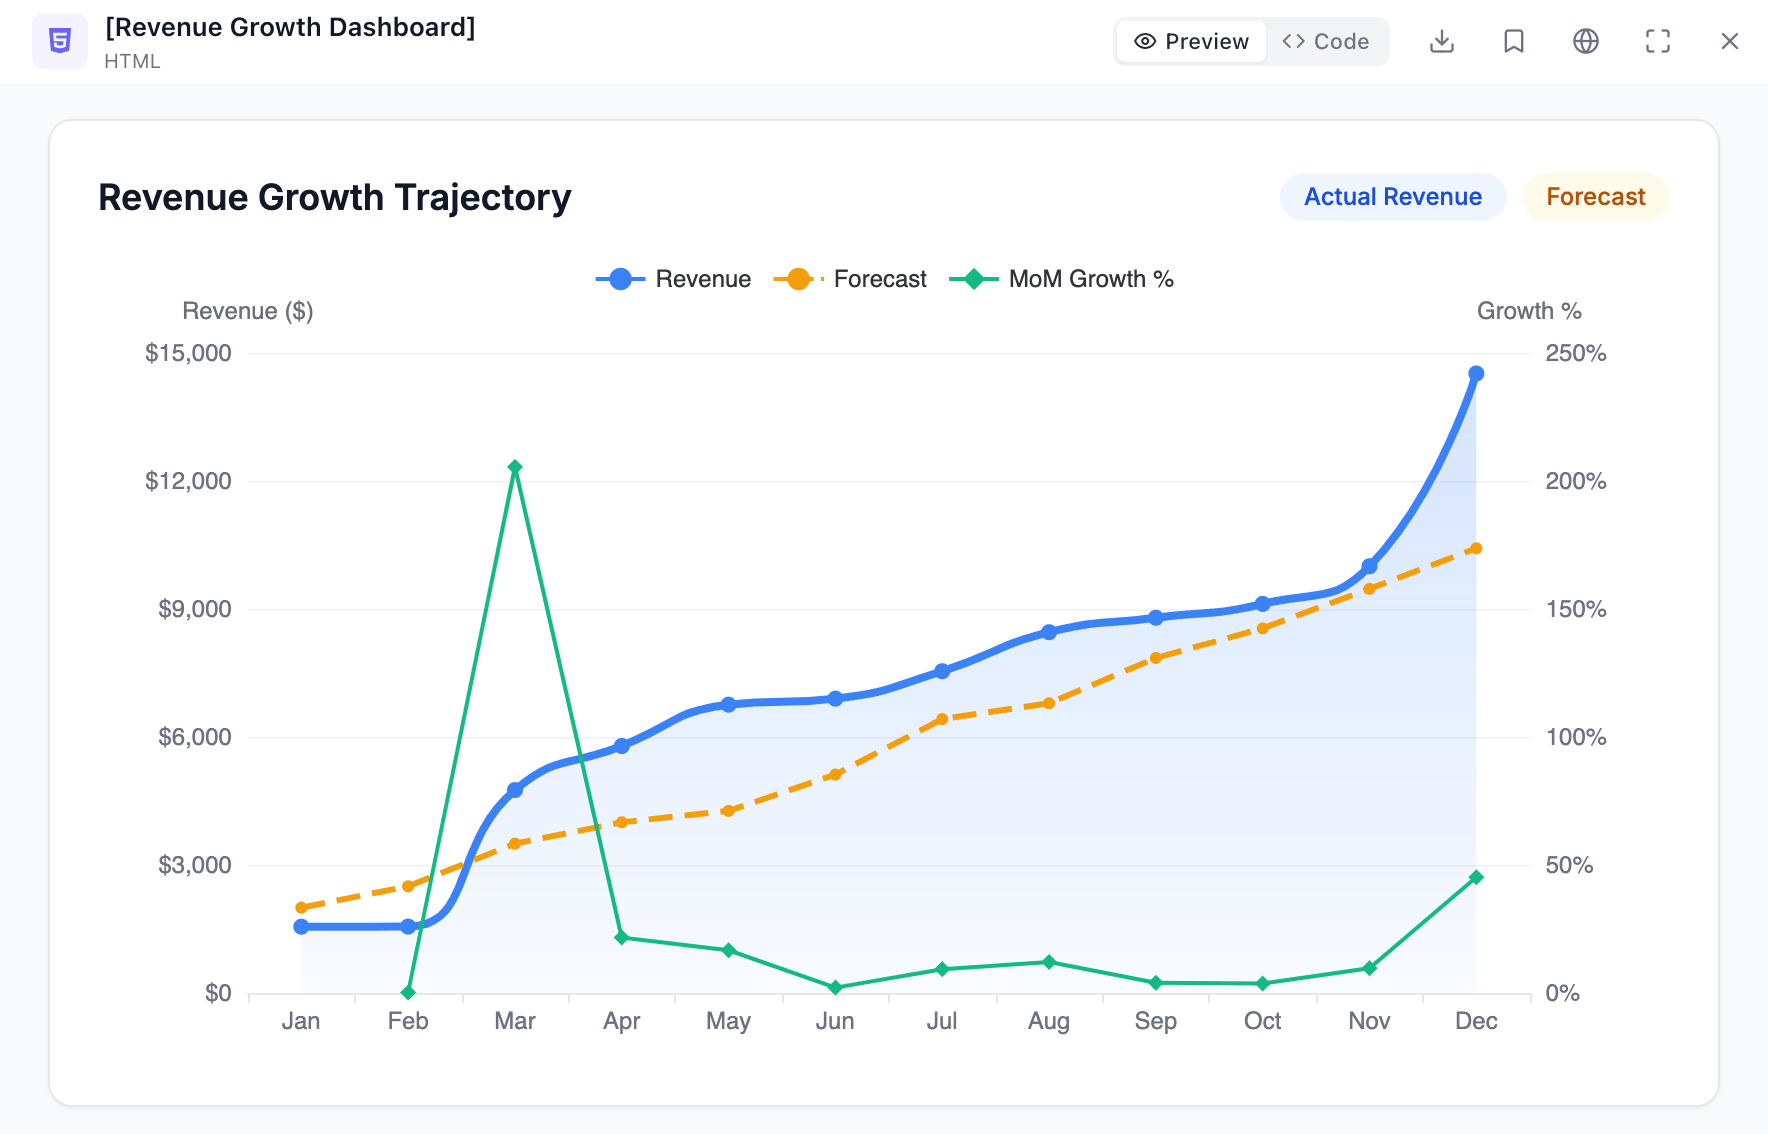
This metric measures the percentage increase in your total revenue over time. It’s a great indicator of your business’s ability to attract new customers and generate sales.
To calculate your revenue growth, use the formula:
Revenue Growth = (Current Revenue - Previous Revenue) / Previous Revenue
2. Profit Margin
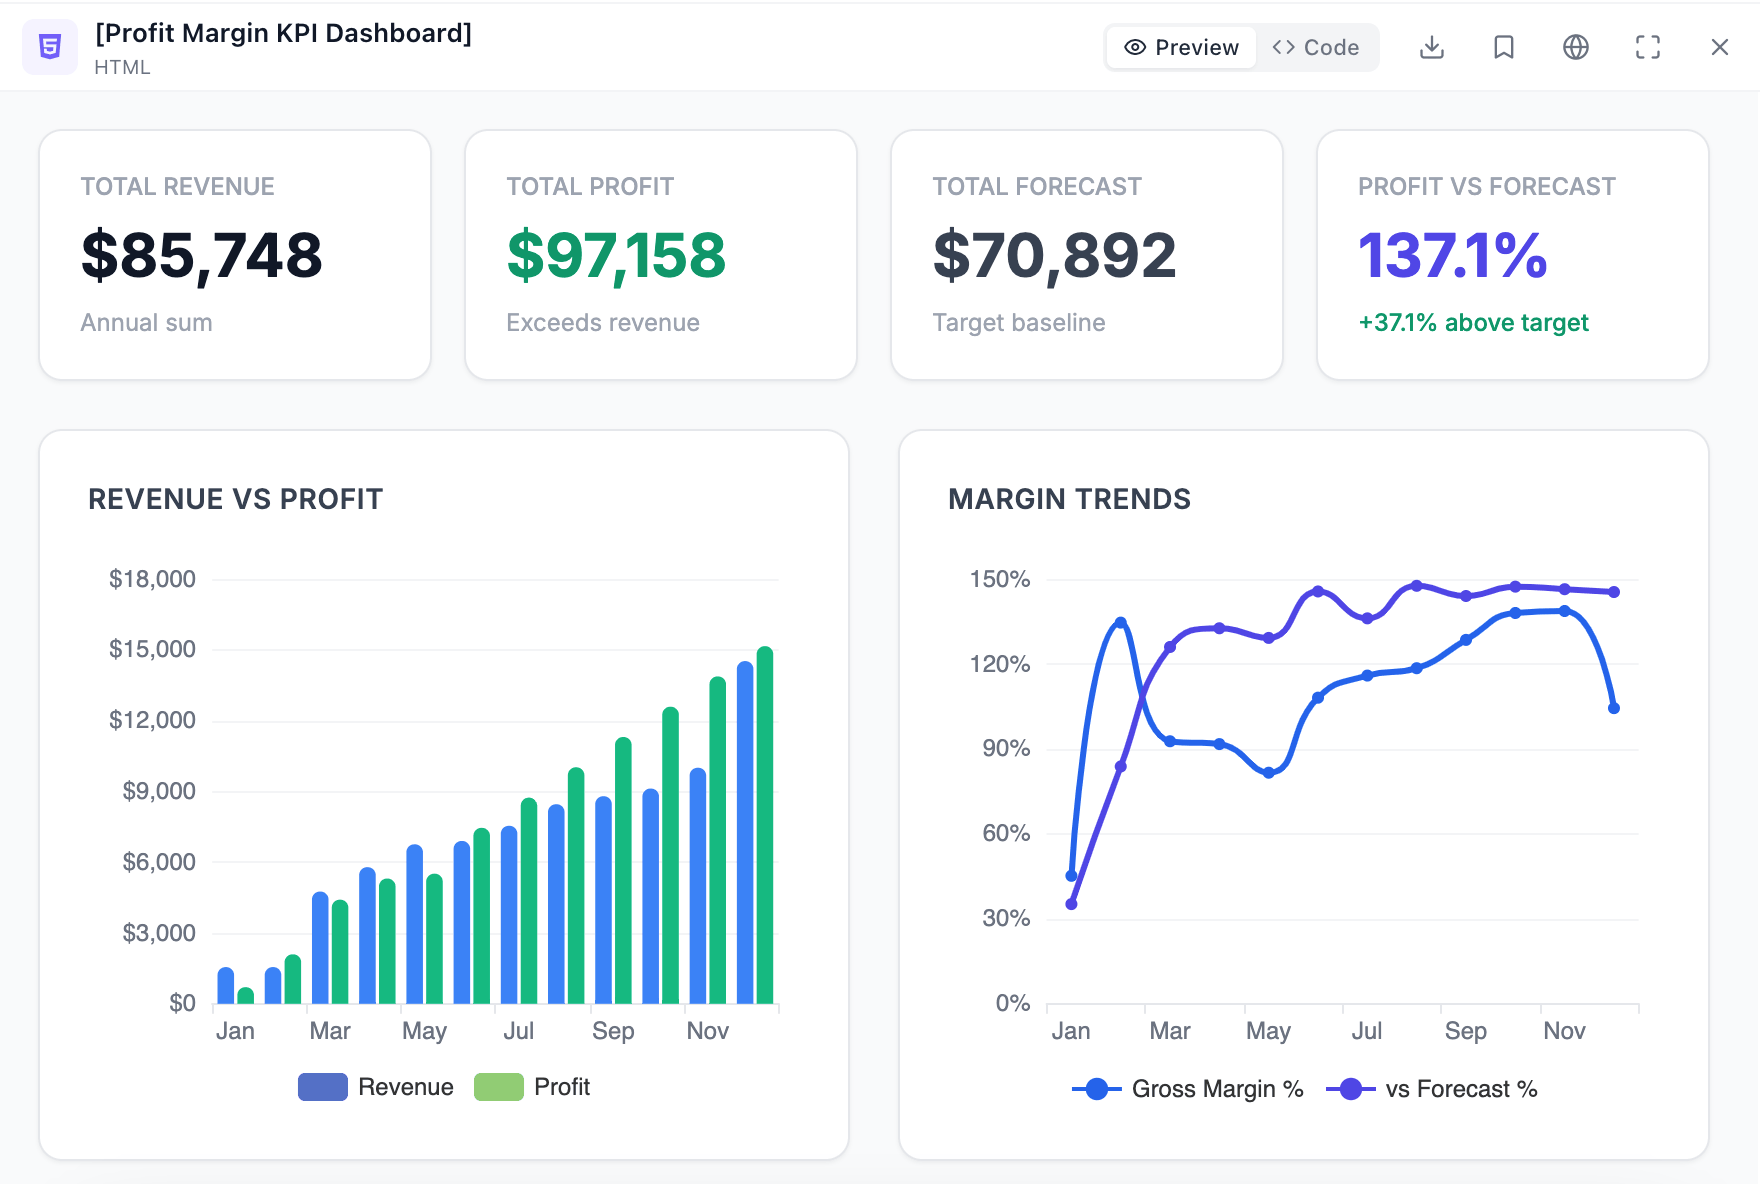
This KPI represents your business’s profitability, showing how much revenue you’re turning into profit. A large profit margin indicates a more efficient and profitable business. To calculate your profit margin, use the formula or use online margin calculator:
Profit Margin = (Net Profit / Revenue) * 100
3. Return on investment (ROI)
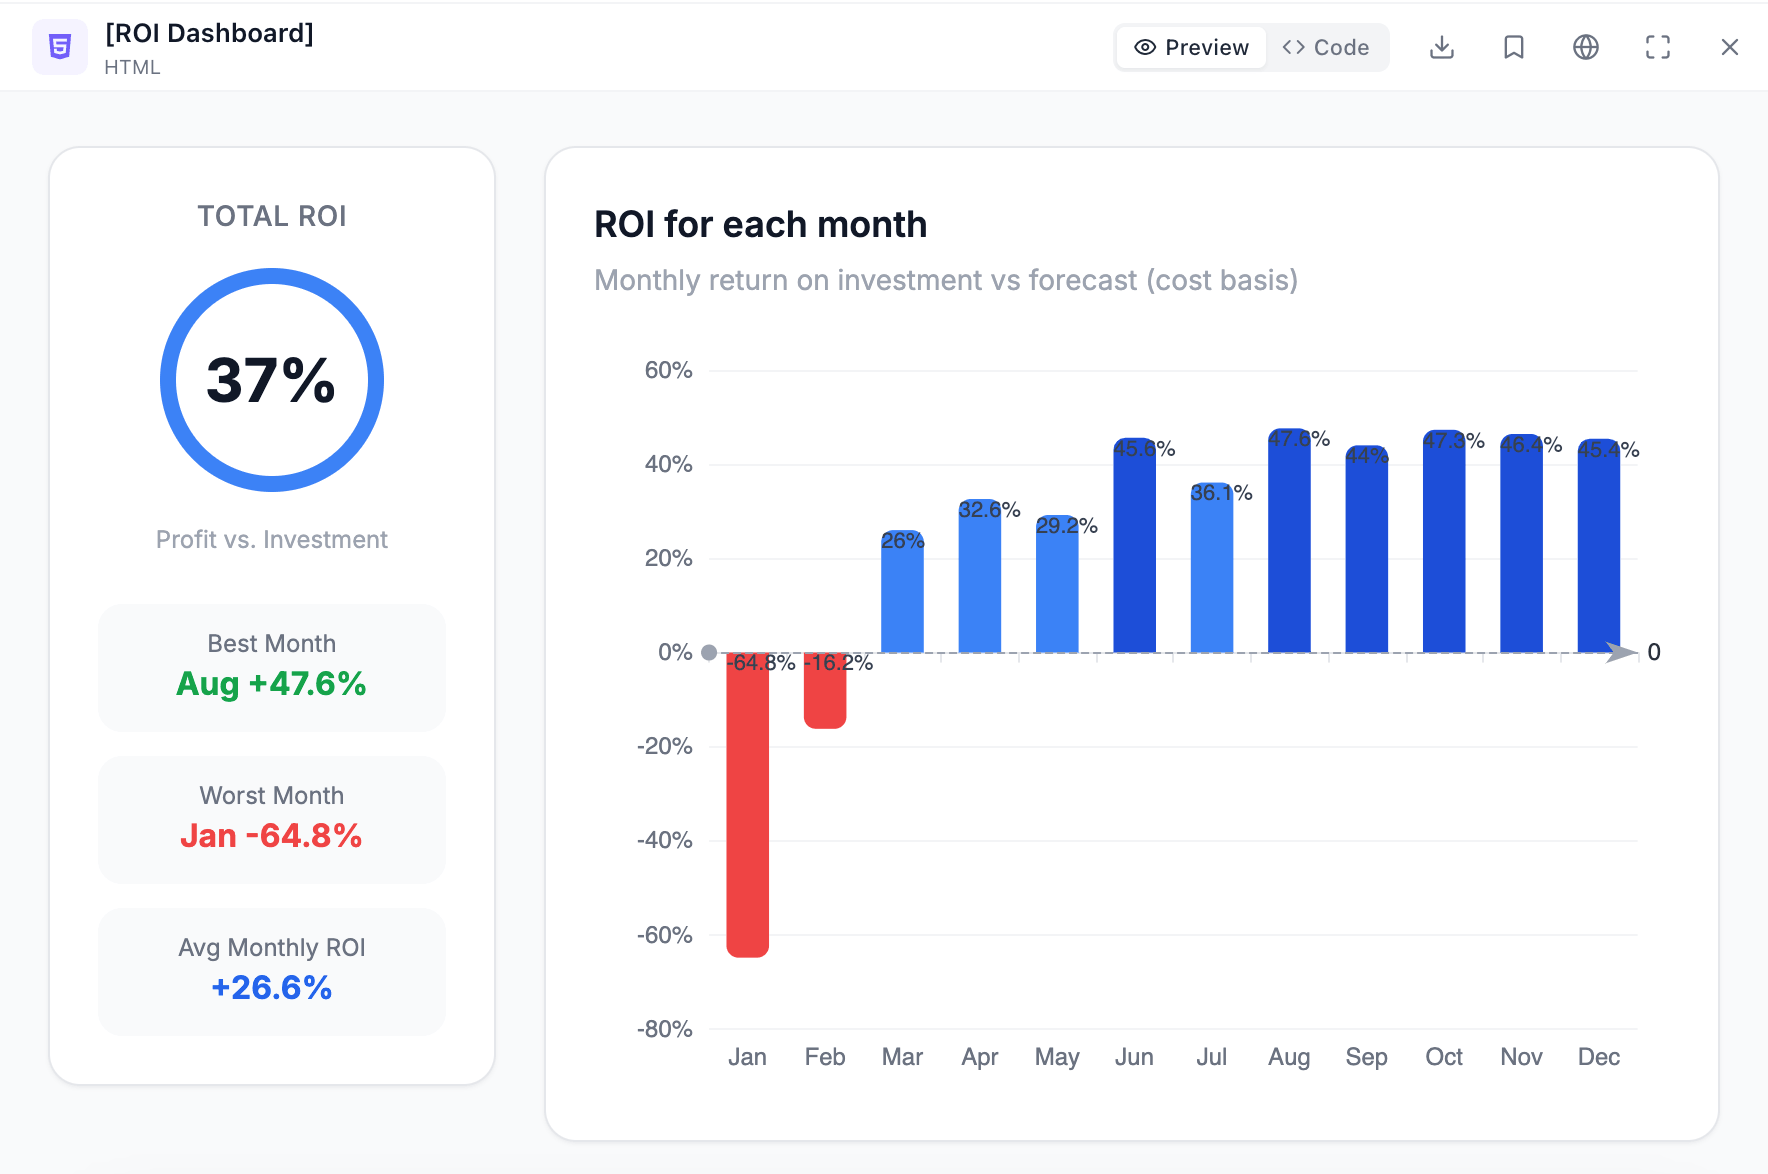
Measure the profitability or efficiency of an investment. It expresses the net gain or loss on an investment relative to the cost of the investment.
ROI = (Gain from Investment - Cost of Investment) / Cost of Investment * 100%
A positive ROI indicates that the investment was profitable, while a negative ROI indicates that it was a loss. You can calculate this metric using a data visualization tool or using an online ROI calculator.
4. Gross Margin
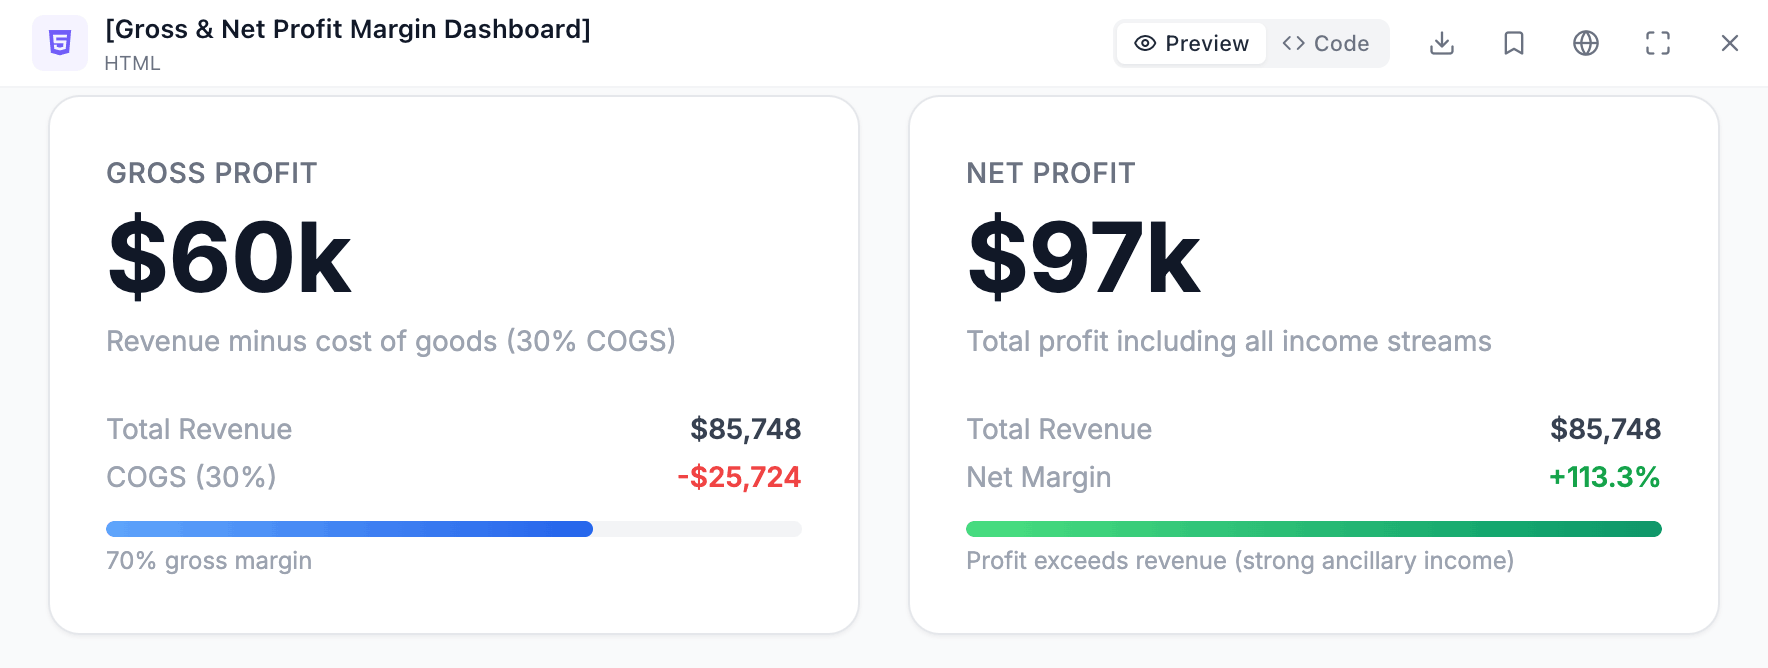
This KPI measures your profit before deducting operating expenses. It represents the percentage of revenue that remains after covering the cost of goods sold. To calculate your gross margin, use the formula or gross profit calculator:
Gross Margin = (Net Sales - Cost of Goods Sold) / Net Sales
5. Expense Ratio
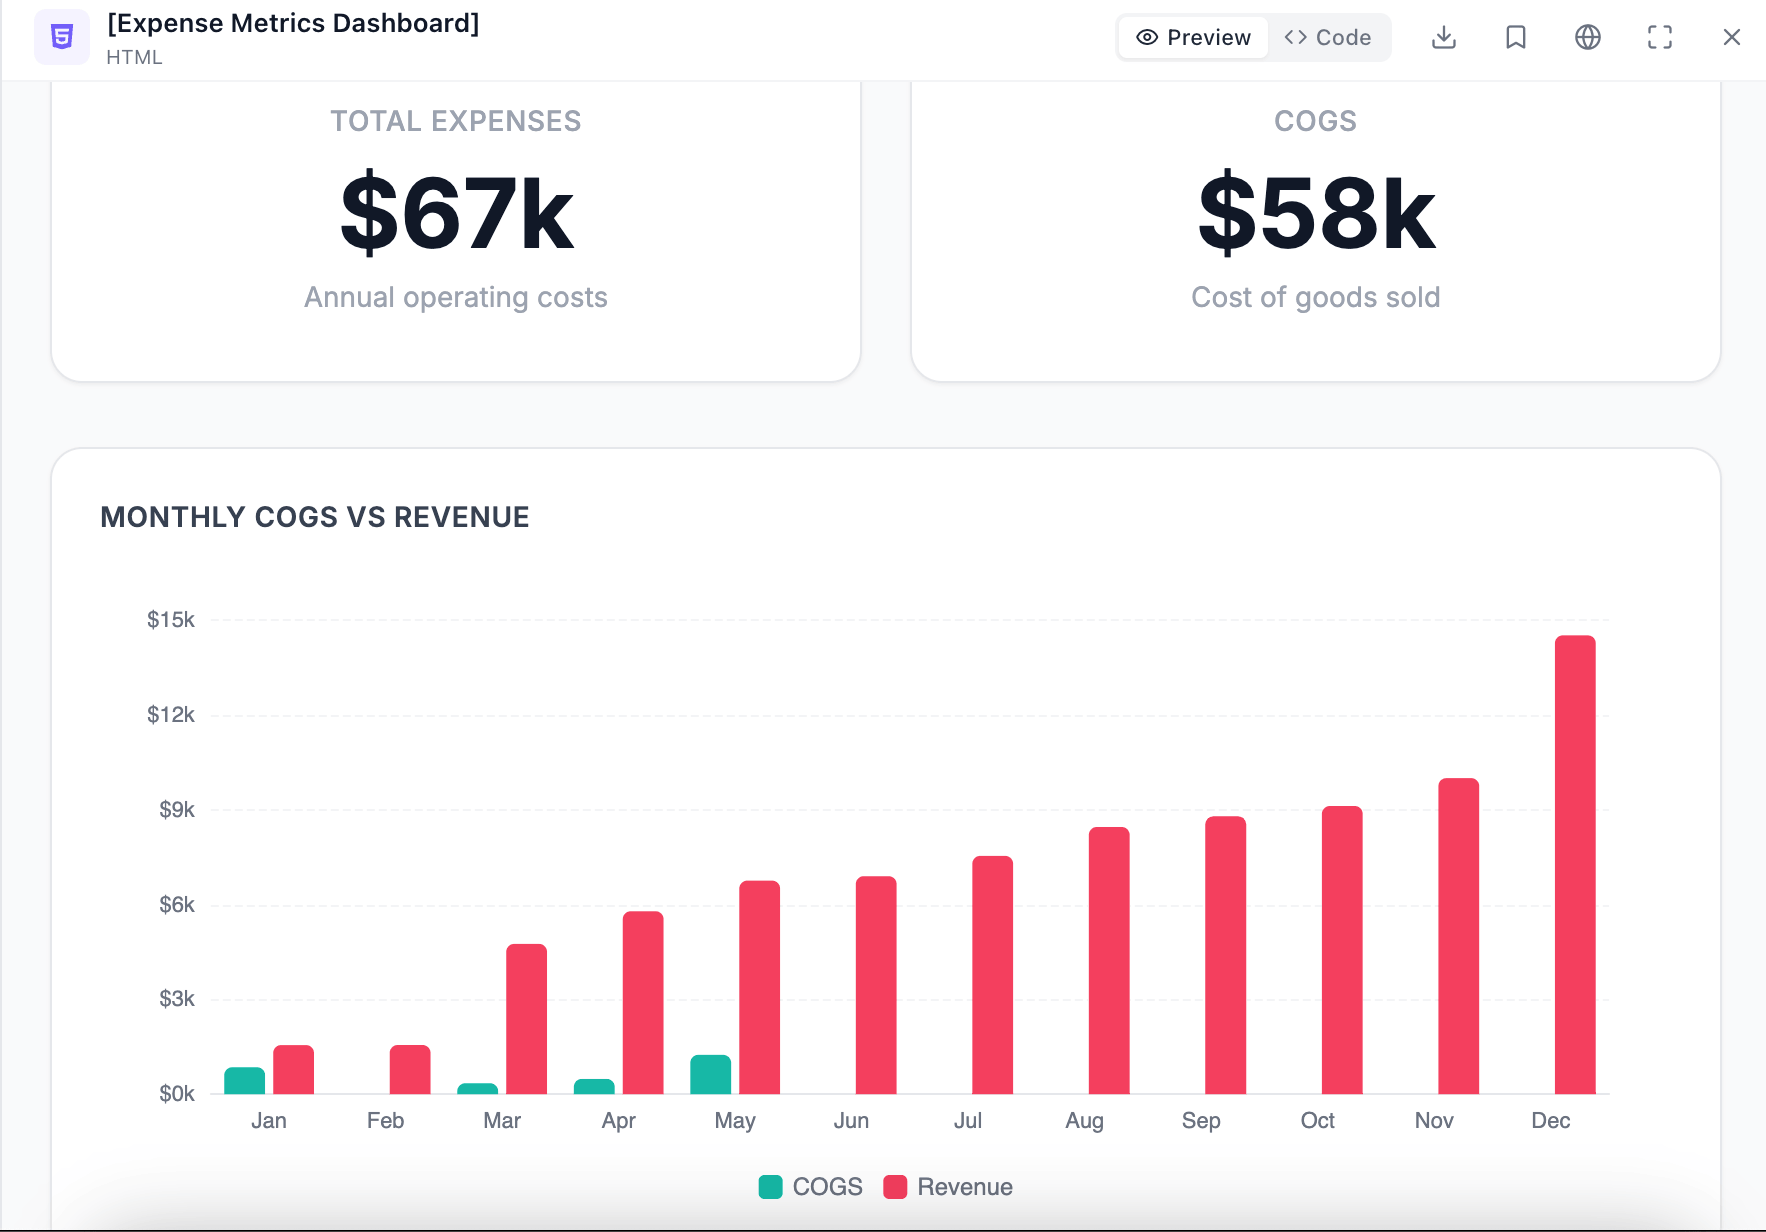
This KPI tracks the proportion of your revenue that goes towards operating expenses. A lower expense ratio indicates a more efficient use of resources. To calculate your expense ratio, use the formula:
Expense Ratio = (Operating Expenses / Revenue) * 100
Small Business KPIs For Customer Satisfaction
Customer KPIs help you understand your customers’ behavior, acquisition, retention, and satisfaction.
6. Customer Lifetime Value (CLV)
This metric represents the average revenue generated by a single customer over their lifetime. A high CLV indicates a valuable customer base that contributes significantly to your business’s profitability. To calculate your CLV, you’ll need to estimate the average customer lifespan and their average order value.
CLV = (Average Order Value * Average Customer Lifespan)
7. Customer Acquisition Cost (CAC)
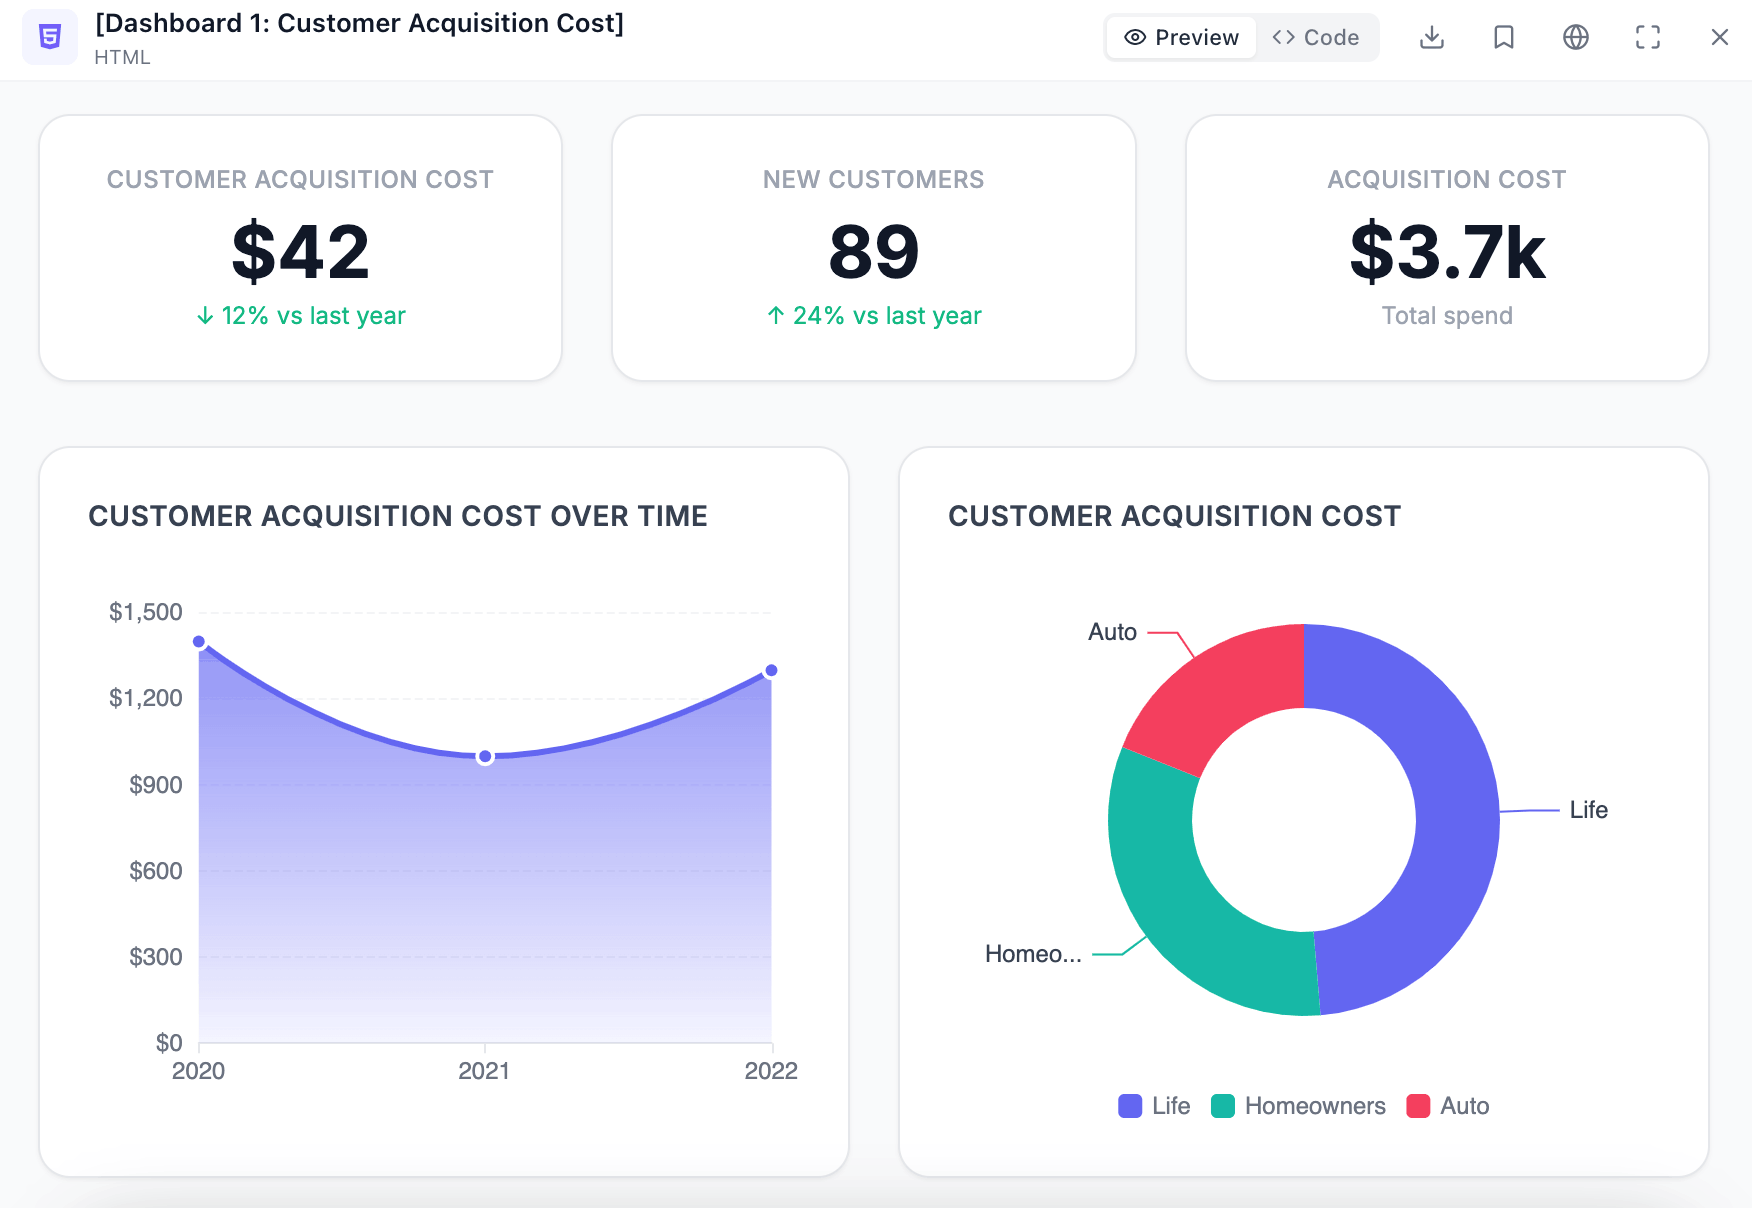
This KPI measures the average cost of acquiring a new customer. A low CAC indicates you’re efficiently attracting and converting potential customers into paying customers. To calculate your CAC, consider all the costs associated with acquiring new customers, such as marketing campaigns, advertising, and sales commissions.
CAC = (Total Customer Acquisition Costs / Number of New Customers Acquired)
You can calculate this metric using the CAC online calculator.
8. Customer Churn Rate
This metric indicates the percentage of customers who stop doing business with you over a given period. A high churn rate suggests customer dissatisfaction and the need for improvement. To calculate your churn rate, divide the number of customers who churned by the total number of customers.
Churn Rate = (Number of Churned Customers / Total Customer Base) * 100
9. Average Order Value (AOV)
This KPI measures the average amount of money spent per customer order. A high AOV suggests customers value your products or services and may be willing to pay a premium. To calculate your AOV, divide your total revenue by the number of orders placed.
AOV = (Total Revenue / Number of Orders)
10. Customer Satisfaction (CSAT)
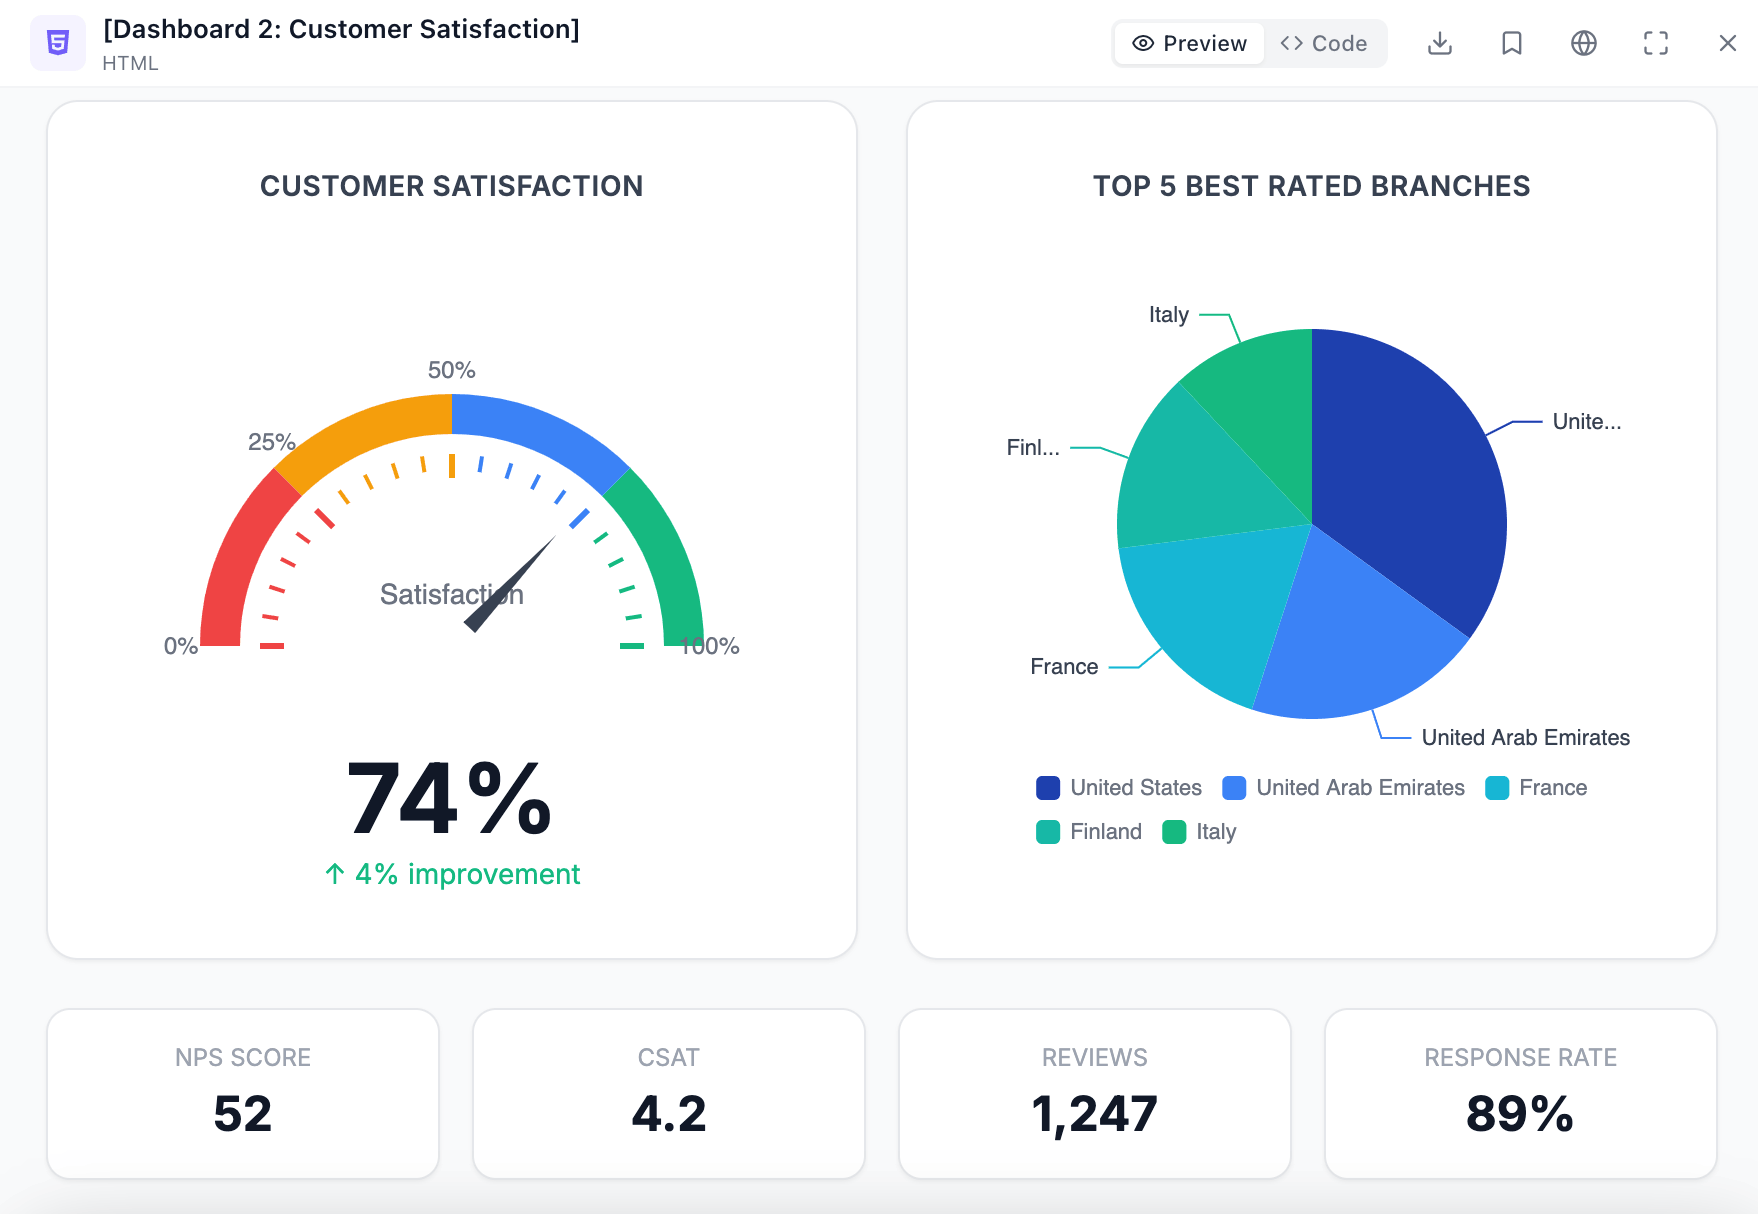
This metric measures the level of satisfaction customers have with your products or services. A high CSAT indicates a loyal customer base that is likely to repurchase and refer others. To measure CSAT, collect feedback through surveys, reviews, or direct interactions with customers.
CSAT = (Number of Responses of 4 or 5 / Total Number of Responses) * 100
Small Business Sales KPIs
As a business owner, you want to ensure your sales processes are efficient and converting leads into paying customers. Here are some essential sales KPIs to track:
11. Conversion Rate (CR)
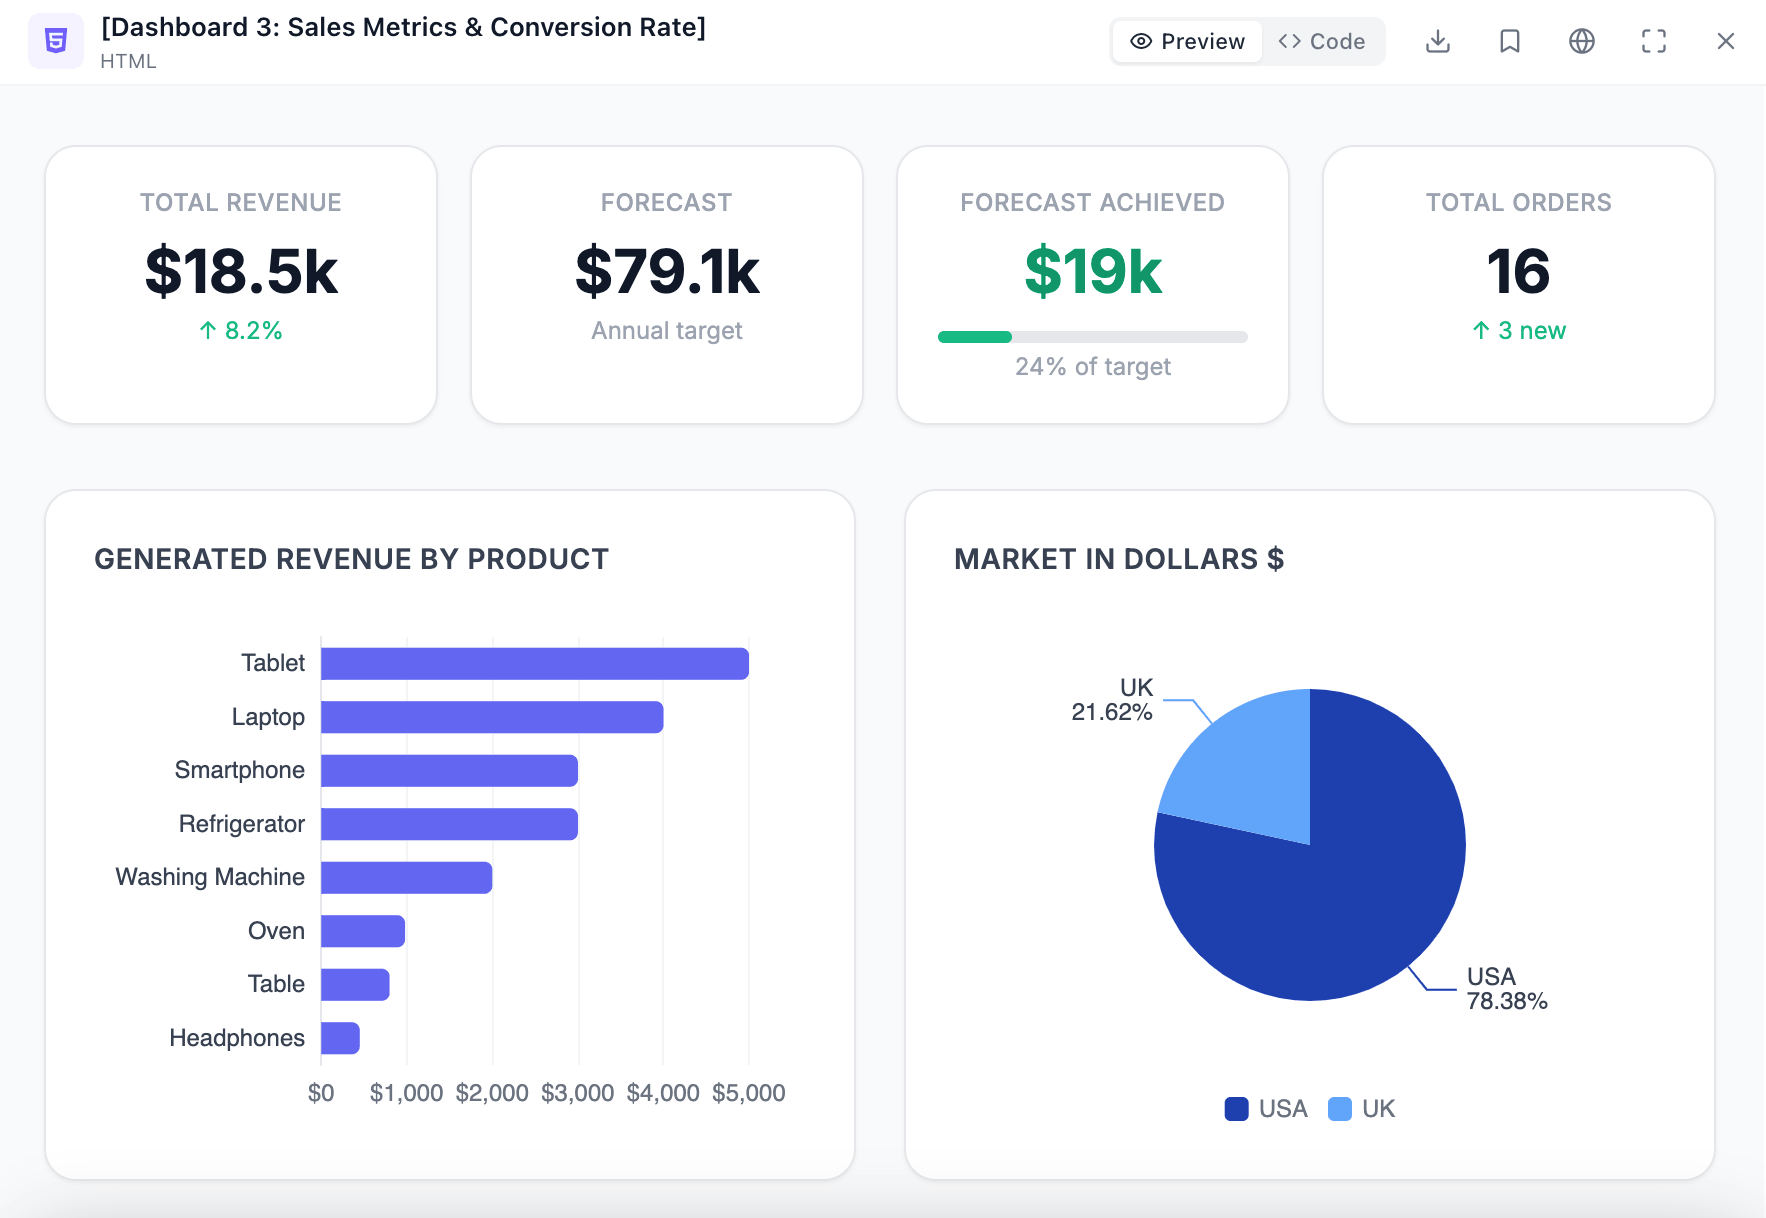
This metric measures the percentage of leads that convert into sales. A high CR indicates that your sales and marketing efforts are generating high-quality leads.
Conversion Rate = (Number of Paying Customers / Number of Leads) * 100
12. Lead Generation Rate
This KPI measures the number of leads you generate per unit of time. A high lead generation rate suggests that your marketing efforts are attracting a significant number of potential customers.
Lead Generation Rate = (Number of Leads / Total Marketing Efforts)
13. Sales Cycle Length
This metric tracks the average time it takes to close a sale, from initial contact to purchase. A shorter sales cycle indicates a more streamlined and efficient sales process.
Sales Cycle Length = (Total Number of Days / Total Number of Sales)
14. Average Sale Size
This KPI measures the average amount of money you generate per sale. A higher average sale size suggests that your products or services are valuable and in demand.
Average Sale Size = (Total Revenue / Number of Sales)
By tracking these sales KPIs, you can identify areas where your sales team can improve and make data-driven decisions to optimize your sales process, enhance conversion rates, and achieve greater sales success.
Small Business Marketing KPIs
Effective marketing campaigns are essential for driving business growth. For better tracking, you can create a CMO dashboard for faster insights. Here are some key marketing KPIs to track:
15. Website Traffic
This KPI measures the number of visitors to your website, indicating the reach of your marketing efforts.
Website Traffic = (Number of Website Visitors)
16. Social Media Engagement
This metric tracks the level of interaction with your brand on social media platforms, showcasing customer engagement and loyalty.
Social Media Engagement = (Number of Likes, Shares, Comments, etc.)
Utilizing AI tools to convert scripts to videos can significantly boost content engagement by making it more dynamic and accessible. Monitoring the performance of these videos helps in refining content strategies to better meet audience preferences and increase overall engagement.
17. Email Marketing Open Rate
This KPI measures the percentage of emails opened by recipients, indicating the effectiveness of your email marketing campaigns.
Email Marketing Open Rate = (Number of Opened Emails / Number of Emails Sent) * 100
18. Email Marketing Click-Through Rate
This metric tracks the percentage of emails clicked on, indicating the interest in your email content and the likelihood of further engagement. Businesses use many different strategies to improve this metric, including leveraging an SPF generator, attaching only necessary files, and keeping their messages short and clear. Businesses use many different strategies to improve this metric, including leveraging an SPF generator, attaching only necessary files, and keeping their messages short and clear. Additionally, they can use a BIMI generator to enhance brand recognition by displaying their logo directly in recipient inboxes, further boosting trust and engagement.
Email Marketing Click-Through Rate = (Number of Clicked-Through Links / Number of Emails Sent) * 100
19. Search Engine Optimization (SEO) Ranking
This KPI measures the position of your website on search engine results pages (SERPs), reflecting the visibility and relevance of your website to search queries.
SEO Ranking = (Position of Your Website on SERPs)
Using SEO tools to check your SEO ranking offers invaluable insights into your website’s visibility and performance on search engines. Monitoring your ranking regularly helps identify optimization opportunities and ensures your content reaches the right audience effectively. Working with experts like Outreach Monks can further enhance your SEO efforts by providing high-quality backlinks and tailored strategies.
By monitoring these marketing KPIs, you can assess the effectiveness of your campaigns in driving website traffic, increasing customer engagement, and improving brand awareness. Leveraging insights from high-quality SEO services and experts like an SEO Agency Sydney, you can make informed decisions to refine your marketing strategies, achieve your business goals, and ultimately drive business growth.
As search evolves, businesses now look beyond traditional SERPs to how AI systems interpret and surface their content. That’s why insights into AI search ranking reveal why certain pages perform well and how information is summarized across different AI tools. This makes SEO even more essential, since strong optimization directly shapes how both search engines and AI platforms evaluate your content.
4 Steps To Select KPIs for Your Business
Time needed: 7 hours
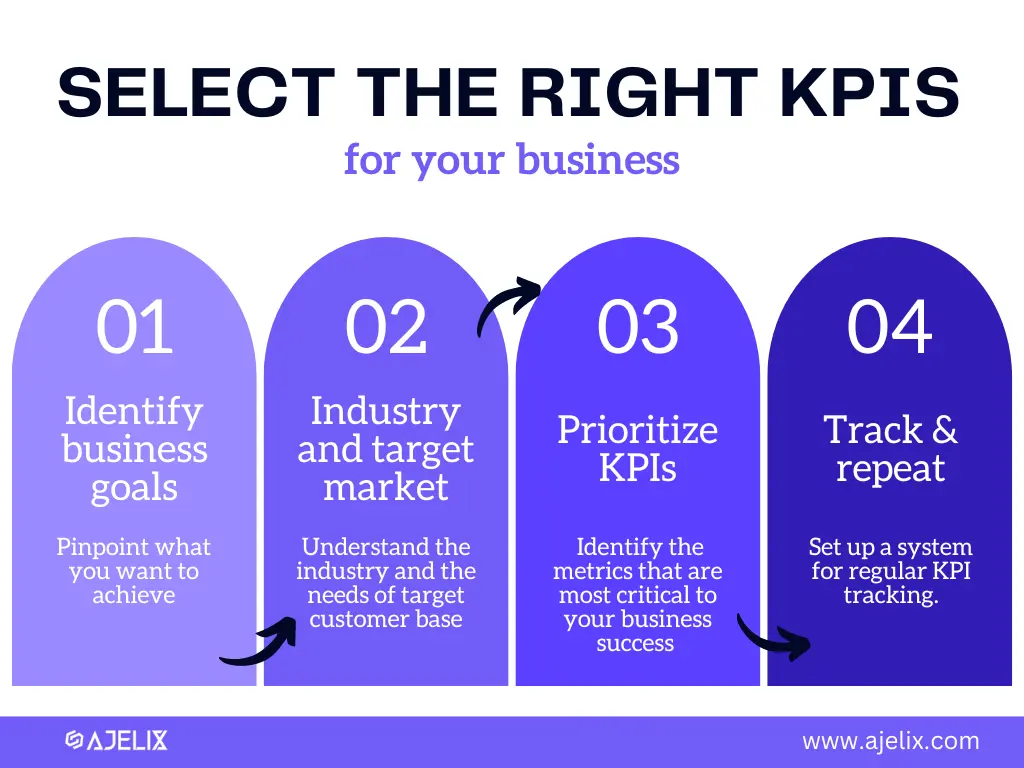
To ensure your KPIs are relevant and actionable, it’s crucial to carefully select them based on your specific business goals, industry context, and target market. Let’s delve into the key steps involved in this process:
- Identify Your Business Goals
Pinpoint the specific objectives you aim to achieve, whether it’s increasing revenue, boosting customer satisfaction, or enhancing brand awareness. These goals will serve as a guiding light for selecting the most appropriate KPIs.
- Consider Your Industry and Target Market
Understand the unique dynamics of your industry and the needs of your target customer base. This will help you choose KPIs that align with the challenges and opportunities specific to your business environment. For example, a furniture company like Multimo may focus on KPIs such as space utilization efficiency, customer satisfaction with multifunctional designs, and the average time from order to delivery to ensure they are meeting customer needs in small living spaces….
- Prioritize KPIs that Matter Most
Not all KPIs are created equal. Identify the metrics that are most critical to your business success and focus on tracking those that will provide the most valuable insights.
- Prioritize and track your KPIs
Once you’ve identified your KPIs, you need to prioritize them and set targets for each one. You should also set up a system for tracking KPIs regularly. This will help you identify trends, make data-driven decisions, and improve your overall business performance.
How To Track And Analyze KPIs?
Tracking and analyzing key performance indicators (KPIs) is essential for small businesses to make informed decisions, measure progress, and achieve their goals. Here are 8 steps on how to track and analyze KPIs for your small business:
1. Identify and Select Relevant KPIs
Assess your business goals, industry dynamics, and target market to identify the most relevant KPIs. Prioritize metrics that align with your objectives and have a significant impact on business success.
You can check our KPI articles to find the right metrics for your business:
- KPIs For HR Department Manager
- KPI For Quality Assurance: Calculate Quality KPIs
- Accounting KPIs For Your Accounting Department
- E-commerce KPIs Any Online Business Should Track
- Financial KPIs For The Finance Department
- Equipment Rental KPIs For Rental Business
- Administrative KPIs For Admin Department Performance
- Insurance KPIs & Metrics For Insurance Agencies
- IT KPIs & Metrics For IT Department With Examples
- Real Estate KPIs & Metrics For Real Estate Agents
- Best Operational KPIs For Operations Manager
- KPIs For Construction Project Management With Examples
2. Establish Data Collection Methods
Determine the data sources that provide accurate and reliable information for tracking your selected KPIs. This may involve using internal systems, external tools, or manual data collection methods.
3. Set Baselines and Targets
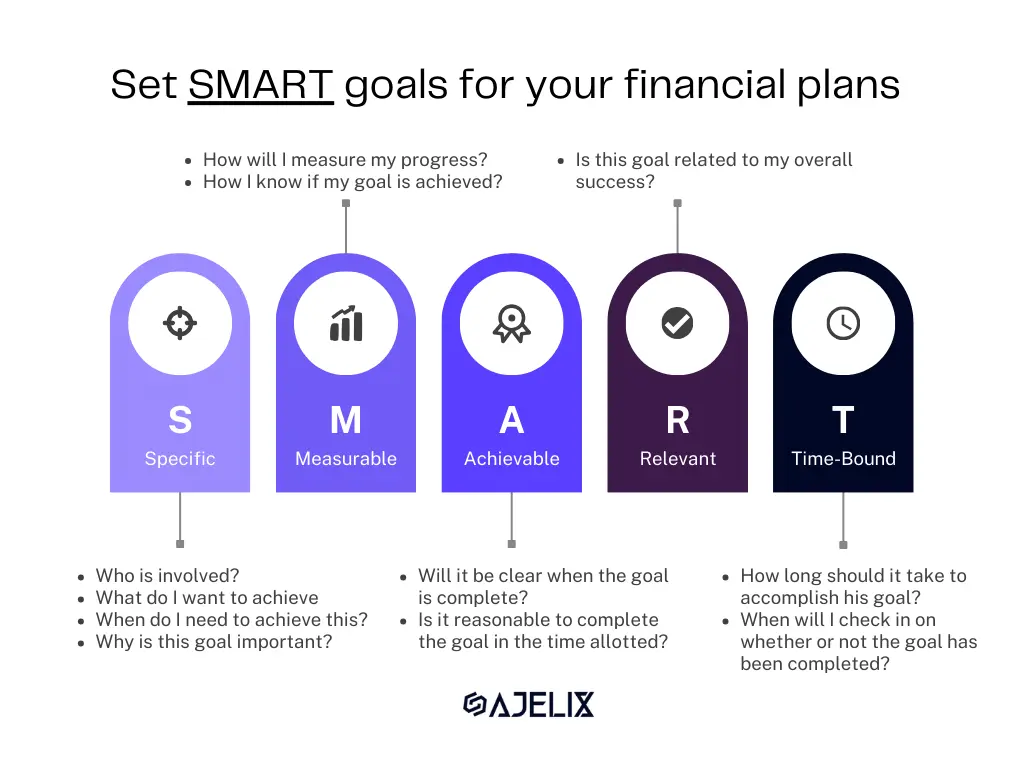
Establish baseline values for each KPI to represent your current performance level. Set SMART (Specific, Measurable, Achievable, Relevant, and Time-bound) targets for each KPI, indicating the desired improvement or achievement.
4. Track and Record Data Regularly
Implement a system for collecting and recording data for your chosen KPIs regularly. This could involve daily, weekly, monthly, or quarterly intervals depending on the nature of the KPI and the need for granularity.
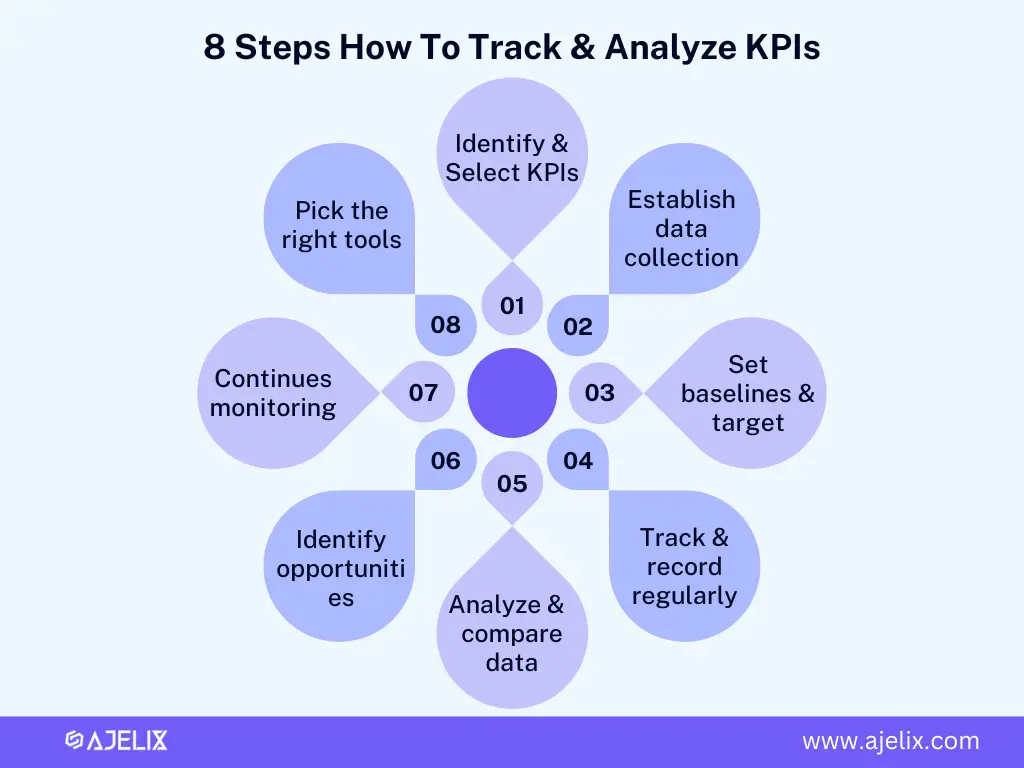
Infographic with 8 steps on how to analyze and track KPIs for small business, created by author
5. Analyze and Compare Data
Use data analysis tools or spreadsheet software to analyze the collected data. Compare current performance against baselines and targets, identifying trends and patterns over time.
6. Identify Opportunities for Improvement
Based on the data analysis, identify areas where performance is below targets or where there are opportunities for improvement. Formulate action plans to address these areas and achieve your goals.
7. Continuous Monitoring and Adjustment
Regularly monitor KPI performance and adjust your strategies and targets as needed. The business environment is dynamic, so KPI tracking is an ongoing process.
8. Suggested Tools for KPI Tracking
- Ajelix AI Agent: Connect your data in one place and create nice-looking dashboards with ease.
- Google Analytics: Tracks website traffic, user behavior, and marketing campaign effectiveness.
- Power BI: Use advanced data analytics capabilities from various sources.
- HubSpot CRM: Tracks sales pipeline, lead generation, and customer interactions.
- Zoho Analytics: Write SQL’s, chat with AI, and create dashboards for KPI tracking.
- Zendesk: Tracks customer support interactions, satisfaction, and feedback.
- QuickBooks: Tracks financial performance, income, expenses, and profitability.
- Excel or Google Sheets: Use spreadsheets to manually track and analyze data.
Remember, KPI tracking is an ongoing process that requires consistent effort and adaptation. By carefully selecting, tracking, analyzing, and acting on KPI data, small businesses can make data-driven decisions to enhance their performance and achieve sustainable growth.
Conclusion
In summary, tracking these KPIs provides you with actionable insights for small business success. Regularly assess, adjust, and optimize your metrics, ensuring your business symphony is always playing in tune with your goals.
From data to report in one minute or less with Ajelix AI Agents


