10+ Best Online Reporting Tools 2026
One of the biggest challenges of living at 21. century is the ability to manage and understand data. This is where online reporting tools for analytics come in handy. Without a platform that transforms data into visualizations, it’s impossible to analyze and make data-driven successfully.
These tools offer extensive features from data visualization to live data sync and real-time reporting. Making it even easier for organizations to see patterns, identify trends, and make decisions.
In this article, we will explore the six best online reporting tools for data analytics in 2026. We’ll delve into features, pros, cons, and pricing, helping you to pick the right tool for your needs.
What are Reporting Tools?
Online reporting tools are software applications that help businesses collect, visualize, and analyze data to make decisions using an online interface. The online reporting tool is available on a browser and can’t work without an internet connection. However, the basic reporting tool will require an additional desktop application download.
Change the way you work with agentic AI
One-click dashboards,KPI tracking, and AI-powered insights—for work that actually gets done.

6 Best Online Reporting Tools
1. Ajelix BI
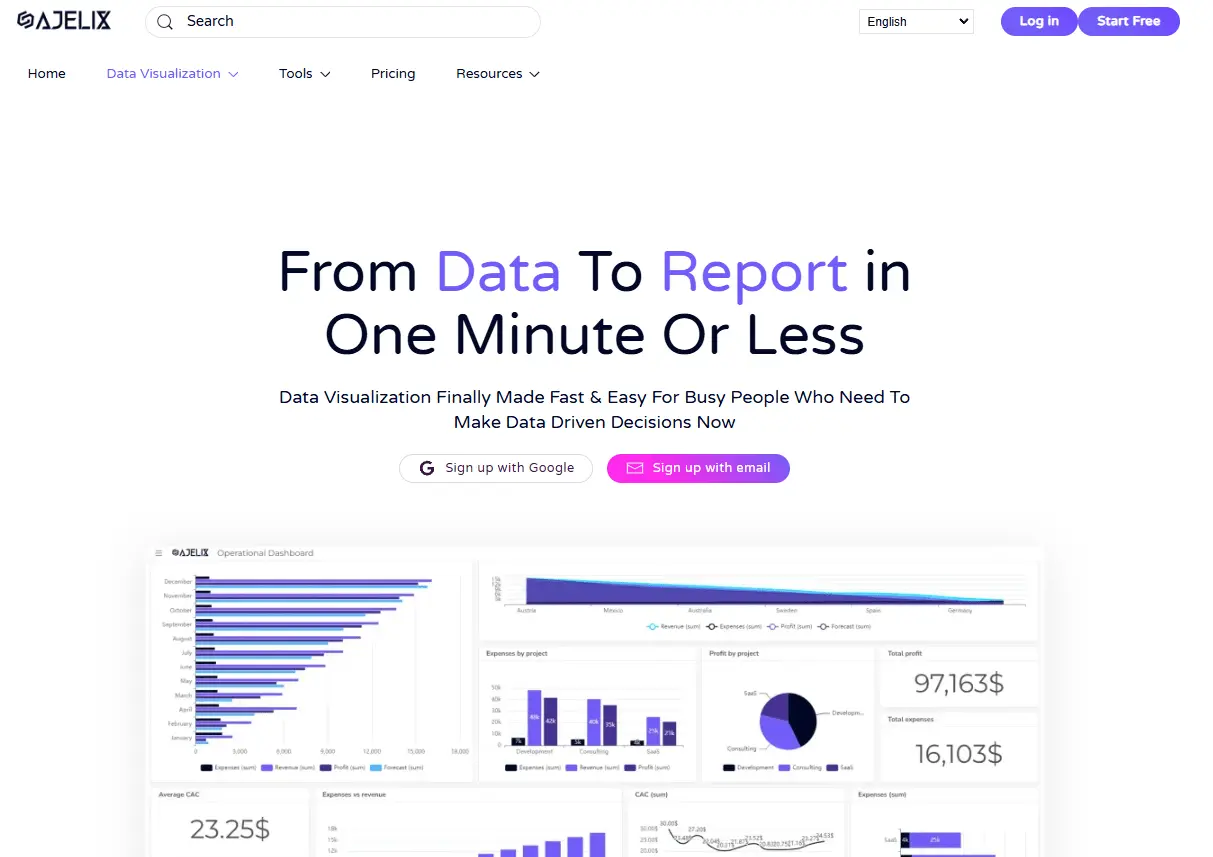
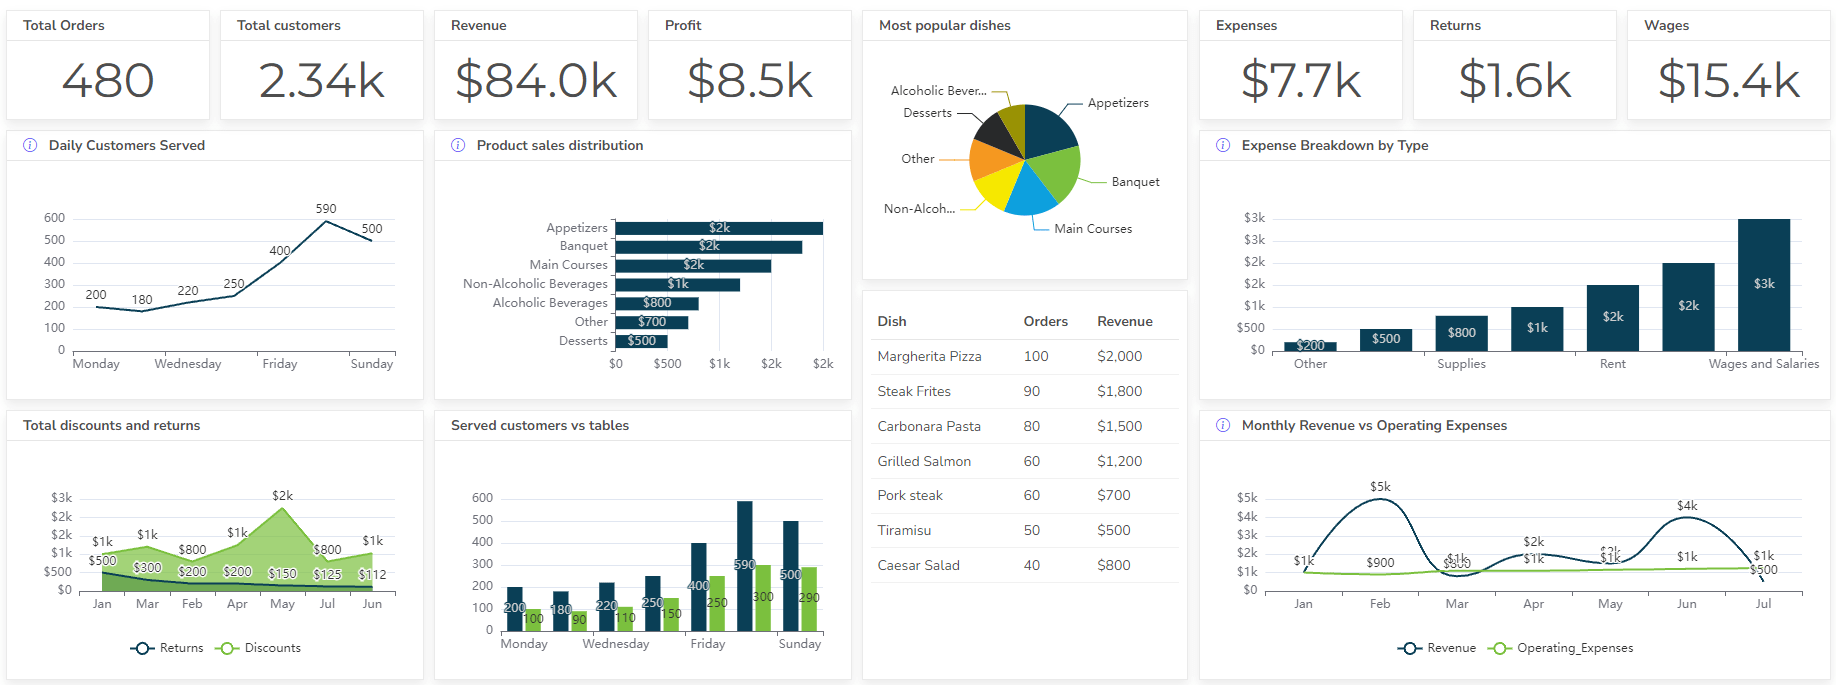
Ajelix BI offers only an online interface, so you don’t have to worry about application downloads and compatibility issues. Designed to meet Mac user needs. With Google Sheets integration, you can create live reports that automatically refresh the data every time you visit the report.
Reporting Features
- Online editor and report sharing
- Live data refreshing with Google Sheets integration
- No-code editor and easy-to-use platform
- No complex setups or training
- One-click reports and one-click charts
- AI chart builder and AI insights
- Fast performance
- Easy report-sharing settings
Pros
- The platform uses AI to help users quickly identify trends, patterns, and anomalies in their data, even without advanced analytical skills.
- It integrates directly with Excel, allowing users to perform complex analyses and generate reports within a familiar environment.
- The tool can automate the creation of reports and dashboards, saving users time and effort.
- It offers tools for creating interactive charts, graphs, and dashboards to visualize data effectively.
- Users can use natural language to ask questions about their data and receive AI-generated answers and visualizations.
- Compared to some full-fledged BI platforms, the tool is relatively affordable, making it accessible to smaller businesses and individuals.
Cons
- While the basic interface is user-friendly, mastering some of the more advanced KPI creation and data relationships may require a learning curve.
- Excel integration is a strength, it also means that users are limited by Excel’s capabilities. For very large datasets or complex data modeling, Excel might not be the ideal platform.
- Compared to some other BI tools, the platform may have a more limited range of data connectors.
- While AI can be helpful, users should be careful not to rely on it blindly. It’s important to understand the underlying data and validate the AI-generated insights.
Reporting gives you a headache?
Upload your data and create professional reports with agentic AI

Start free
Try free and upgrade whenever
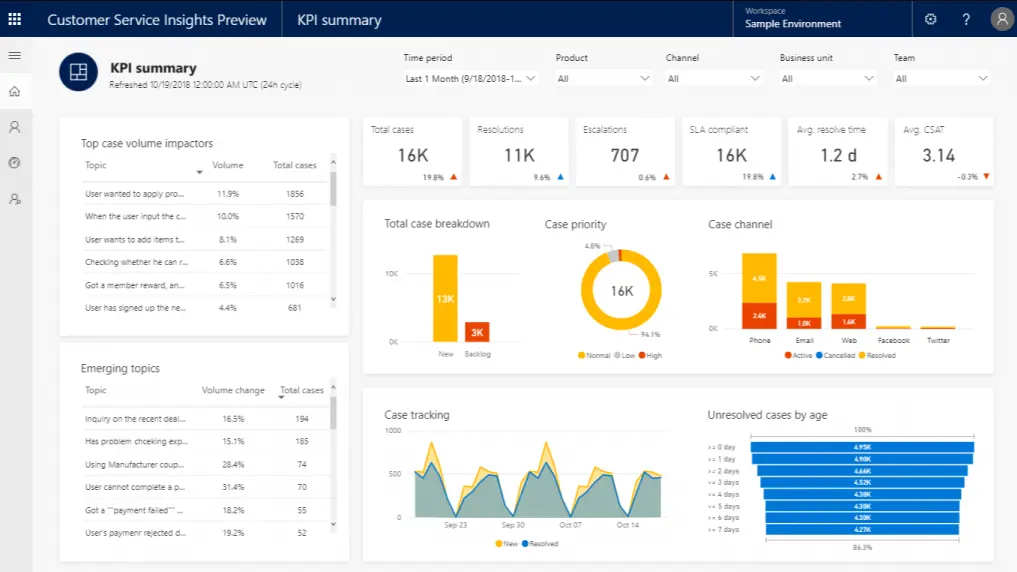
2. Power BI
Power BI is the most popular data analytics platform that provides real-time data refreshing and many other features. This platform has a desktop application and offers limited usability on the web interface.
Reporting Features
- Advanced DAX function library with extensive data analytics capabilities
- Many features that cater to the most specific business case studies
- Integration into the MS ecosystem
- Custom visualizations
- We’ve also gathered a detailed overview of Power BI cons and pros.
Pros
- The platform offers a wide array of visually appealing and highly interactive charts, graphs, maps, and other visualizations to help users understand data at a glance.
- It seamlessly connects to a vast number of data sources, including databases (SQL Server, Oracle, etc.), cloud services (Azure, AWS), Excel files, and many more, providing great flexibility in data integration.
- The tool provides DAX (Data Analysis Expressions), a powerful formula language that allows users to perform complex calculations, create custom measures, and derive deeper insights from their data.
- It seamlessly integrates with other Microsoft products like Excel, Azure, and SharePoint, making it a natural choice for organizations already using these tools.
- Power BI has a large and active community, providing ample resources, forums, and support for users, along with extensive documentation and support from Microsoft.
- Microsoft continuously updates the platform with new features and improvements, ensuring it stays at the forefront of BI technology.
- While there are paid versions, Power BI Desktop is free, and the Pro version is relatively affordable, especially for organizations already using Microsoft products.
Cons
- While basic report creation is relatively easy, mastering advanced features like DAX and complex data modeling can require a significant learning investment.
- While the platform offers a good selection of visuals, customization options for fine-tuning their appearance can be somewhat limited compared to some other tools.
- Like many BI tools, Power BI can experience performance issues when dealing with extremely large datasets or complex calculations.
- While there’s a web version and mobile apps, Power BI Desktop is primarily a Windows application, which can be a limitation for Mac or Linux users.
- Sharing and collaboration features are limited in the free version (Power BI Desktop), requiring a paid license (Power BI Pro or Premium) for full collaboration capabilities.
- While the base price is reasonable, costs can add up for larger organizations needing many licenses or premium features.
Related Article: 7 Best Self-Service Business Intelligence (BI) Tools
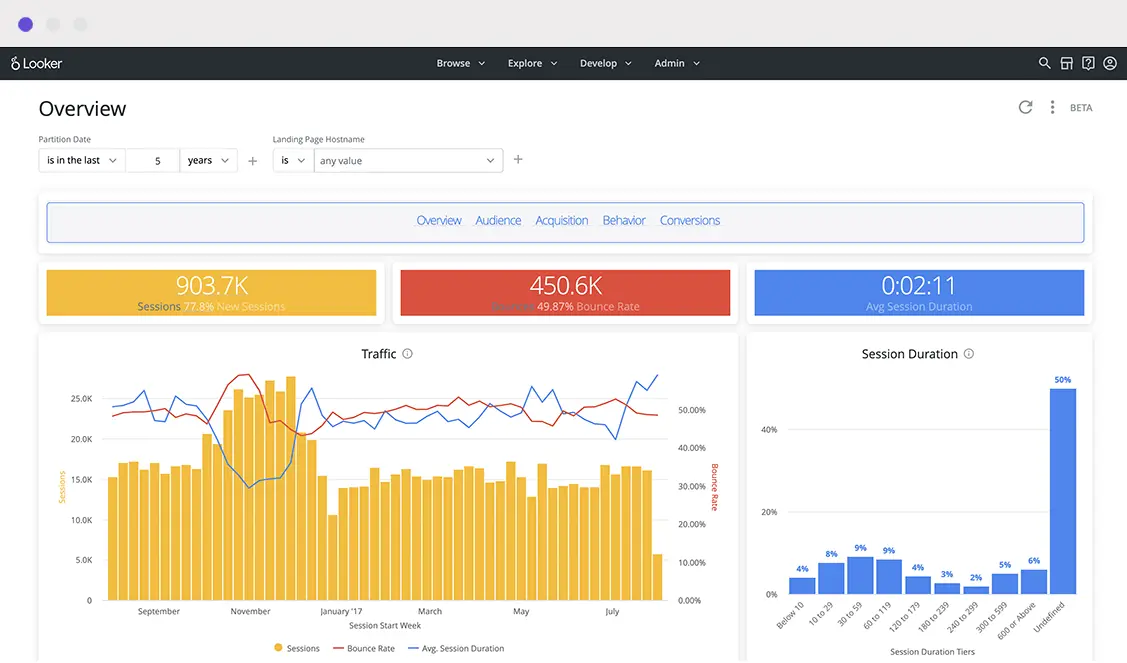
3. Looker Studio
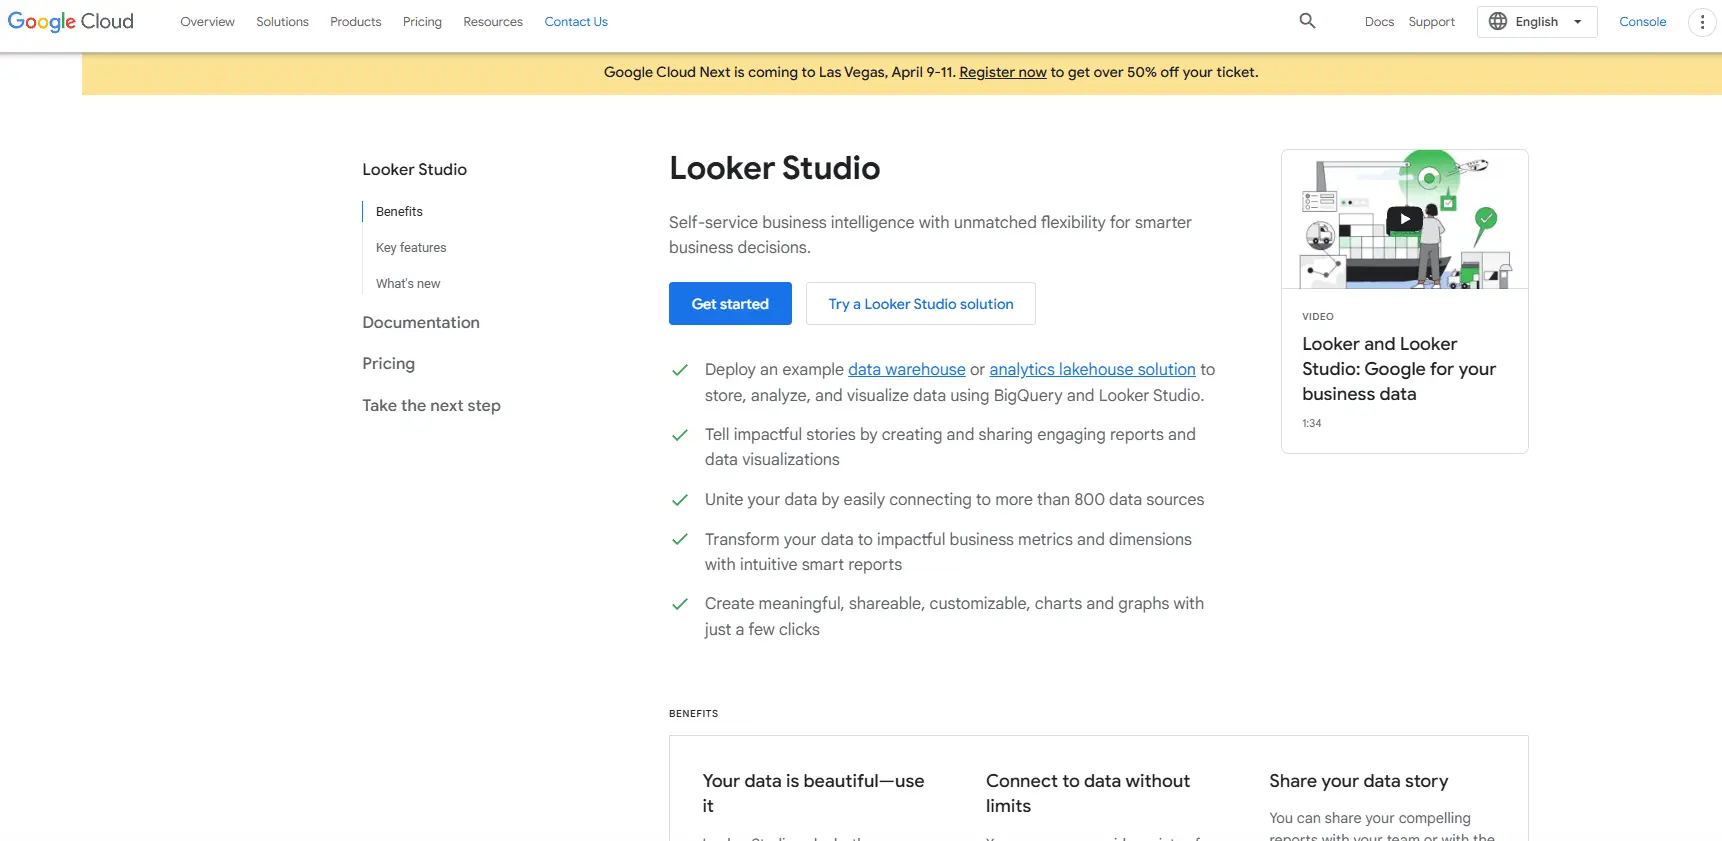
Looker Studio previously known as Google Data Studio offers live data refreshing and connections with different Google products. They have only a web interface and don’t offer desktop applications.
Reporting Features
- Many templates available for your data visualization needs
- Offers an extensive freemium version
- Option to connect with other BI platforms
- Real-time insights
- Connection from your choice of cloud
Pros
- The platform is completely free to use, making it accessible to individuals and businesses of all sizes.
- It features a drag-and-drop interface that makes it relatively easy to create reports and dashboards, even for users with limited technical skills.
- The tool seamlessly connects with various Google products like Google Analytics, Google Sheets, BigQuery, and also offers connectors to many other data sources, including databases and social media platforms.
- It offers a good variety of charts, graphs, and tables that are interactive, allowing users to explore data and gain deeper insights.
- The platform enables easy sharing and collaboration with others, allowing multiple users to work on the same report simultaneously.
- It provides a library of pre-built templates that can be customized to fit specific needs, saving time and effort.
- Reports can be easily embedded into websites or other platforms, making it easy to share insights with a wider audience.
Cons
- It has basic calculations and data manipulation, but it lacks the advanced analytics capabilities of more sophisticated BI tools like Looker or Power BI.
- While it allows blending data from multiple sources, there are limitations on the number of data sources and the complexity of joins.
- The platform can experience performance issues when dealing with very large datasets or complex reports.
- It relies on pre-built connectors for data sources, and if a specific connector isn’t available, it can be challenging to integrate that data.
- As a web-based tool, it requires an internet connection to access and work on reports.
- While it offers customization options, they are not as extensive as some other BI tools.
Related Article: 5 Free And Budget-Friendly Data Visualization Tools
4. Datapine
Datapine platform also offers live data refreshing and integrations with many business applications. This platform doesn’t offer desktop applications so all the features are available online.
Reporting Features
- Live data refreshing
- Self-service platform
- AI functionality
- Collaborative settings – easily share your dashboards
- Drag and drop interface
- Mobile BI
Pros
- The platform is intuitive and simple to use for creating dashboards and reports, thanks to its drag-and-drop interface.
- It offers a good selection of interactive charts, graphs, and dashboards that help users visualize data in a clear and engaging way.
- The tool seamlessly integrates with various data sources, including databases, cloud services, spreadsheets, and APIs, providing flexibility in data integration.
- Beyond basic reporting, it offers features like predictive analytics, data mining, and statistical functions for deeper analysis.
- Users can automate report generation and distribution, saving time and effort. For agencies and resellers, the platform offers white-labeling options to brand it as their own.
Cons
- The mobile app is often criticized for having fewer features and being less robust than the desktop version, which can be a drawback for users who need full mobile access.
- While the basic interface is user-friendly, some of the more advanced analytics features require SQL knowledge, which can be a barrier for some users.
- The free trial period is relatively short, which might not be enough for some users to fully evaluate the platform.
- Depending on the plan and number of users, the platform can be a significant investment, especially for smaller businesses.
- Some users have reported issues with the cancellation policy, which may require a long notice period.
- Compared to some competitors, the platform may have fewer readily available training resources and tutorials, which could make the initial learning process slightly more challenging.
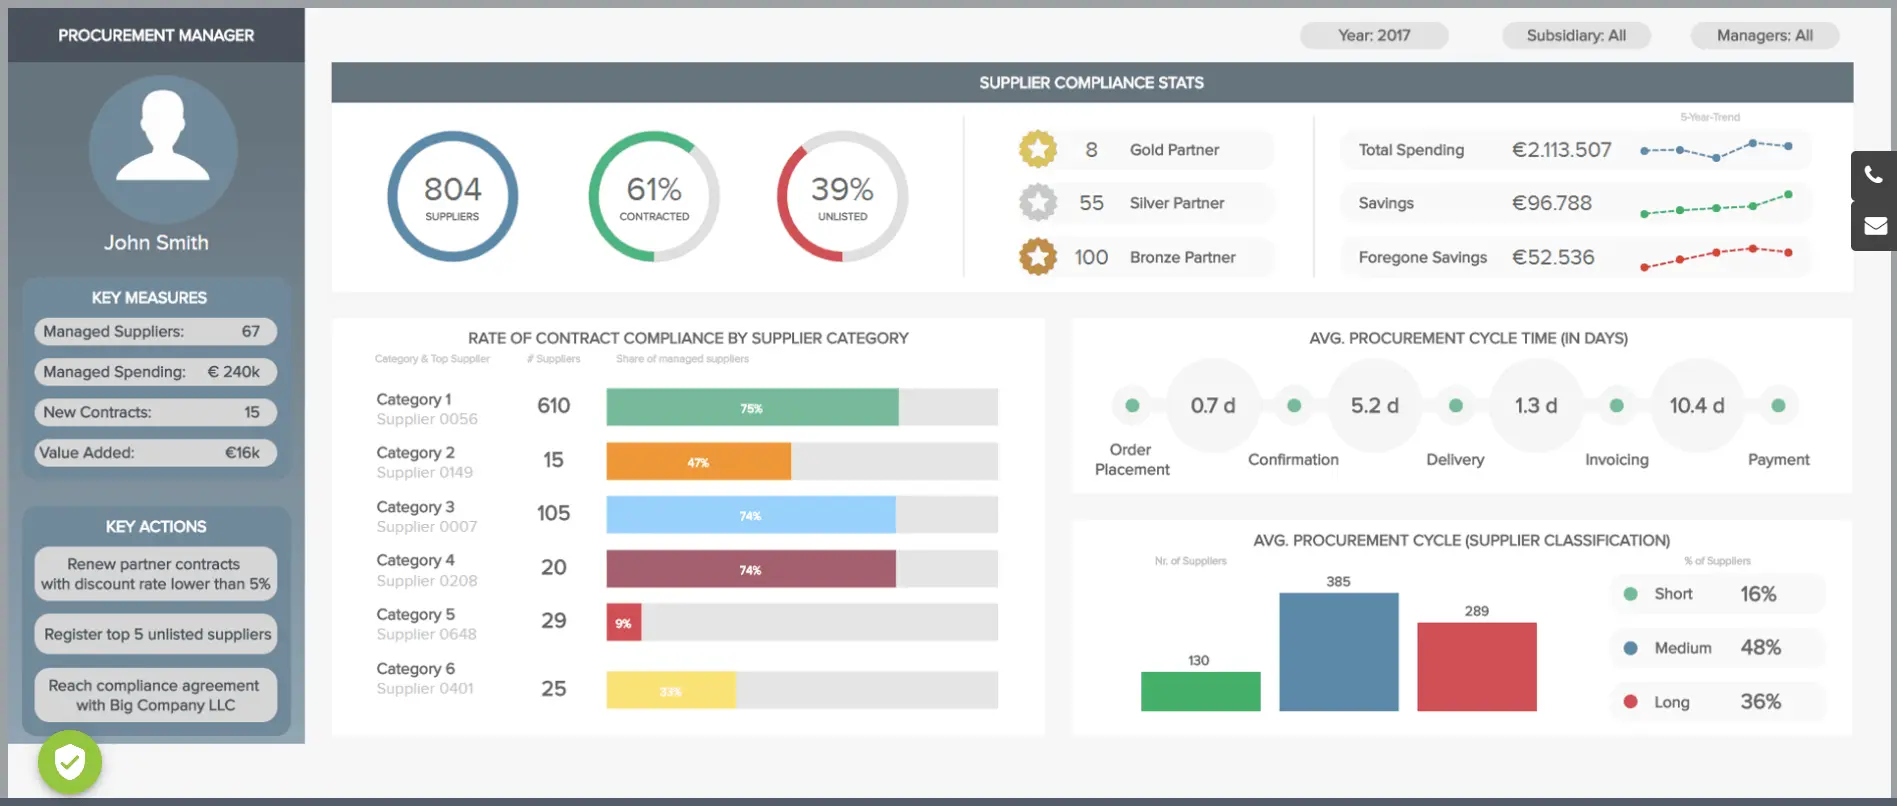
5. Qlik Sense
Qlik Sense provides live data refreshing and an online interface. They also have a desktop application so functionalities can differ from one another. Note that the desktop app doesn’t support Mac learn more about BI software compatibility.
Reporting Features
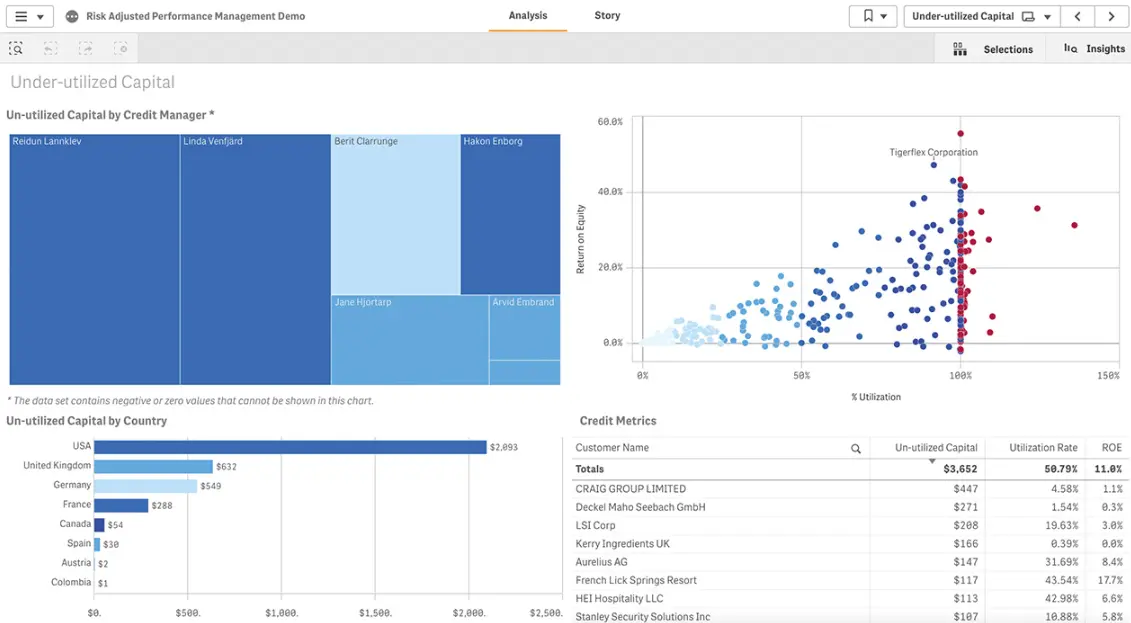
- AI-powered analysis
- Advanced data analytics capabilities
- Fast-performance cloud software
- Embed Functionality
Pros
- The platform excels at powerful data integration, seamlessly ingesting data from various sources, including cloud platforms, databases, and big data.
- It offers a unique associative engine that allows users to explore data intuitively, dynamically revealing insights as they interact with visualizations.
- The self-service analytics feature provides a user-friendly interface with drag-and-drop functionality, empowering business users to create their own reports and dashboards.
- It offers a wide range of visually appealing and interactive charts, graphs, and dashboards for data visualization.
- The platform is mobile-friendly, allowing users to access and analyze data on the go with mobile app compatibility.
- Developers can leverage extensive APIs and scripting capabilities for tailoring the platform to specific needs through robust customization options.
- Qlik Sense can efficiently handle and analyze vast datasets, providing powerful large data handling capabilities.
Cons
- Pricing can be higher compared to some competitors, particularly for larger teams, making it a potentially costly solution.
- While user-friendly, mastering advanced features requires some training or technical expertise, leading to a learning curve for some users.
- Users may find customization options for visualizations and text formatting to be somewhat restrictive, limiting available formatting options.
- Some reviews report challenges in reaching or receiving timely support from Qlik, impacting customer support experiences.
- Complex dashboards with massive datasets can experience performance issues, potentially affecting overall performance.
- Additional features may require purchasing separate plugins, increasing overall costs through add-on costs.
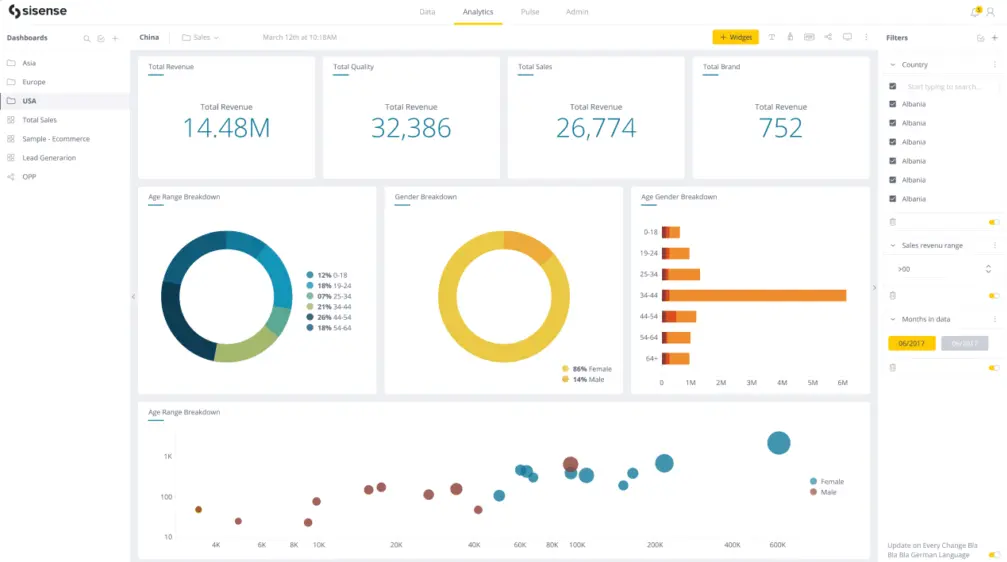
6. Sisense
Sisense platform provides live data reporting and have desktop application that supports all operation systems. They also have an online editor that can differ from desktop software.
Reporting Features
- Dashboard embedding
- Conversational analytics with AI
- Self-service platform
- Real-time data streaming
- Mobile BI
- Drag and drop interface
Pros
- The platform uses its proprietary in-memory database technology called “Elasticube” which allows it to efficiently handle and analyze large and complex datasets from various sources.
- It offers a drag-and-drop interface that makes it relatively easy for users to create dashboards and reports, even without extensive technical skills.
- The tool provides a variety of interactive charts, graphs, and dashboards to help users visualize data effectively.
- It allows users to embed analytics directly into their own applications or websites, providing a seamless experience for their customers.
- The platform offers white-labeling options for partners and resellers to brand it as their own. Sisense is generally known for providing good customer support and resources to its users.
Cons
- Basic report creation is relatively easy, however mastering advanced features like complex data modeling and scripting can require a significant learning investment.
- The platform is generally considered to be on the higher end in terms of pricing compared to some other BI tools, especially for larger deployments.
- While it offers a good selection of visuals, customization options for fine-tuning their appearance can be somewhat limited compared to some other tools.
- Some users have reported occasional performance issues, especially when dealing with extremely large datasets or complex queries.
- While Sisense has a community, it’s not as large or active as the communities of some other major BI platforms like Power BI or Tableau.
Online Reporting Tool Comparison
| Feature | Ajelix BI | Power BI | Looker Studio | Datapine | Qlik Sense | Sisense |
|---|---|---|---|---|---|---|
| Ease of use | Highly intuitive and user-friendly interface | Advanced data analytics capabilities | Straight-forward interface | Intuitive drag-and-drop interface | Steep learning curve, with advanced capabilities | Steeper learning curve |
| Data Visualization | Wide range of data visualization options | Wide range of visualizations, requires advanced knowledge for customization | Many templates and wide range of charts | With over 100 charts and graphs | Data engine that uncovers hidden patterns | Variety of data visualization options |
| Data Source Integration | Offers Excel and Google Sheets integration | Connects to various data sources, including on-premises and cloud-based systems | Integrates with Google products, such as Google Sheets and Google Analytics | Connects to various data sources | Connects to a wide range of data sources | Can connect to the specific database or server |
| Reporting Capabilities | Creates interactive dashboards and reports, enabling users to explore data and uncover insights | Generates various reports, including dashboards, charts, and tables | Creates interactive dashboards and reports, with the ability to share and collaborate | Produces a variety of reports, including dashboards, charts, and tables | Offers a wide range of reporting capabilities, including real-time dashboards | Creates interactive dashboards and reports, with the ability to drill down into data |
| Scalability | Scales to meet the needs of small startups to medium companies | Scalable to handle large datasets and multiple users | Scales to accommodate growing data volumes and user needs | Scales to meet the needs of growing businesses | Can handle large volumes of data and can be deployed across multiple environments | Scales to handle large datasets and can be used by teams of analysts |
| Pricing | Freemium pricing model, with a paid option for advanced features | Paid subscription plans with varying levels of functionality | Freemium pricing model, with paid options for additional features | Freemium pricing model, with paid plans for advanced features | Paid subscription plans with different tiers based on data volume and user needs | Paid subscription plans with different tiers based on data volume and user needs |
| Strengths | Ease of use, AI features, frequent updates, live data reporting | Powerful data visualization capabilities, and integration with Microsoft ecosystem | Ease of use, freemium pricing, and integration with Google products | Intuitive interface, comprehensive data visualization library, and affordable pricing | Unique associative data engine, ability to uncover hidden insights, and scalability | Powerful data visualization capabilities, scalability, and ability to handle large volumes of data |
| Weaknesses | Limited customization options and potential lack of scalability for large businesses | Steep learning curve, desktop application, DAX function, complexity for non-power users | Limited customization options and potential lack of data source options for free users | Limited data source options compared to some competitors | Steeper learning curve and potential difficulty in data preparation | Steeper learning curve and potential lack of out-of-the-box features |
Other Reporting Tools
Summary
I hope you got the idea that any organization should follow and analyze the data they have to make data-driven decisions. These six online reporting tools – Ajelix BI, Power BI, Looker, Datapine, Qlik Sense, Looker, and Sisense – offer a wide range of features and data analytics capabilities.
Recommendations
- For businesses seeking a user-friendly and scalable reporting tool: Ajelix BI or Datapine
- For businesses looking for a powerful tool with extensive data visualization capabilities: Qlik Sense or Ajelix BI
- For businesses in the Microsoft or Google ecosystems: Power BI or Looker
- For businesses that prioritize self-service data preparation and data storytelling: Ajelix BI
- For businesses handling large volumes of data and real-time data: Power BI
The best way to find the right reporting tool for your business is to explore the free trials or demos offered by each provider. This will allow you to experience the tools firsthand and assess their suitability for your specific needs and preferences.
FAQs
Reporting tools are applications that help organizations connect, visualize, and analyze data in one place to make data-driven decisions.
The best online reporting tools are Ajelix BI, Power BI, Qlik Sense, Looker Studio, Datapine, and Sisense.
To choose the best tool, consider these factors: ease of use, data visualization capabilities, data source integration, reporting capabilities, scalability, and pricing.
Best free online reporting tools are Ajelix BI, Power BI, and Looker Studio.
Ready to test Ajelix BI reporting tool?
From data to report in one minute or less with Ajelix AI Agents


