One-click reports and customized dashboards
Generate a report from your data with one click automagically with AI Experience the ease of reporting with a no-code editor.

No credit card requiered
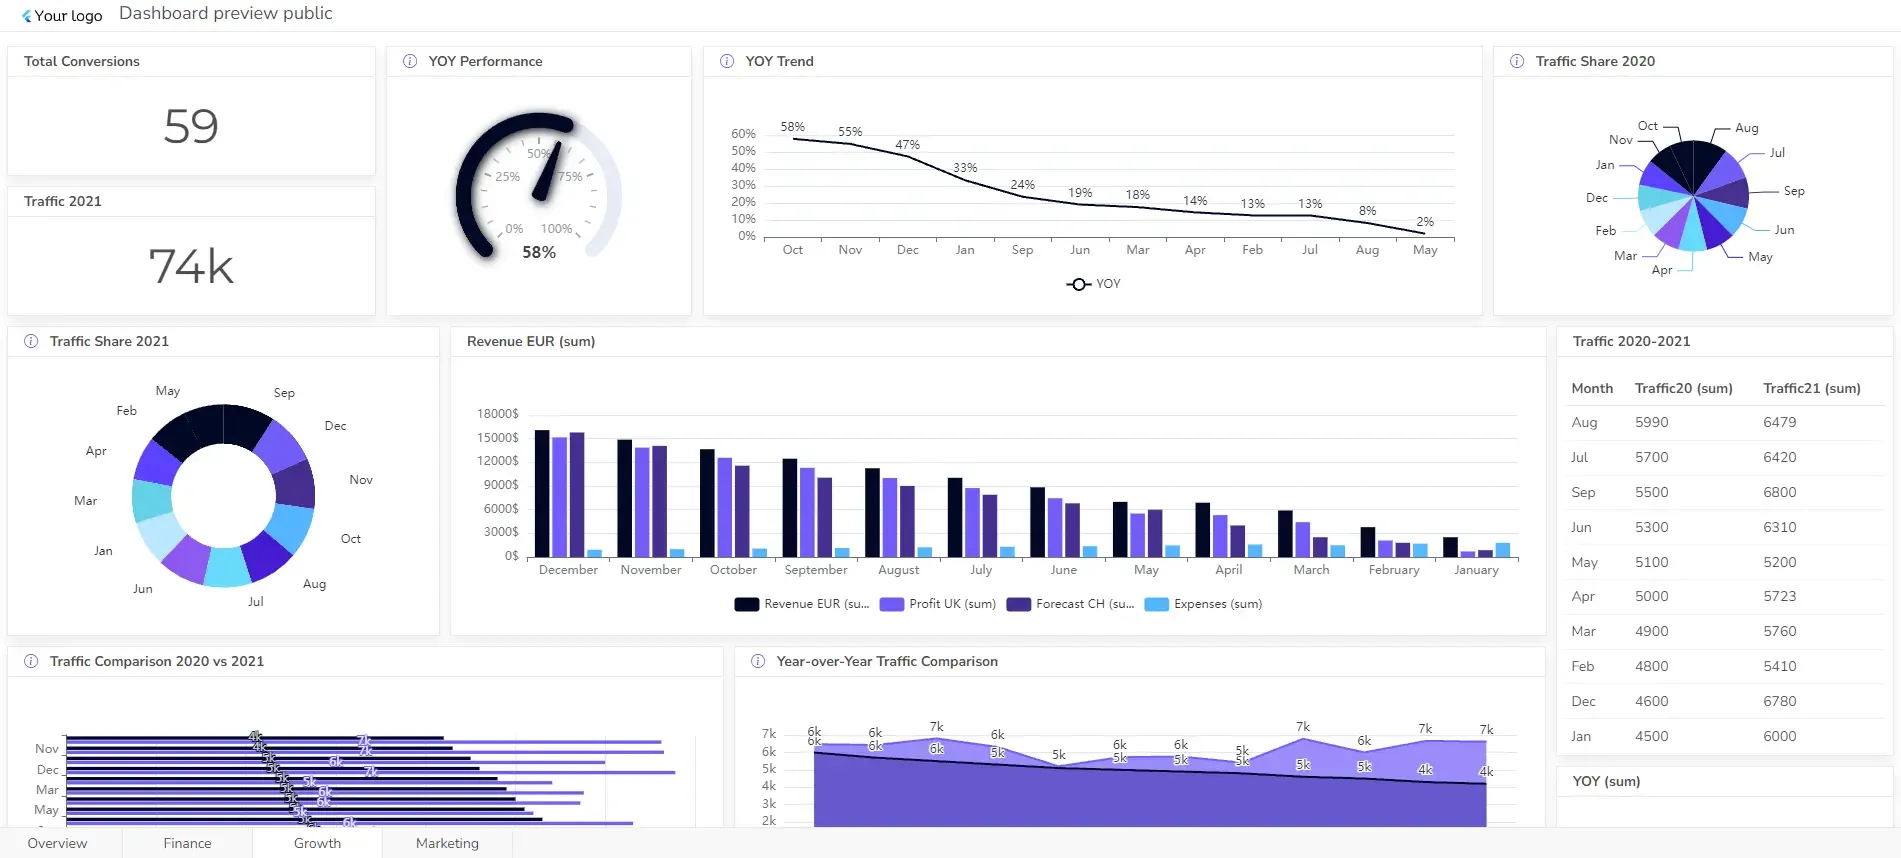
AI dashboard generator for easier report building
- Generate dashboards using one-click button
- Match your dashboard with brand colors
- Create several pages
- Get fully responsive chartsem—ready for sharing
- Build charts without any knowledge or training
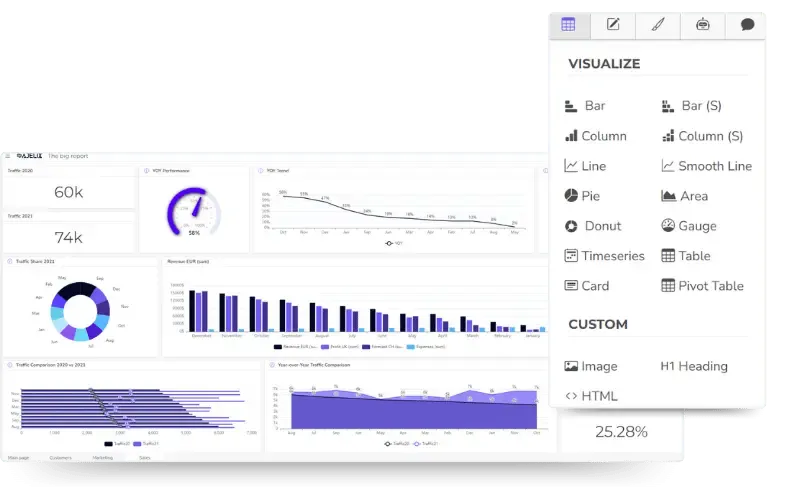

Charts & graphs for your data visualization needs
More than 24+ elements for efficient report building. But we’re not stopping there—with monthly updates our users can expect new elements any time soon.
- Choose from basic charts to more advanced visualizations
- Add elements, such as, tables, pictures and html to your reports
Customize dashboard to match it with your brand
- Upload your logo and make it shine on your data dashboard
- Set your brand colors and change background

Customize your reporting process with Ajelix BI and see how easy it’s