In the realm of data management, precision is paramount. It is not enough to merely possess data; one must master the art of data formatting. This article is your compass in the intricate world of preparing Excel data for Ajelix BI uploads. Before we delve into the nitty-gritty details, let’s grasp why data formatting is of such great consequence and gain an overview of what Ajelix BI expects from your data.
Why proper data formatting is important?
Proper data formatting is the secret sauce that unlocks the full potential of your data. It’s like giving your data a makeover – enhancing its appearance and functionality. Inaccurate or haphazard data formatting can lead to misinterpretations, errors, and missed opportunities.
What is Ajelix BI?
Ajelix BI is an easy-to-use data visualization tool in the business intelligence world. It’s extremely helpful for those who need to create reports quickly and efficiently. Ajelix BI is designed to ease reporting and help organizations create professional-looking reports quickly and easily.
Take a peek into our dashboard.
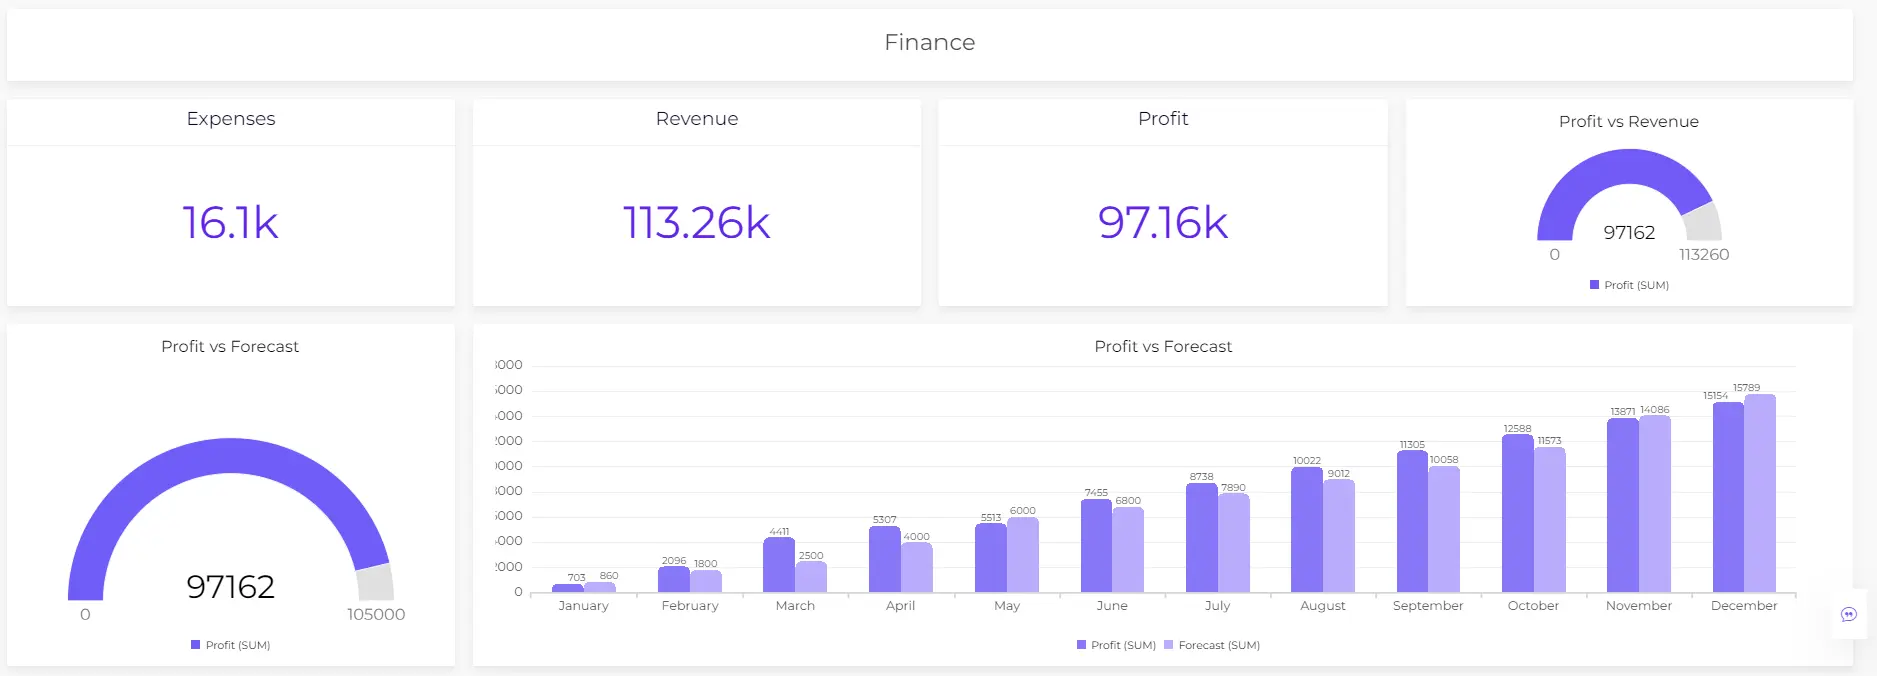
Enjoy the Ajelix BI freemium version here.
How to Prepare Data Files for Ajelix BI?
Here are the specifics on how to create a successful report with our BI platform. Reporting starts with the data so let’s dive into data formatting.
Acceptable File Formats for upload
The data visualization platform accepts specific file formats. Currently, it’s possible to upload Excel and CSV file formats into our system. In the future, we’re planning to expand the horizon with different file types – so stay tuned.
Preparing Your Excel Data
Before you venture into the world of Ajelix BI, your Excel data needs preparation. Here are a few things to keep in mind when using Excel as a data source.
1. The data visualization tool will take data only from the first sheet. Be aware that if you upload a file with several sheets system will process data from Sheet1 and the rest will be ignored. If you want to visualize all data from the workbook make sure to transfer data to one sheet.
2. All data should start from cell A1
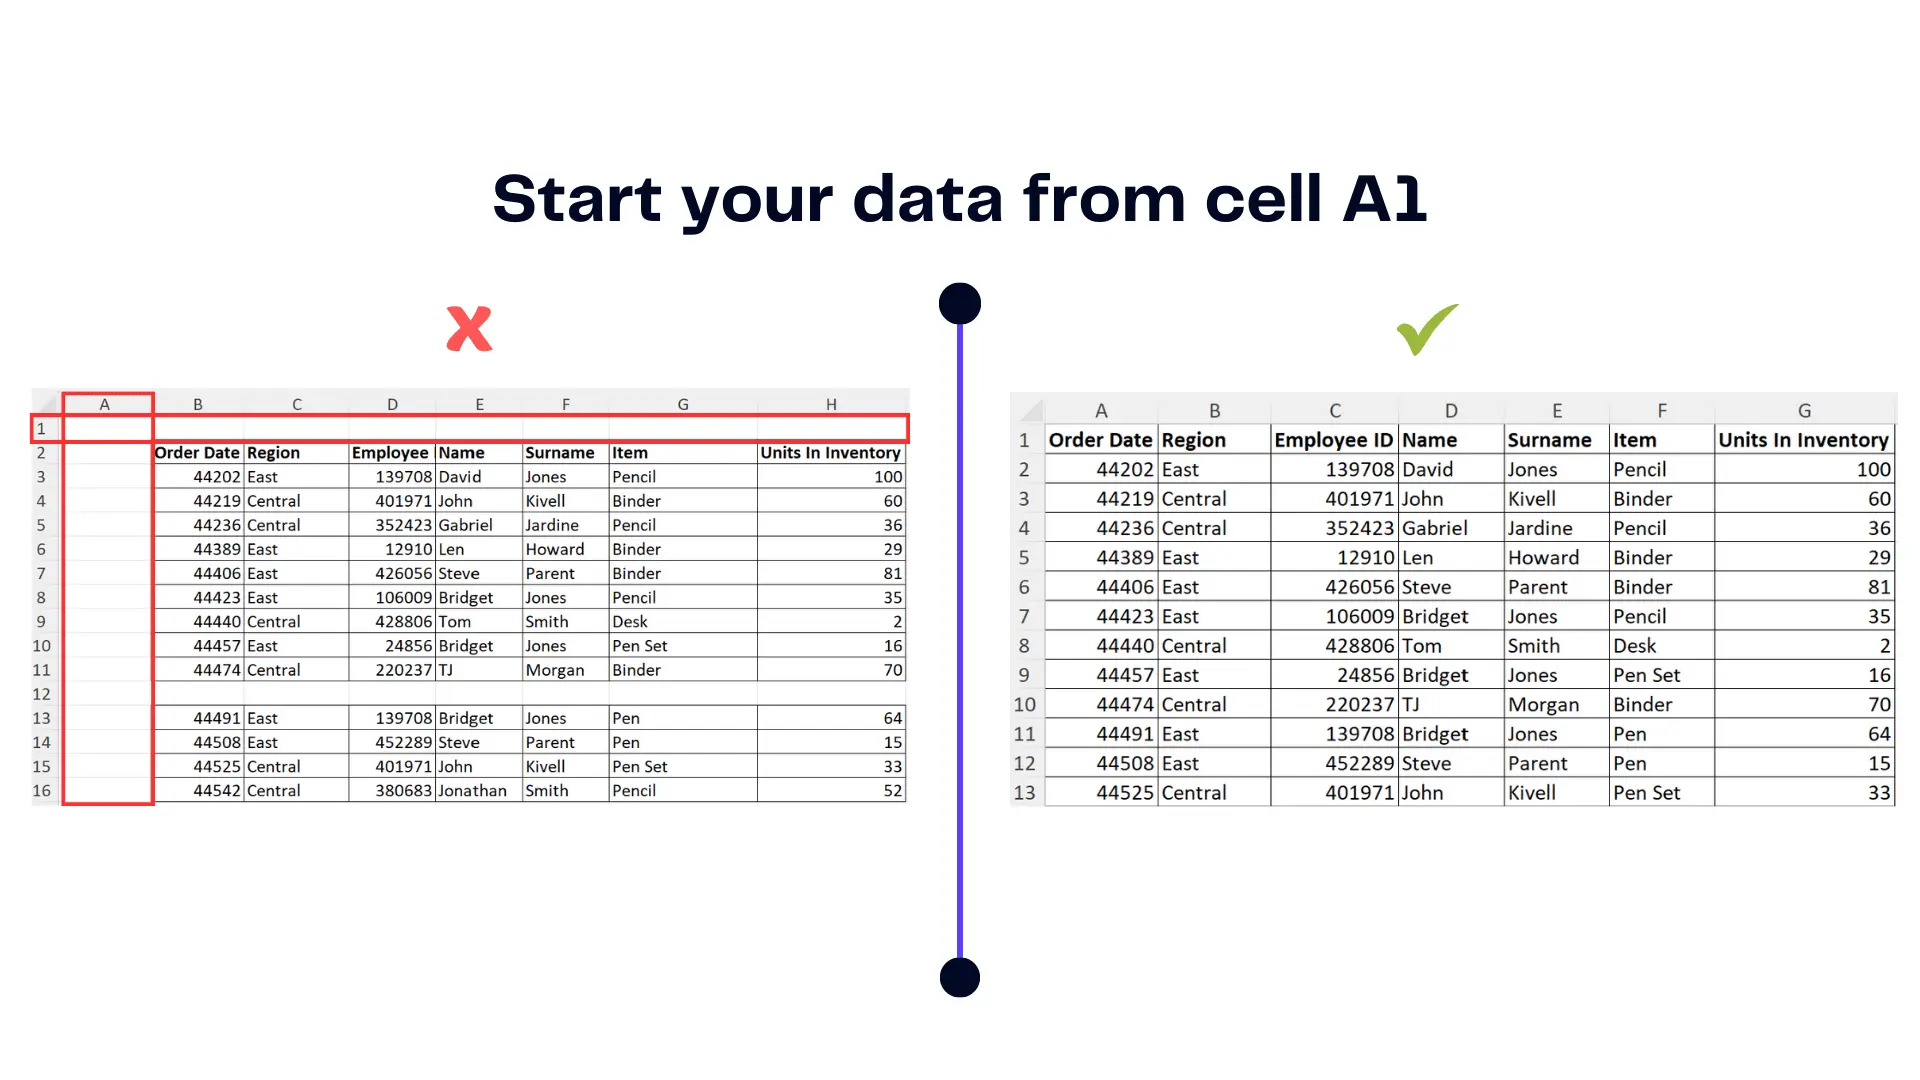
If your data table starts from cell C2 or other cells make sure to move it A1. Here’s a guide on how to do it.
3. Your Excel file can have an unlimited count of rows and columns.
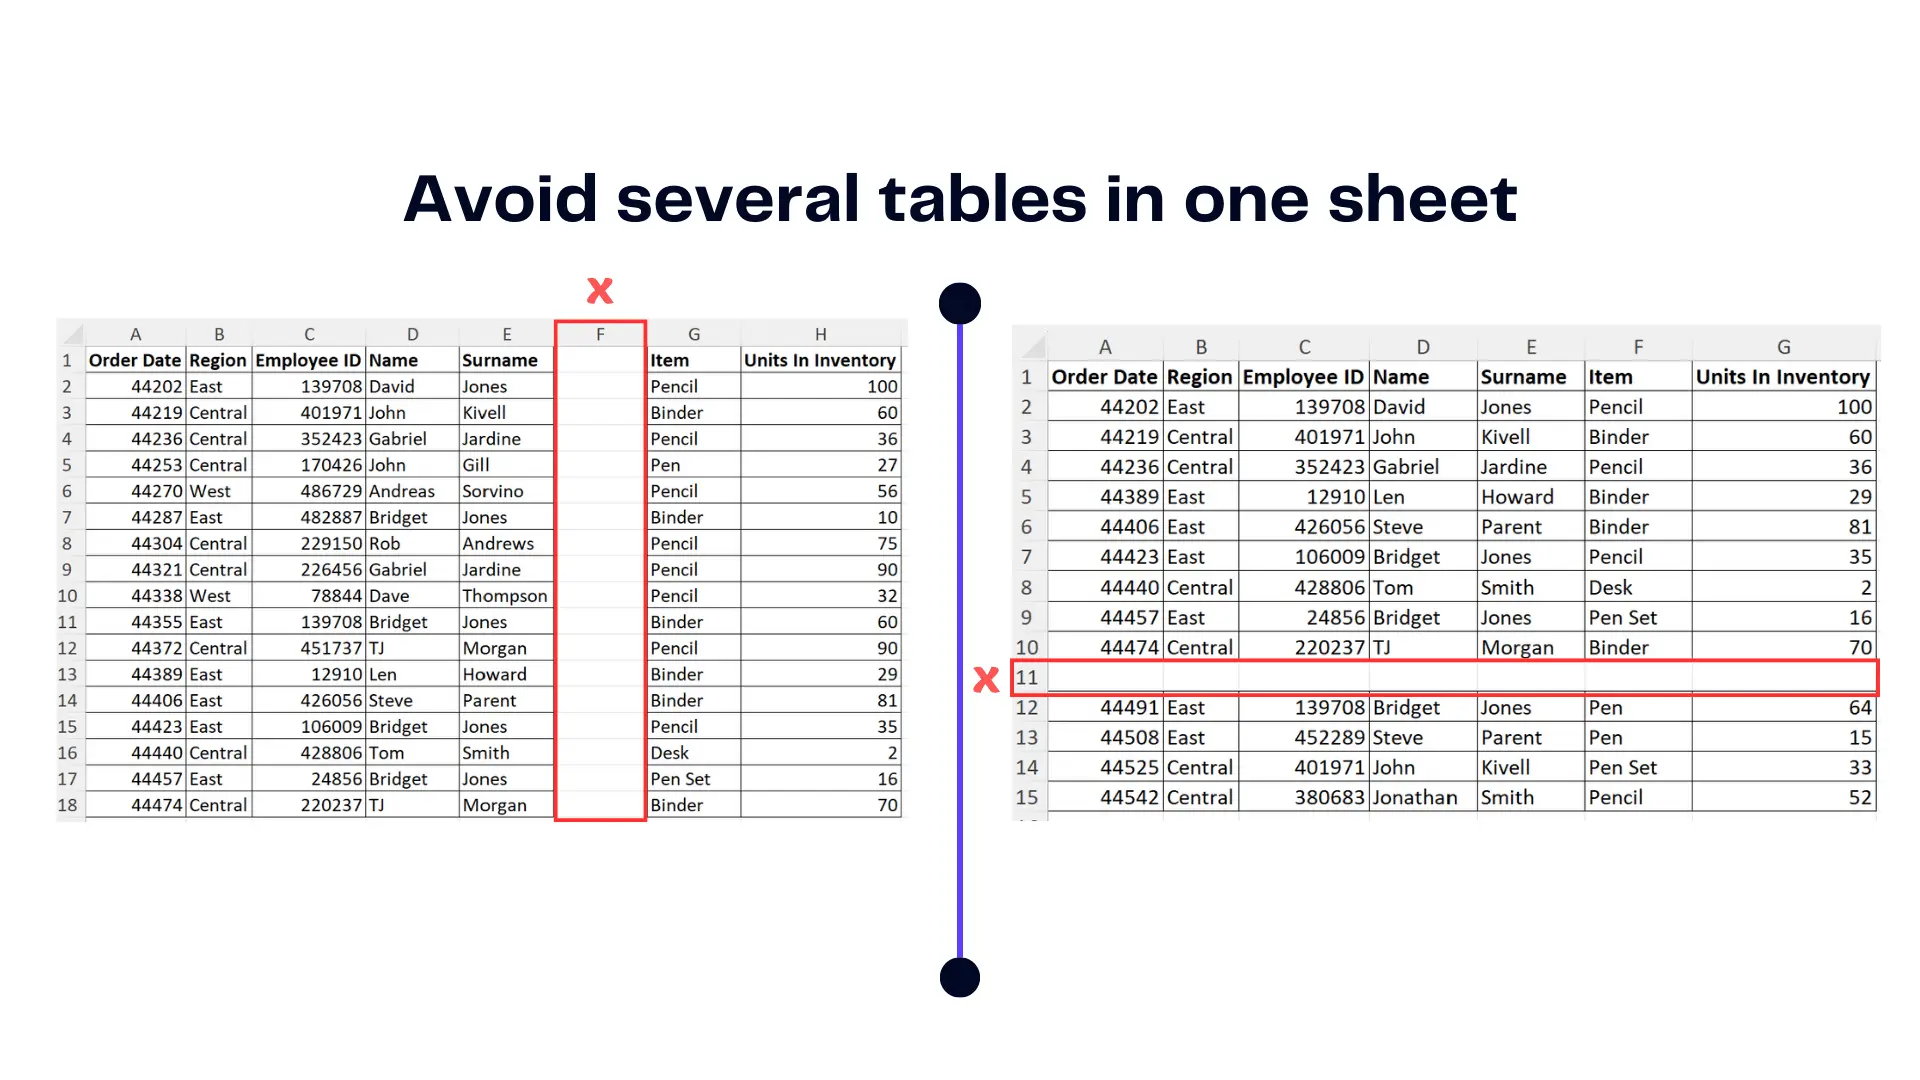
4. Make sure your file consists of only one data table in a sheet. Check the example below to avoid blanks in your charts 👇
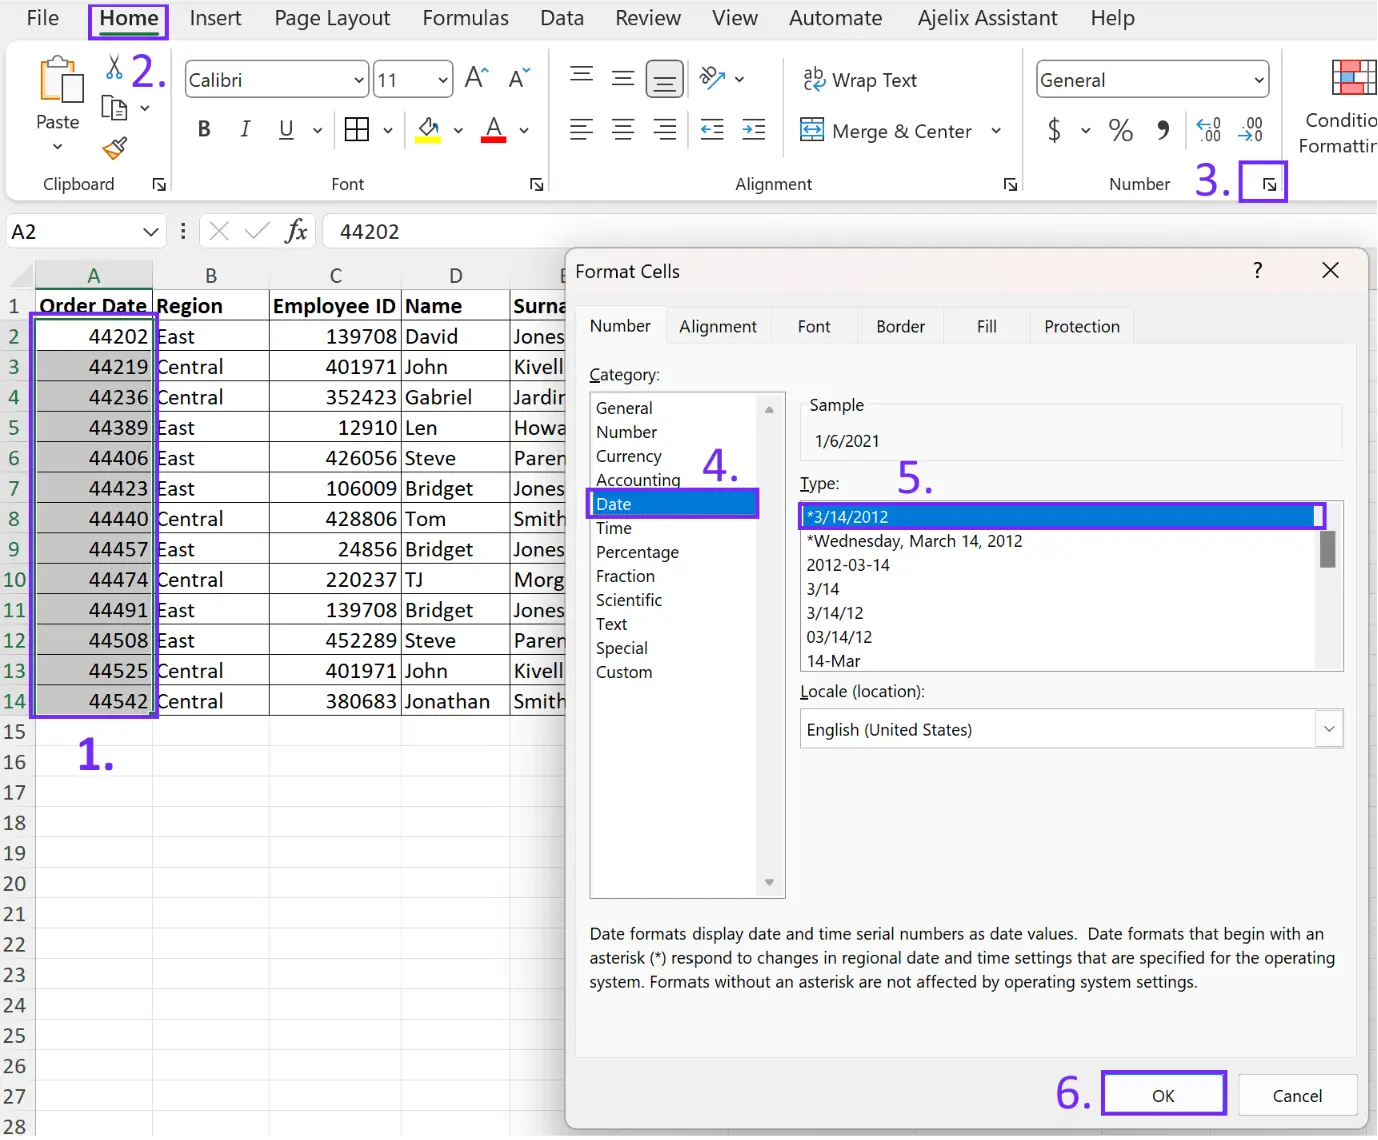
5. Format cells as “Date” to create a time series chart that summarizes big date data. Here’s how 👇
Related Article: Create Effective Data Dashboard That Tells a Story
Preparing Your CSV Data for Upload
CSV file import is pretty easy and it doesn’t have as many restrictions as Excel.
1. Similar to Excel your data should start at cell A1 and you should avoid adding blank columns or rows unless you want to see that in charts.
2. Format dates with “Date” formatting to do that follow the instructions above.
With your data organized and verified, it’s time to upload it on Ajelix BI.
Related Article: How AI and Data Analytics work?
Conclusion
In the world of Ajelix BI, data is king, but only if it’s properly formatted. This article has been your guide through the labyrinth of data formatting, empowering you to upload data to Ajelix BI with confidence. Recap the key points, and embark on your journey to harness the full potential of your data with Ajelix BI.
From data to report in one minute or less with Ajelix AI Agent