AI Data Visualization & Analytics
AI data visualization and analytics are transforming our understanding and insights from large datasets in our data-focused world. As technology advances, understanding how AI influences data analysis becomes paramount for anyone navigating this landscape.
This article explores AI-powered data visualization and analytics, explaining the key ideas and practical uses that drive this transformative combination.
Change the way you work with agentic AI
One-click dashboards,KPI tracking, and AI-powered insights—for work that actually gets done.

Importance of Data Visualization
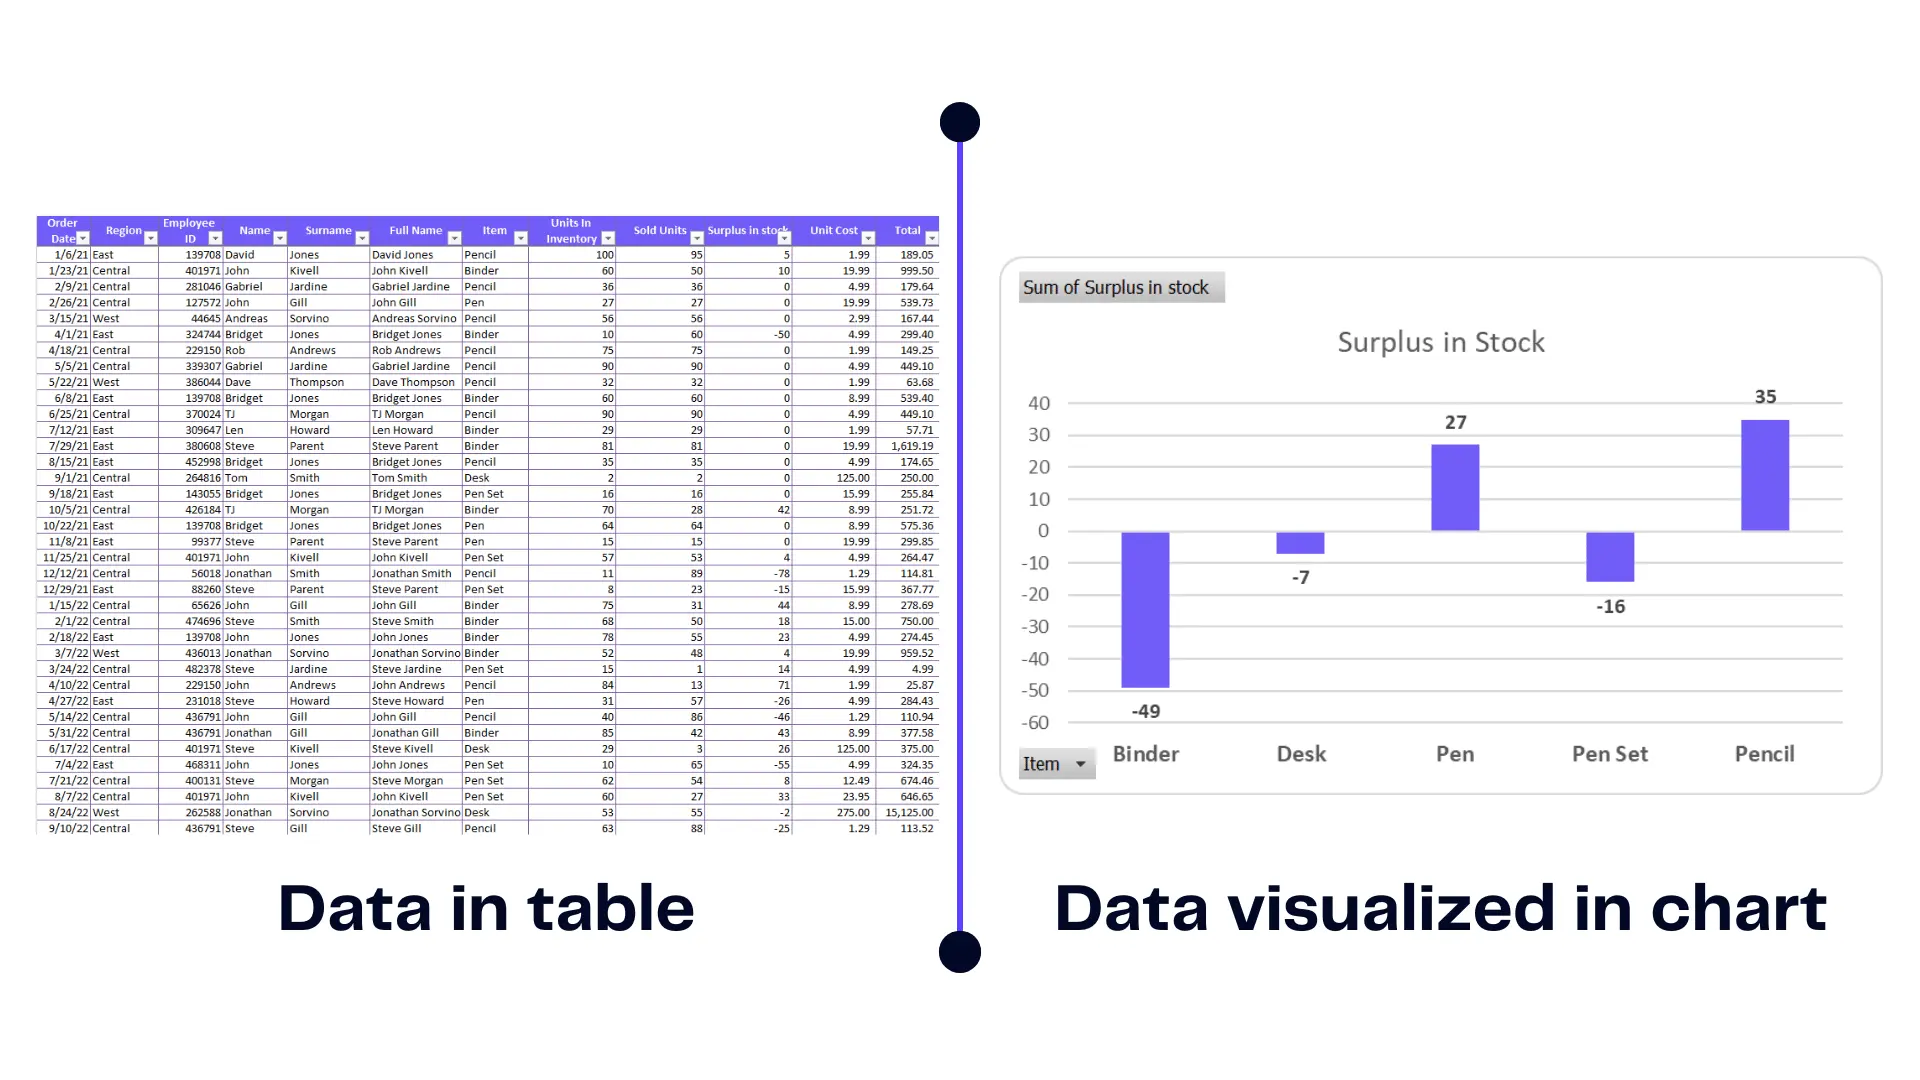
Data visualization is the art of representing information graphically, allowing for a deeper understanding of complex datasets. Visualizations provide a means to identify patterns, correlations, and outliers that might not be apparent through raw data alone.
Take a look at this picture for a second which side makes more sense and provides actionable insight into data? I think that the answer is pretty clear visualized chart says it all.
You can read about data visualization principles where we outline the importance of visualization.
How Does AI Data Visualization Work?
AI visualization can work by analyzing data, identifying patterns, and generating visualizations that are more intuitive and engaging. Leading AI development companies offer several examples on how this visualization can work.
One of the AI data visualization examples is Ajelix BI functionality, where you can upload your dataset and generate a chart with your prompt.
See how it works in the video:
How To Use AI Data Visualization?
Time needed: 3 minutes
Create your report with AI visualization seamlessly:
- Register free account on Ajelix BI
You can create a free account and test the freemium features that this platform offers. Simply go to the Registration page and create a free account.

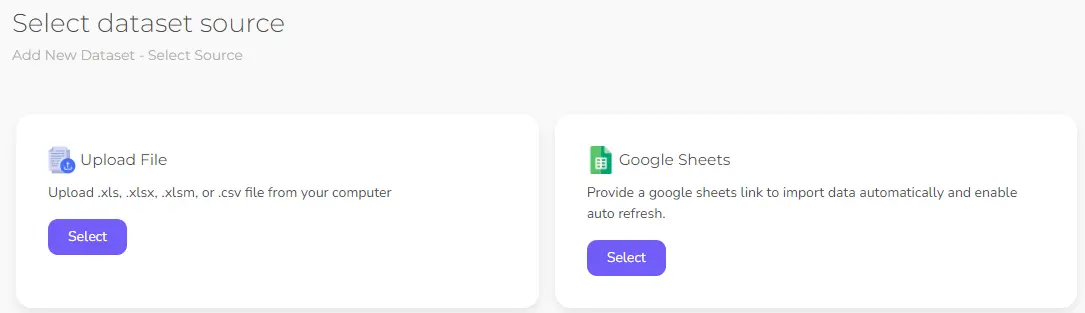
- Upload your data file
Add your file to the platform, it can be either a CSV, Excel, Google Sheets file, or SQL server.
- Create a report
Once you have the dataset you can create a report and access editing settings. Here you can use the AI chart generator.
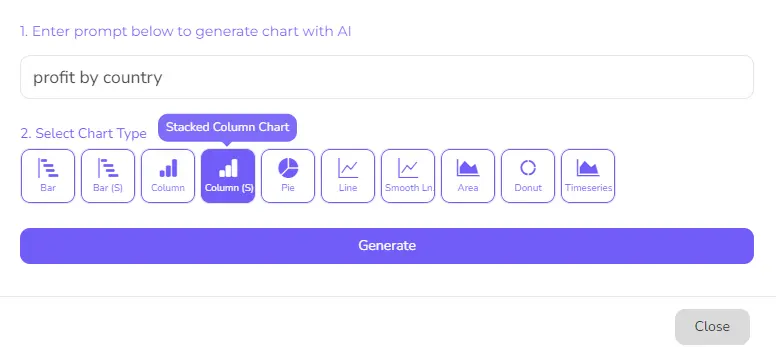
- Write a prompt and generate a chart with AI
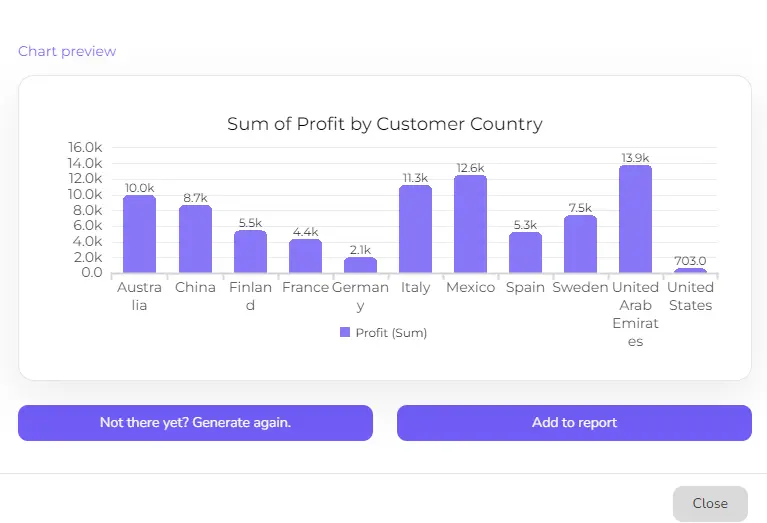
To generate a chart with AI write a prompt, for example, profit by country, pick the chart type, and click generate.
- Preview chart and add to the report
Once you have the result, you can add it to the report or generate other chart until it meets your needs.
Reporting gives you a headache?
Upload your data and create professional reports with agentic AI

Start free
Try free and upgrade whenever
AI in Data Collection
Automated Data Gathering
AI-driven data collection involves automating processes that gather information from various sources. AI can quickly gather different types of data from the web, sensors, and social media. This helps with analyzing information and making informed decisions. However, most of the time, it is possible to accomplish data collection with programming.
Data Cleaning and Preprocessing
Raw data is often noisy, incomplete, or inconsistent. AI assists in cleaning and preprocessing this data by identifying and rectifying errors, filling in missing values, and standardizing formats. This meticulous preparation ensures that subsequent analysis is accurate and reliable.
Ensuring Data Quality with AI
Maintaining data quality is paramount for accurate analysis. AI algorithms monitor data streams all the time, detecting anomalies that could compromise the integrity of the analysis. By flagging unusual patterns, AI contributes to data quality assurance.
Data Visualization Techniques Powered by AI
Interactive Dashboards and BI Tools
AI enhances types of data visualization by creating dynamic, interactive dashboards that allow users to explore data from various angles. Business intelligence (BI) tools leverage AI to generate insights and answer questions in real time.
Natural Language Processing for Textual Data
NLP helps AI understand and interpret text, find emotions, summarize, and spot important patterns in big amounts of text. This capability has far-reaching applications in social media monitoring, customer feedback analysis, and content generation. One of the most important applications of NLP is in checking the originality of text. An AI detector uses NLP to analyze a text and determine if it was written by a human or generated by an AI. This is especially useful in academic and professional environments where authenticity is critical.
Image and Video Analysis
AI-driven image and video analysis changing industries like healthcare (medical image interpretation), e-commerce (visual search), and security (facial recognition). These applications turn visual data into actionable insights enhancing decision-making processes. Additionally, techniques like image to video conversion further expand the capabilities of AI in processing and understanding multimedia content.
Furthermore, modern AI tools can offer a plethora of advanced capabilities in handling multimedia content. Features include video to text which transcribes spoken content in videos making the information more accessible and searchable; AI voice cloning to create natural-sounding synthetic voices, useful in enhancing user interface experiences; and adding subtitles to videos for increased comprehensibility and aiding those with hearing impairments. These tools not only enhance multimedia content but also ensure its reach and comprehension to a wider, diverse audience spectrum.
Time-Series Data Visualization
Time-series data, which evolves over time, benefits from AI’s ability to identify patterns and trends. Industries like finance (stock market analysis), energy (predictive maintenance), and healthcare (patient monitoring) rely on AI-enhanced time-series visualization.
AI-Powered Data Interpretation
Sentiment Analysis for Customer Feedback
Sentiment analysis gauges public opinion by assessing the emotional tone of text data. Businesses employ it to understand customer sentiment, track brand perception, and fine-tune marketing strategies.
Anomaly Detection for Fraud Prevention
AI excels at detecting anomalies within data, making it a crucial tool for fraud prevention in finance, cybersecurity, and healthcare. It identifies unusual patterns or behaviors that deviate from the norm.
Predictive Analytics for Business Forecasting
Predictive analytics, powered by AI, uses historical data to predict future trends and outcomes. Businesses leverage these insights for demand forecasting, inventory management, and resource allocation.
Automating Insights with AI
Smart Insights from Data
AI automates the process of generating insights from data. It identifies key takeaways, summarizes findings, and presents actionable recommendations, freeing up analysts to focus on strategic decision-making.
One of the examples is Ajelix BI which allows you to create explanations for each chart about your data. See how business analytics can benefit from AI data analytics insights works in the picture below!
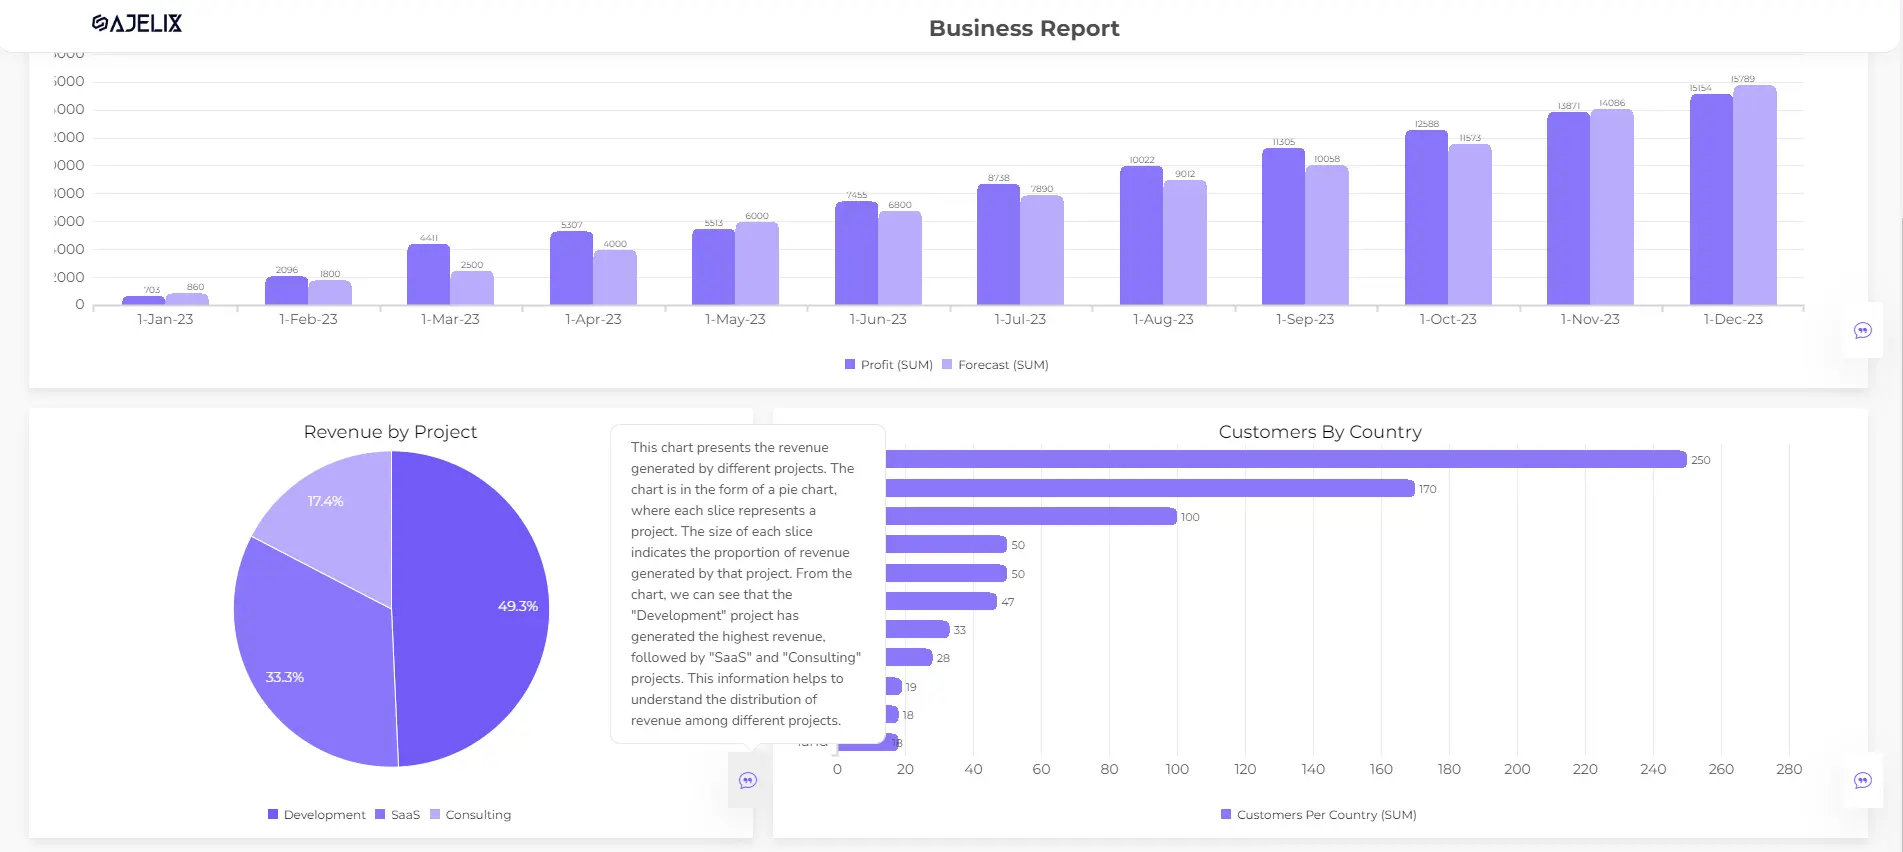
This chart consists real data for business analysis created for business users. Once AI analytics software has visualized you can ask AI to give insights. Here’s what AI gave back:
“The size of each slice indicates the proportion of revenue generated by the project. From the chart, we can see that the “Development” project has generated the highest revenue, followed by “SaaS” and “Consulting” projects. This information helps to understand the distribution of revenue among different projects.“
This functionality saves a lot of time in reporting and is available for everyone. Here are the tips on how to visualize financial data.
Here’s a quick video summary on how to analyze data with AI:
Prescriptive Analytics: What It Means
Prescriptive analytics goes beyond descriptive and predictive analytics by suggesting optimal courses of action. AI-driven descriptive analytics models recommend the best decisions to achieve specific objectives.
How AI Recommends Actions
AI recommendations stem from the analysis of historical data, real-time inputs, and predefined business rules. These recommendations guide decision-makers, ensuring that actions are data-driven and aligned with organizational goals.
AI in Data Visualization Tools
AI-Integrated Data Visualization Platforms
Data visualization and analysis tools are incorporating AI to automate chart creation, offer data-driven design recommendations, and enhance user experiences. AI explainability is pretty high and it can help with different types of data analytics and service data.
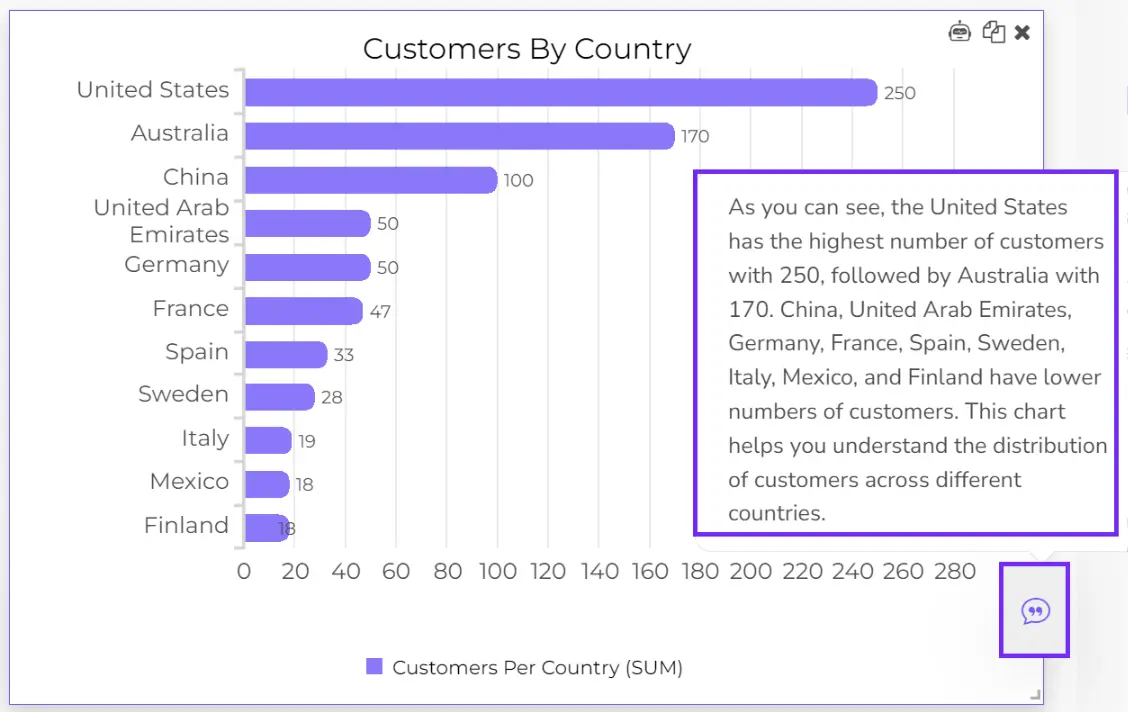
These advancements simplify data exploration and storytelling. As you can simply share your report with others and comments will perfectly supplement the data storytelling.
Customizing Visualizations with AI
AI helps users tailor visualizations to their needs by automatically selecting the most appropriate chart types, color schemes, and labeling. Customized visuals enhance data clarity and impact. Here’s an example from Ajelix platform of how AI helps in data visualization for data analysis.
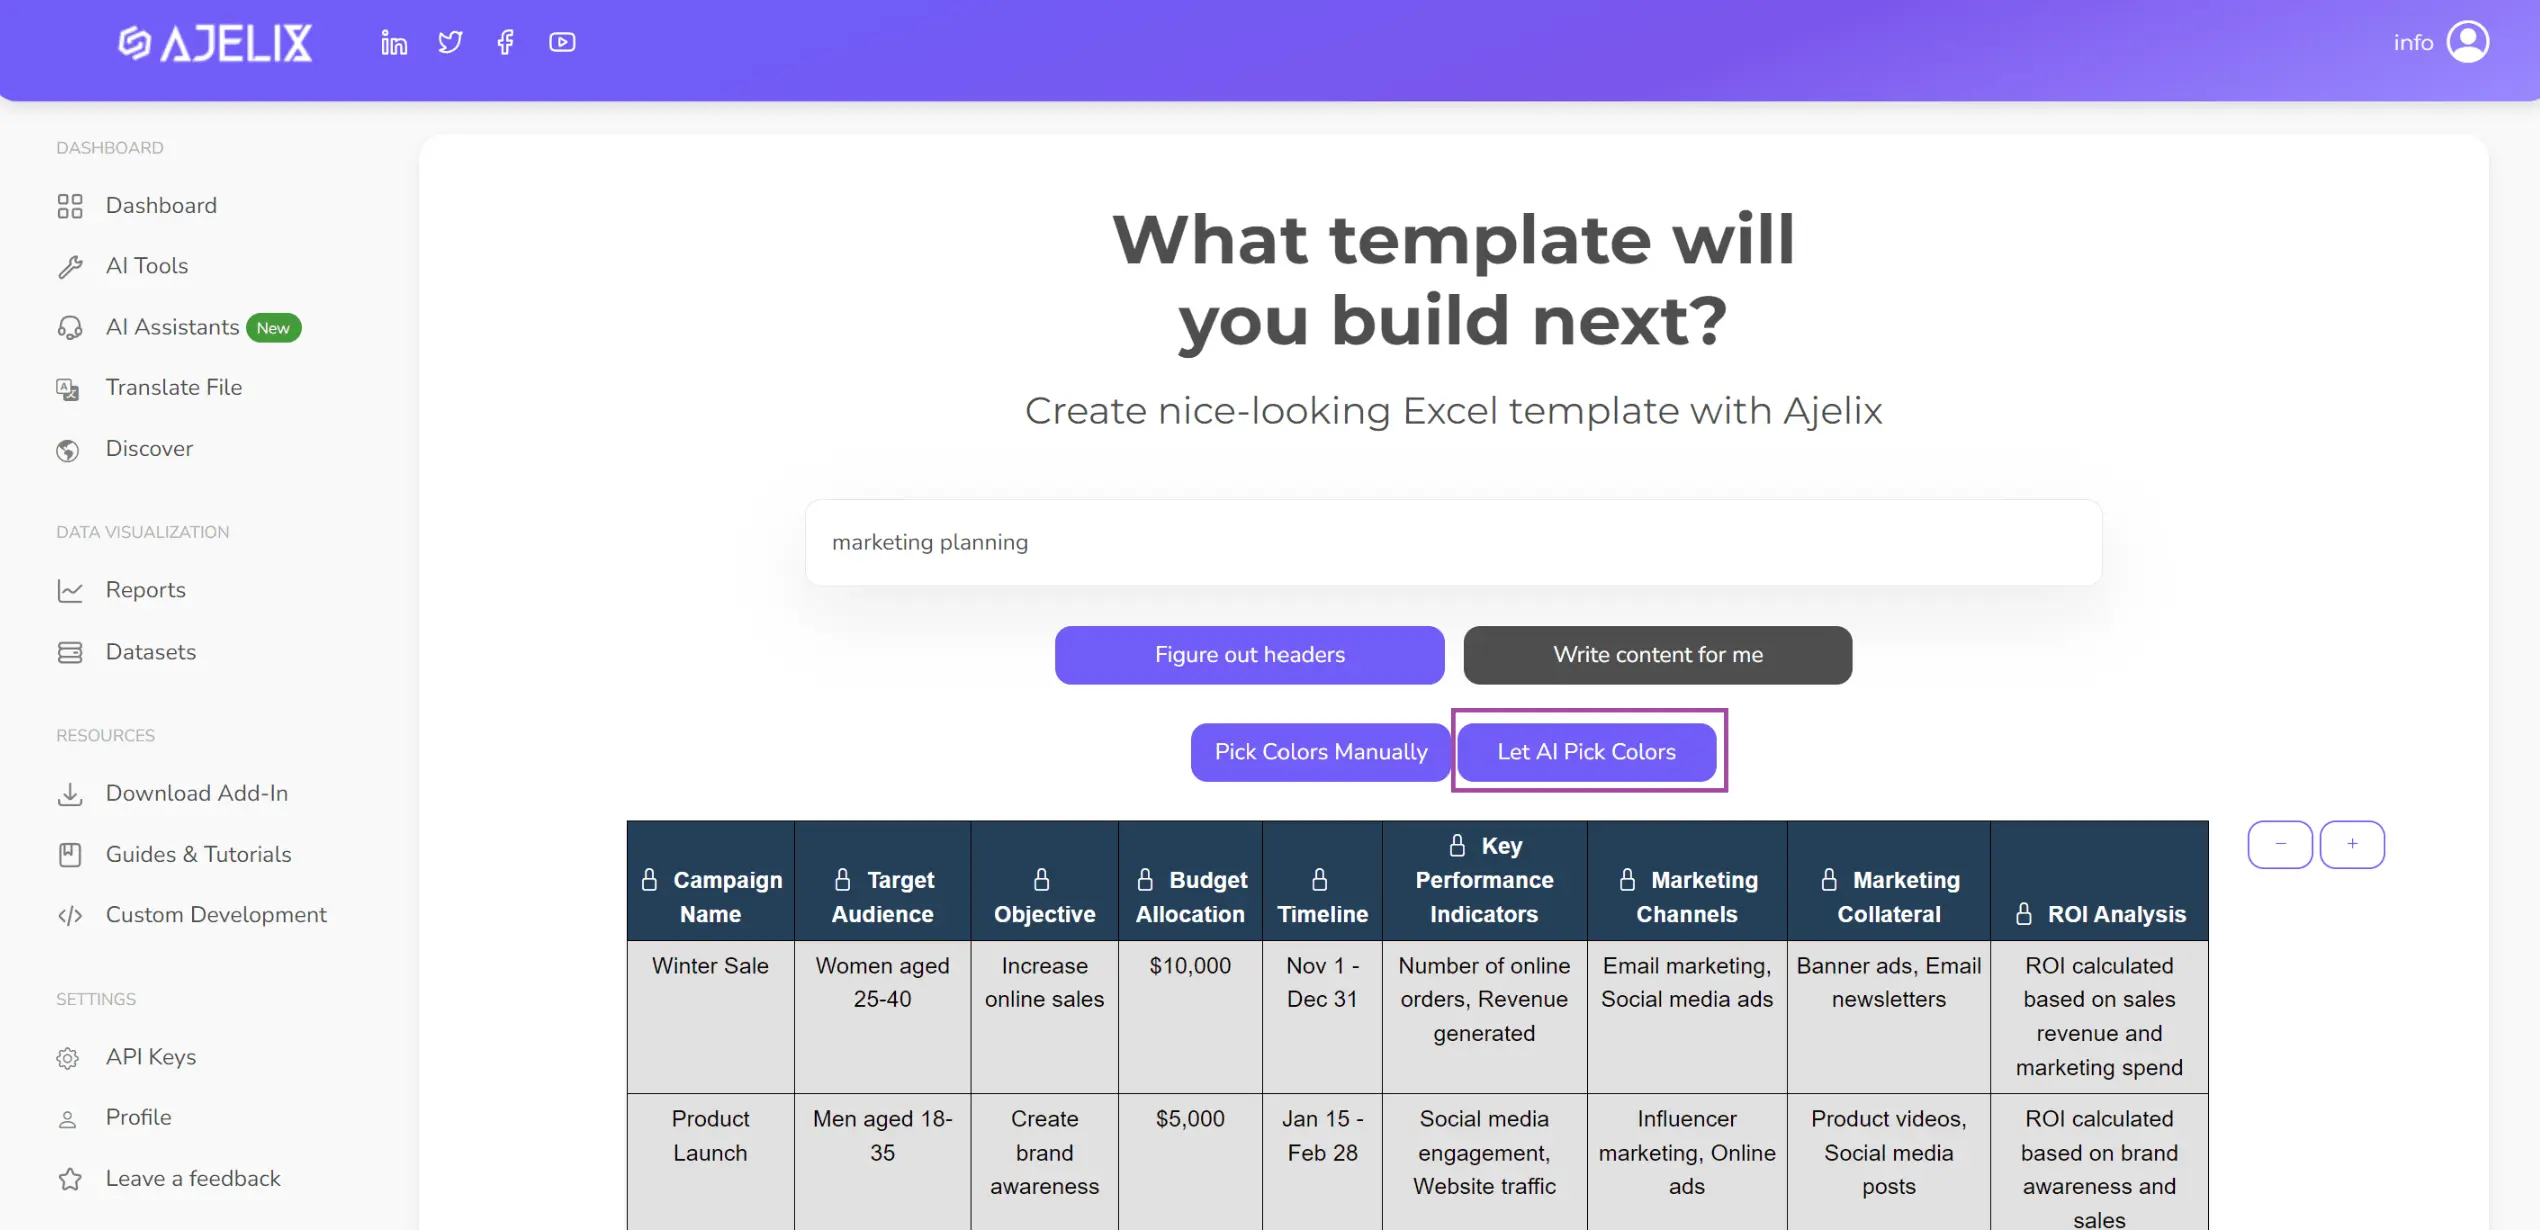
Here you have the table and you can let AI analysis platform pick colors for your table. You can choose your own colors, but this only helps you speed up the visualization. Learn more about template builder and self-service analytics.
Benefits and Limitations
Discussing the advantages and limitations of AI in data visualization analytics tools provides readers with a balanced perspective. Highlight the potential for enhanced efficiency and usability while acknowledging AI’s evolving nature and potential pitfalls.
Ethical Considerations
Bias in AI Data Analysis
AI algorithms can inherit biases present in training data. Explore the implications of bias in data analysis and the steps organizations take to mitigate it. Emilio Ferrara said bias in AI may not be removable or necessary to remove from our systems.
Transparency and Explainability
As AI systems become more complex, ensuring transparency and explainability becomes crucial. Discuss the need for AI systems to provide clear explanations of their decision-making processes.
Privacy Concerns
AI data analysis raises privacy concerns, especially with the increasing collection of personal data. Delve into privacy regulations, applied data analytics anonymization, and the balance between data utility and privacy protection.
The Future of AI in Data Visualization & Analytics
Emerging Trends
AI data visualization and analytics trends include augmented analytics, automated storytelling, and AI integration in all data-driven decision-making.
AI-Driven Decision Support Systems
AI will help decision-makers in different fields by giving them real-time advice and insights through decision support systems.
The Human-AI Collaboration
Discuss how the future of data analysis lies in a harmonious collaboration between humans and AI. AI augments human capabilities, providing deeper insights and faster analysis.
Ready to test AI in data visualization?
From data to report in one minute or less with Ajelix AI Agent