7 Power BI Alternatives You Can’t Miss 2026
Microsoft Power BI is a powerful platform that helps companies manage data and create efficient reporting systems ensuring a data-driven culture. However, it’s not a “one solution fits all”. This article will review the best Power BI alternatives.
Power BI is a complex platform that requires advanced setup, DAX function knowledge as well as some programming. That is a deal breaker for most companies because the setup and maintenance require advanced knowledge that can get expensive.
It can get even more overwhelming when every department needs customized reports every month and data analysts’ to-do’s transform into an endless list.
Change the way you work with agentic AI
One-click dashboards,KPI tracking, and AI-powered insights—for work that actually gets done.

Power BI was launched in 2015 as of now the market is flooded with BI and data visualization platforms that outweigh the disadvantages of Power BI. We will take a look at the top 7 best alternatives to ease the data visualization struggles and guide you through the process of choosing the right platform for your business needs.
7 Best Power BI Alternatives for 2026
Quick Glance At Microsoft Power BI
Power BI is one of the leading data visualization and analytics tools that help in creating a data-driven culture for organizations. According to the Trust Radius survey, Microsoft Power BI is the leading BI software in 2021, commanding 36% of the market share.
Power BI features
In this article, we will not mention all the features of such an advanced platform. However, we will highlight the features that make Power BI one of the best BI platforms.
- A variety of data connections
- DAX formulas
- Data transformations through queries (Power Query editor)
- Integration into Microsoft’s ecosystem
- Scheduled Data Refresh
- Creating custom visualizations (for developers)
Power BI is a powerful tool for experts, developers, and experienced data analysts. But it’s too complex for non-experienced users. It can also get pricy, in this chapter, we will summarize the cons and limitations of this platform.
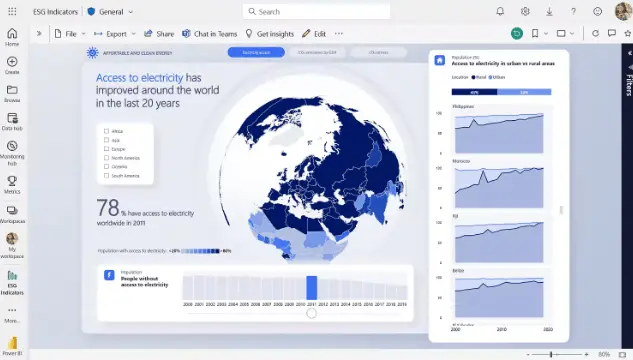
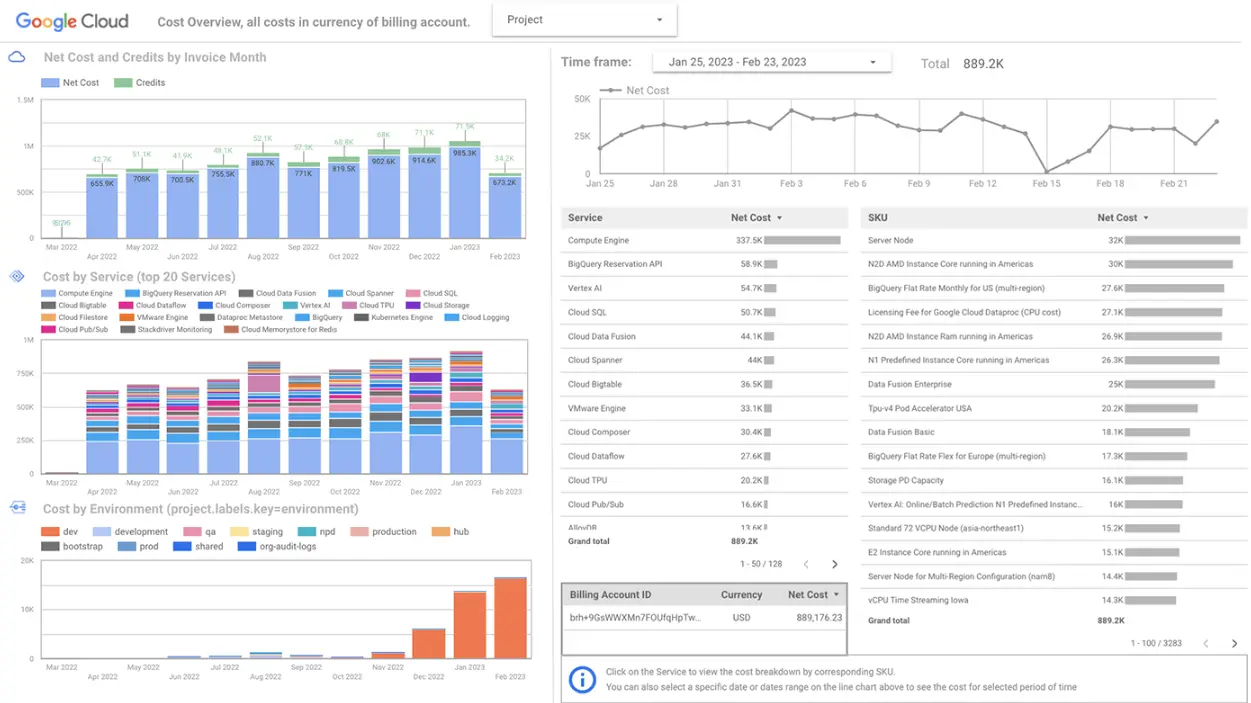
Dashboard screenshot from Power BI website
Power BI cons & limitations
Here’s our summary of the cons that the MS BI platform has:
- Complex setup and advanced knowledge in DAX function writing are needed.
- Need advanced data analysts who will set up the report for your business.
- Hard to create a responsivity for mobile applications. You have to create a separate report for mobile apps.
- The web interface lacks functionality for report building.
- Steep learning curve. There’s so much functionality that most users do not use, that it can get overwhelming to create a report.
- You can’t protect the report with the password. Once you publish the report online, it can be accessed by anyone.
- Hard to make changes. Every time you need to make changes, you have to contact data analysts.
- You can’t open the report in new computer easily. Every time you want to access the file, you need to install it on the new computer.
- Several user editing is not supported. Several editors can’t edit the report because the report is stored locally.
- You can’t solve problems immediately. Once you have an issue, it can take weeks for you to solve it with several external consultants.
- No cross-platform editing. You can’t edit the reports from a mobile or tablet.
- Dependency on Microsoft ecosystem. While this is an advantage for users already using Microsoft products, it might be a limitation for organizations using other platforms.
- You can’t add custom HTML and videos easily. It’s a complex process for such a simple feature.
- Real-time data refresh is not instant. Once you edit the report, it can take some time for the changes to appear in the system.
- You can’t simply unpublish the report. If you want to remove the report, you need to delete the file.
The cons were summarized using software review platforms and writers experience. The cons for this platform can be very subjective, as each organization has different needs and possibilities.
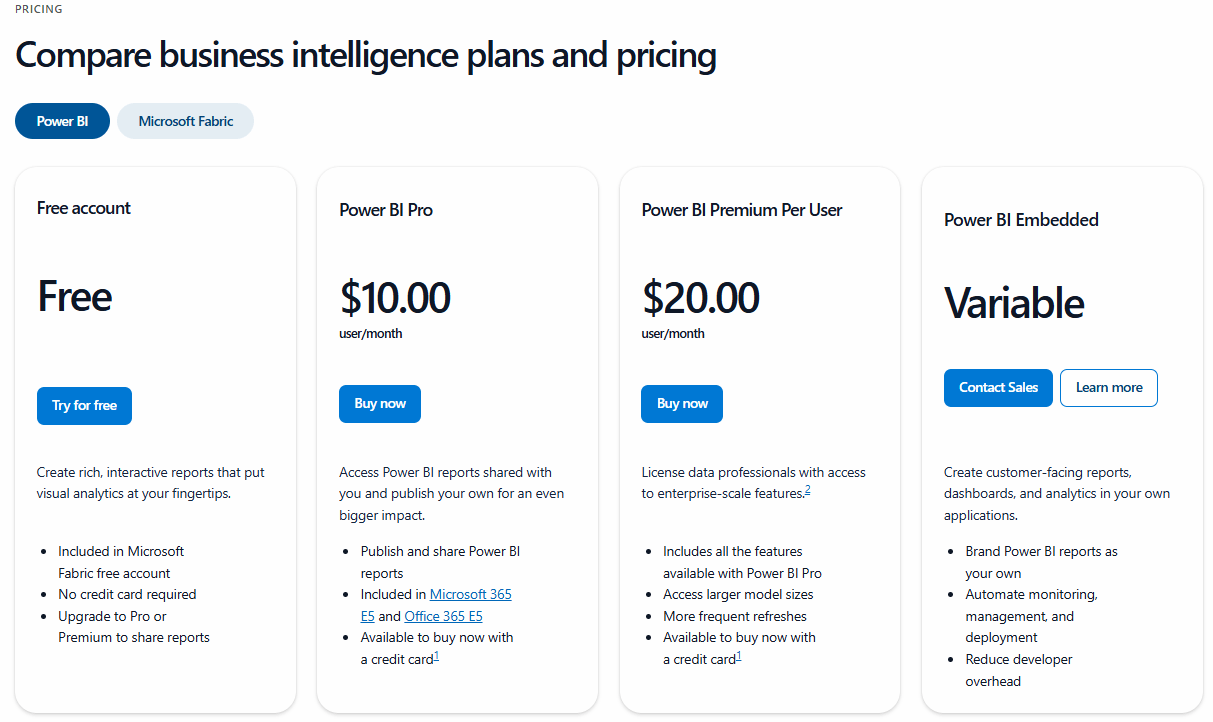
pricing
The platform offers mainly three plans with a fixed price, however, you can get customized offers by contacting the sales team. There are several bigger packages that we will review later in this article.
- Free: This plan is intended for individuals who want to create reports for personal use. You won’t be able to share the reports or collaborate with others.
- Power BI Pro: This plan is for individual users who want to collaborate on reports with other users. You’ll also have advanced analytics features that are not available in the free plan. It will cost you 10$ per user/month.
- Power BI Premium per user: this plan includes advanced features such as AI analytics, insights, a faster refresh rate, and 23 other features. This plan costs 20$ per user/month.
4. Power BI in Microsoft Fabric: Some plans are measured based on the SKU capacity. The more you need it, the more you pay. This plan includes storing and managing all your company data in one place with advanced data analytics. The main goal of this plan is to avoid out-of-date reports and manage large amounts of data to turn them into insights.

Pricing for the MS Fabric plan is based on consumption, so for further information, you can check the Microsoft page provided above. Organizations should keep in mind that by choosing these plans, you’ll have to go through massive migration and implementation phases. However, it could be very beneficial for companies that deal with big amounts of data.
Users
As you can see, the possibilities of this platform are endless, but that doesn’t mean everyone can benefit from it. Here’s our list that should be using this platform:
- Enterprise companies that deal with large amounts of data.
- Companies with many data sources that need help with data integration in one place.
- Advanced professionals – data analysts who know DAX formulas.
- Workspaces that already use MS environment.
Top 7 Power BI Alternatives & Competitors
Based on the Accenture report in 2020, 74% of employees report feeling overwhelmed or unhappy when working with data. Power BI is one of the biggest players in the market, so let’s take a look at how we can turn these statistics into something more positive by looking into the best alternatives.
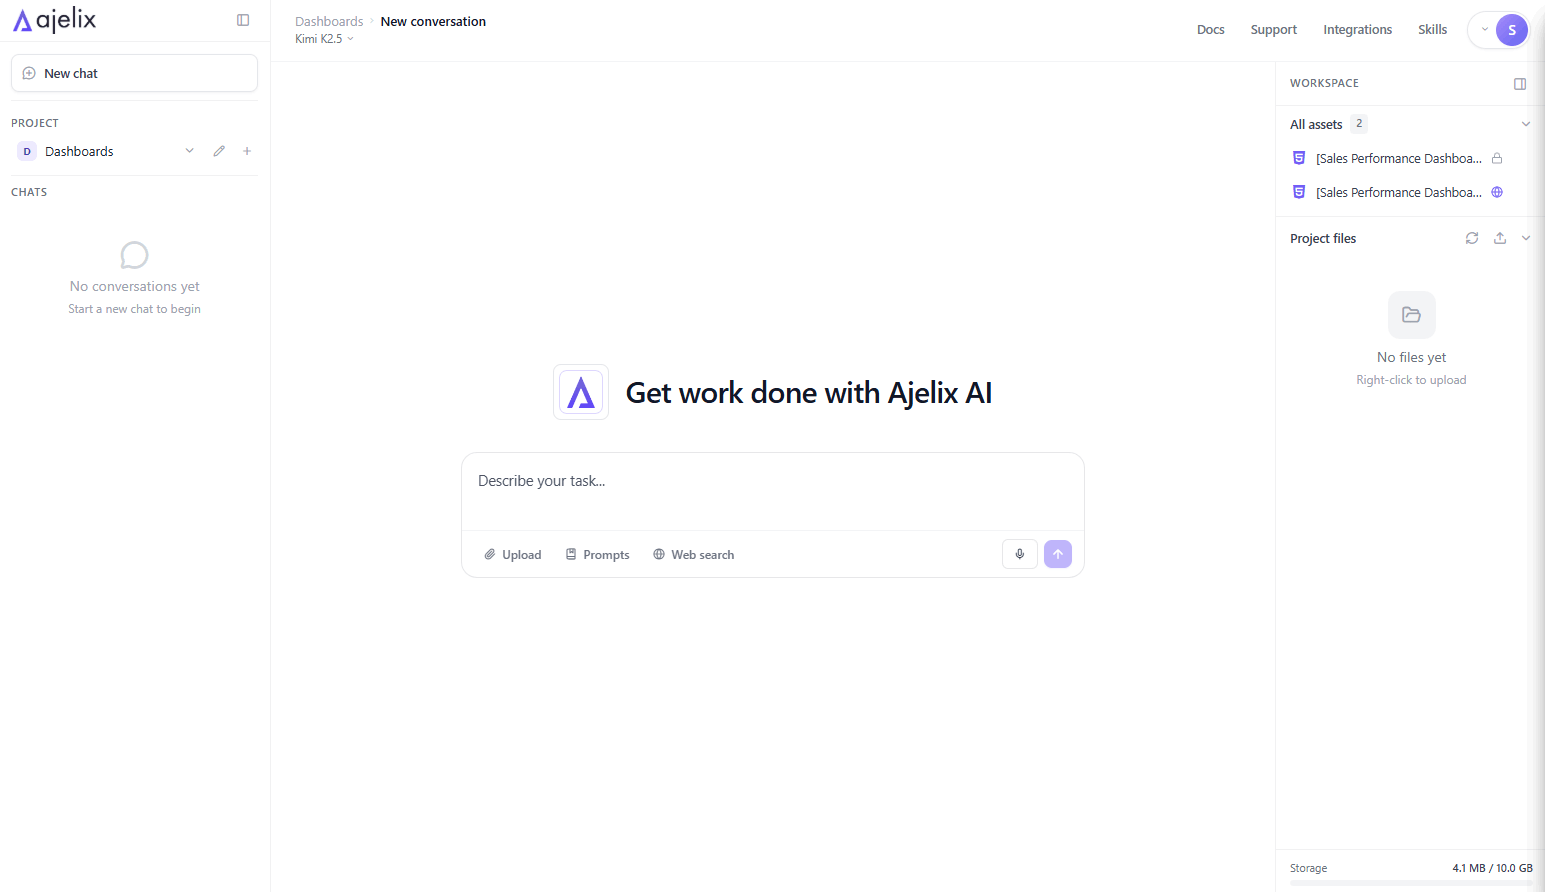
1. Ajelix
Most BI tools are built for data specialists. Ajelix is built for everyone else.
Ajelix brings a new approach to business intelligence: conversational BI through agentic AI.
The platform lets you create reports and dashboards through an AI Agent that gets the job done in minutes. The experience is intentionally simple – there’s nothing to configure, nothing to learn, and no steep learning curve standing between you and your data.
Ajelix features
- Conversational BI – no setup needed. Chat with the AI Agent to build dashboards, reports, and apps instantly. Any employee can work with company data and produce board-ready results from day one.
- Natural language data exploration. Ask questions in plain English and get insights, analysis, and visualizations on the spot – no SQL, no formulas, no technical knowledge required.
- Multiple data sources in one place. Import Google Sheets, Excel files, PDFs, CSVs, presentations, and documents – up to 1GB and turn them into interactive dashboards automatically.
- AI data preparation built in. Messy files? No problem. Ajelix cleanses data, extracts information from PDFs and images, and calculates KPIs without any manual work.
- Production-ready assets in one click. Generate working dashboards, Excel files, presentations, and web apps just by describing what you need.
- Instant sharing and collaboration. Share dashboards and reports with a single link – embedded and ready for your team or clients.
- Persistent workspace. Your files, assets, and conversation history are always saved. No re-uploading, no re-explaining – just pick up where you left off.
- Automatic insights and trend detection. Ajelix doesn’t just show data – it explains it. Get analysis, trends, and actionable recommendations surfaced automatically.
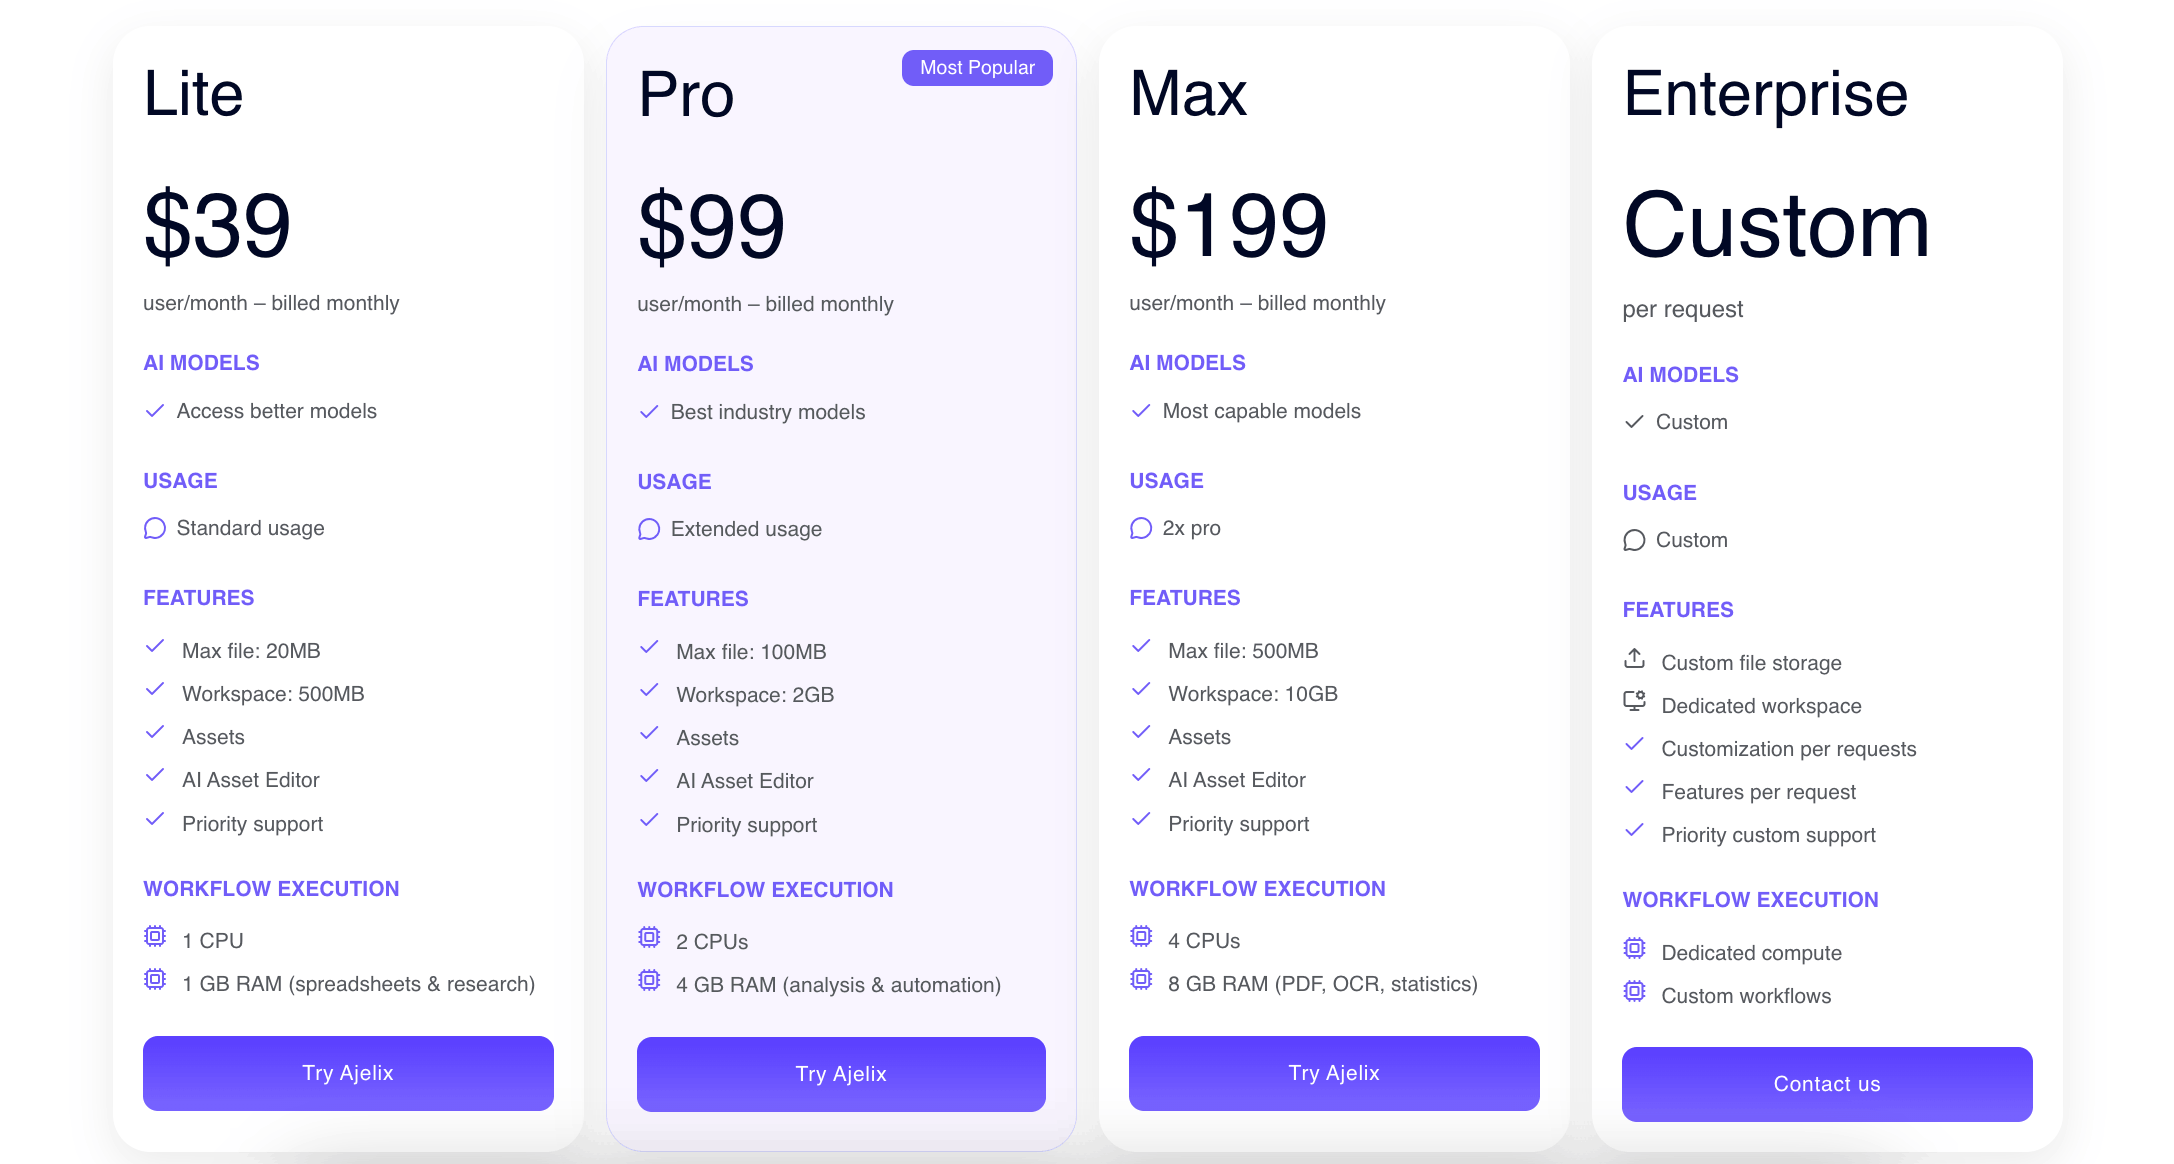
Pricing
Whether you’re just getting started or running large-scale reports, there’s a plan built for you:
- You can try it for free before committing.
- Lite $39/month – More power for individuals. Asset creation, larger files, and a dedicated workspace.
- Pro $99/month – Unlock the full platform with top AI models, increased limits, and extended usage.
- Max $199/month – Maximum capacity for heavy users. Bigger files, more storage, and twice the processing power.
Behind Ajelix is a team of dedicated developers building tools with one goal: helping businesses work smarter. You get more than software – you get ongoing updates, real support, and a partner that grows with you.
Best for
- Solo entrepreneurs and individuals who need fast, data-driven decisions without the complexity
- Finance teams that want to automate reporting, variance analysis, and cut down manual work
- Marketing teams producing polished, client-ready deliverables straight from raw data
- Departments across any organization that need flexible, on-demand reporting without waiting on IT
- Small and medium businesses that need enterprise-level insights without enterprise-level overhead
- Non-technical teams who want powerful results without touching a single formula or configuration
- Anyone who needs finished, working assets – dashboards, apps, presentations, and Excel files delivered in minutes
Reporting gives you a headache?
Upload your data and create professional reports with agentic AI

Start free
Try free and upgrade whenever
2. Dundas BI
Dundas BI is a business intelligence (BI) and data visualization platform that allows organizations to create interactive and customizable dashboards, reports, and analytics.
Features
- Data Visualization: platform provides a variety of data visualization options, including charts, graphs, and maps.
- Interactive Dashboards: Users can create interactive dashboards that allow for drill-downs, filtering, and exploration of data.
- Ad Hoc Reporting: The platform supports ad hoc reporting, allowing users to create reports without relying on pre-built templates.
Pricing
It’s hard to find anything about the pricing unless you contact support or register on their platform. After some searching and clicking on several links we were finally able to get the pricing. To view the pricing you have to provide business details and email. (Oh, and you can’t use your Gmail email)
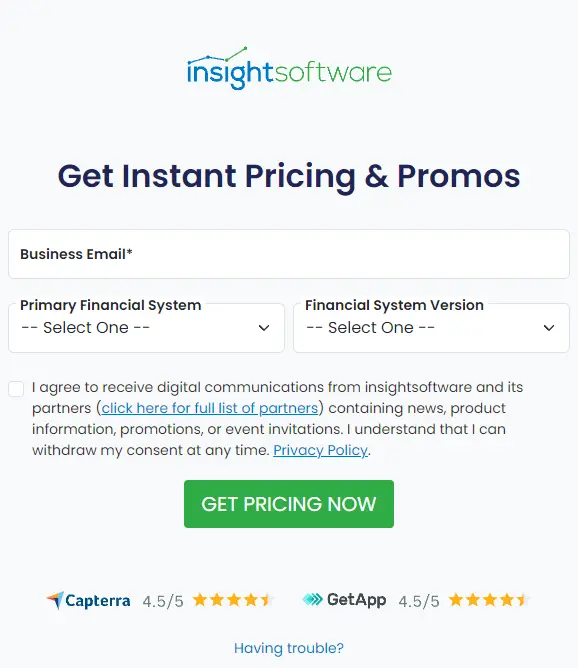
Dundas BI pricing screenshot from their website.
After some searching, we didn’t find the pricing unless we contacted the support. We also did some searching online but even that didn’t answer our question.
Limitations & cons
- Steep learning curve – there’s documentation available, however, it’s insufficient for the complexity of the system.
- Difficult entry – you need to talk to the sales even if you want to test it or get the pricing.
- Speed issues are mentioned by the customers, as the system can stop functioning if there’s a large amount of data used.
Cons were summarized using a software review site.
Related Article: How AI Data analytics and visualization work?
3. Tableau
Tableau is a great Power BI alternative as it has a balance of usability and scalability making it a popular choice for organizations seeking powerful data visualization and analysis tools.
It’s great for enterprise companies looking for the next level of data insights as Tableau is one of the most advanced systems out there.
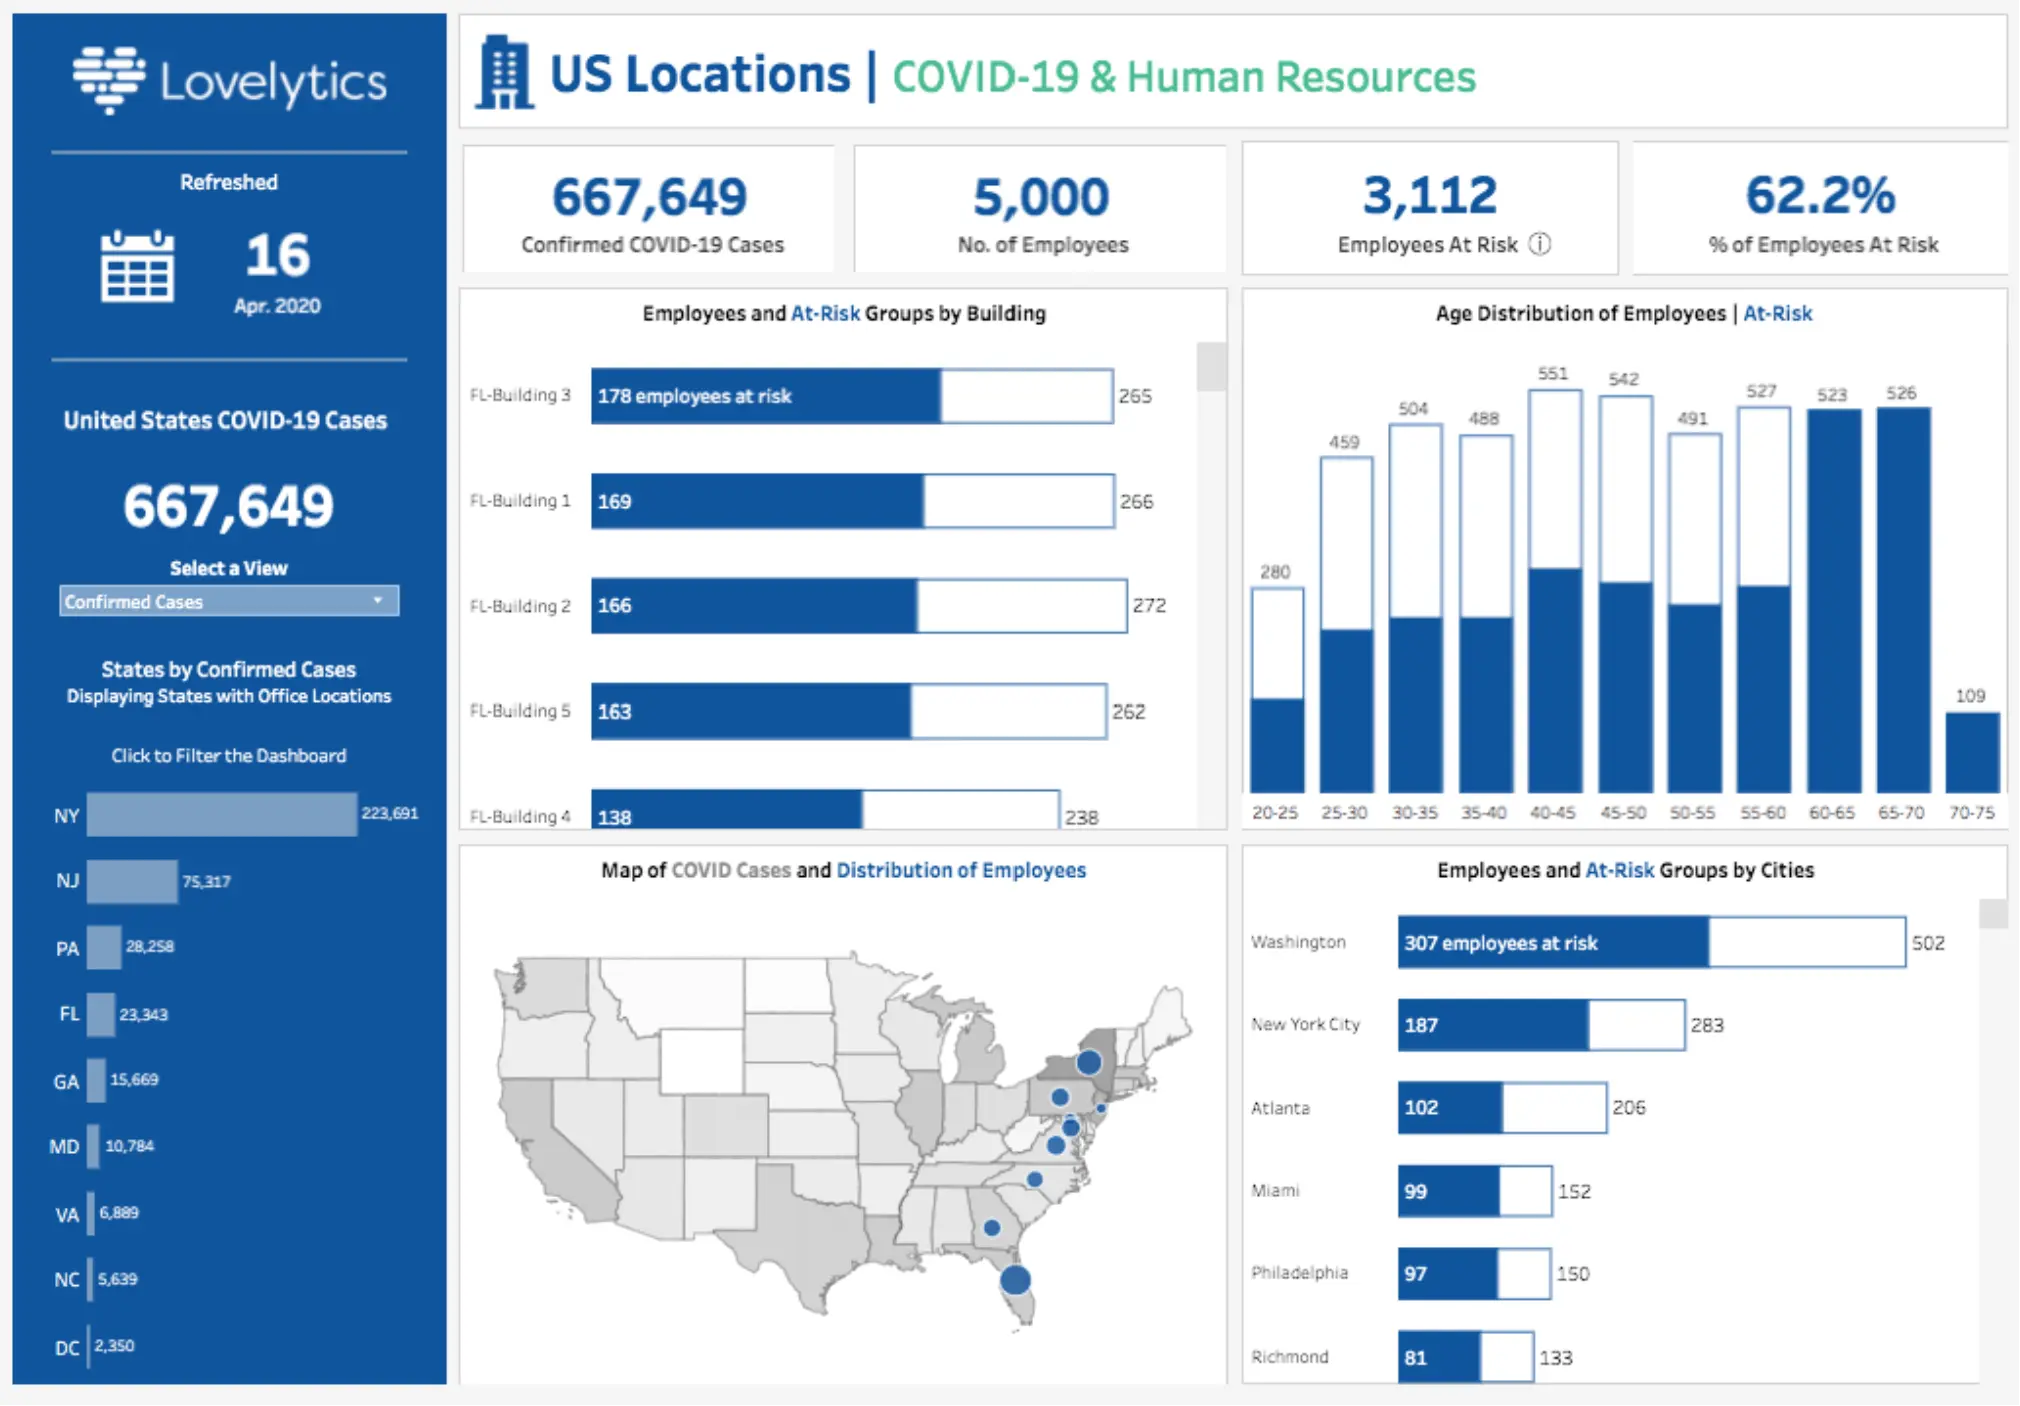
Tableau features
- Advanced AI & ML integration.
- You can perform complex analytics with large amounts of data without any issues.
- The platform is built to carry out difficult tasks so you won’t encounter speed issues.
- Have a mobile-friendly version.
Pricing
Tableau offers three pricing plans:
- Tableau Viewer which will cost you 15$ per user a month. This plan includes only the privilege to view the reports your analysts have created.
- Explorer will give you the possibility to edit existing reports and collaborate with other users on the platform.
- Creator at least one of the users from your company should have this license, as it let’s you create the reports and share them. It will cost you 75$ a month per user.
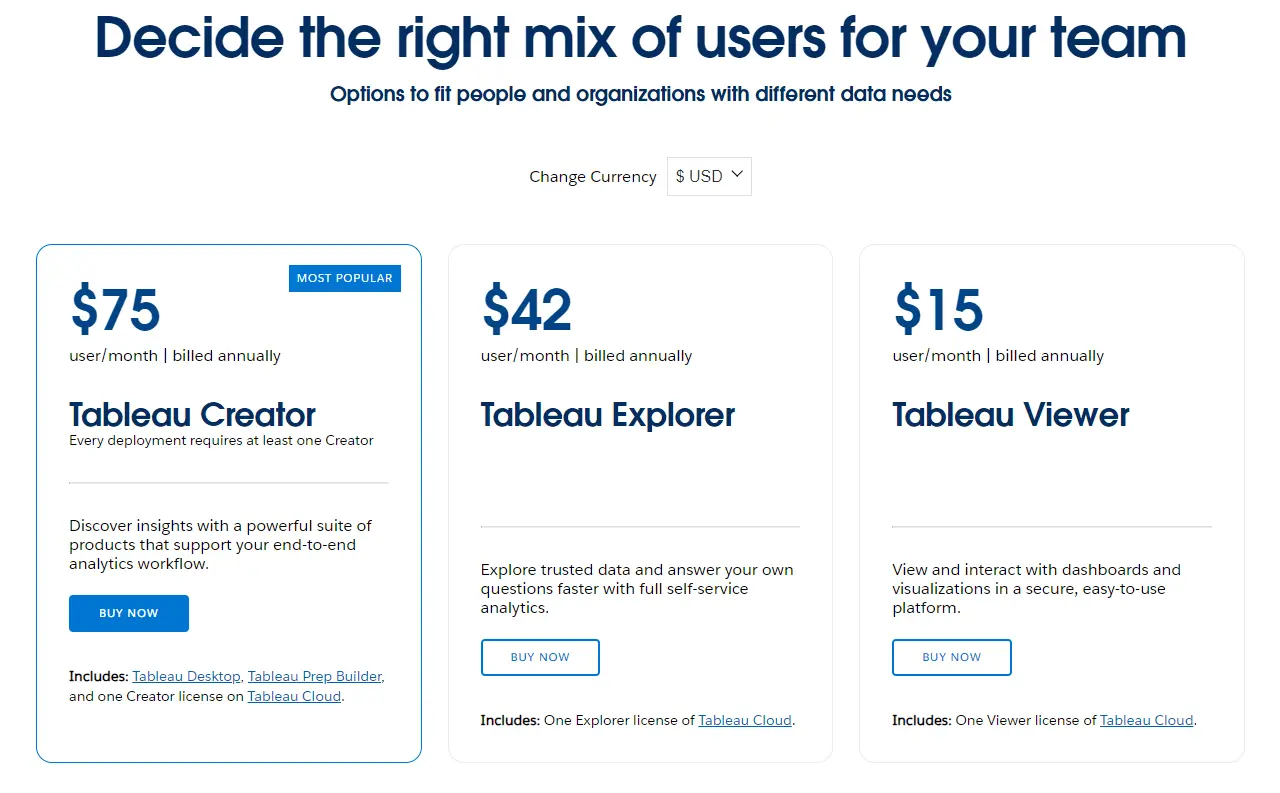
It’s important to mention that all of the plans are billed annually. So if you decide to use this platform you have to pay in advance. The platform doesn’t have a freemium, however, you can get a free trial to understand if this solution is for you.
Tableau limitations & cons
- Tableau doesn’t offer automatic report refreshing.
- The pricing plan is not flexible and is the most pricy solution out there with annual subscriptions.
- Requires SQL knowledge so it can get pricy to get an expert who can set up & maintain the reports.
- Doesn’t have a version control.
- You need to manually approve any changes so they will appear in the report.
- Read detailed Tableau cons and pros overview.
Best For
- Advanced data analysts
- IT specialists
- Enterprises with large amounts of data
- Experts who work with complex data analytics
4. Looker
Looker offers a self-service platform where you can build your custom applications, they also offer the possibility to chat with your business data. It’s also possible to get automatic insights and trends from your data.
Features
- Real-time insights and reports from your choice of cloud.
- Available embedded analytics
- Option to connect with other real-time BI platforms
Pricing
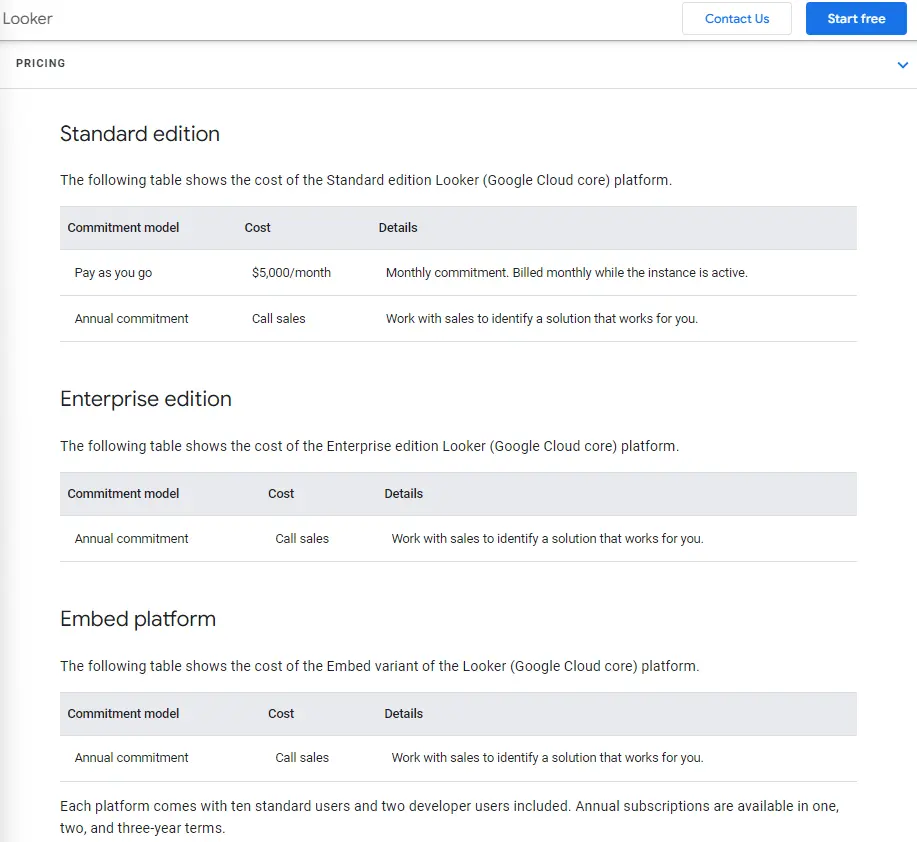
Looker’s pricing plan is separated into two parts: packages and individual licensing for each user. They offer 3 platform editions:
- Standard is for small organizations with up to 50 users and costs $5000/month. You will have 10 standard users, 2 developer users, up to 1000 query-based API calls, and 1000 administrative API calls.
- The enterprise edition offers the same number of licenses. The main difference is the count of API calls: 100,000 query-based API calls and 10,000 administrative API calls. To get the quote you have to contact sales and consider an annual commitment.
- Embed edition, the same amount of licenses, 500 000 query-based API calls, and 100 000 administrative API calls. Pricing can be received by contacting sales.
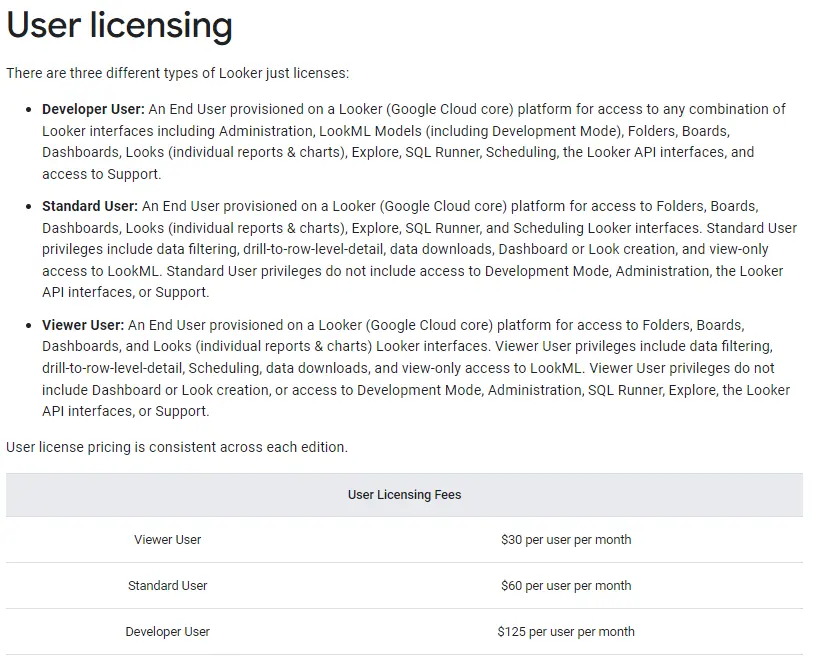
You also have the option to purchase individual licenses:
- The developer user is the license holder who will be able to create the report, it has access to anything that this BI platform offers. The cost is 125$ per user per month.
- Standard users will be able to use and analyze the created reports. This user won’t have access to development mode, administration, API, or support. It will cost you 60$ per user a month.
- Viewer users are pretty straightforward, you can only view the reports and interact with them. The license is 30$ per user per month.
Looker limitations & cons
- Steep learning curve: You need to learn SQL and advanced analytics to even set up this BI.
- Expensive pricing, this platform is one of the most expensive ones that we have reviewed. It would be great for enterprises, but it could be too much for small to medium businesses.
- Limited customer support: it’s hard to get help, and the wait times can be long.
- Some developers have experienced lagging issues when working with big amounts of data.
Limitations were summarized from the software review site and the authors’ test.
Best For
- Enterprise-level companies
- Data analysts who are experienced with SQL and Google solutions
- Companies with big data
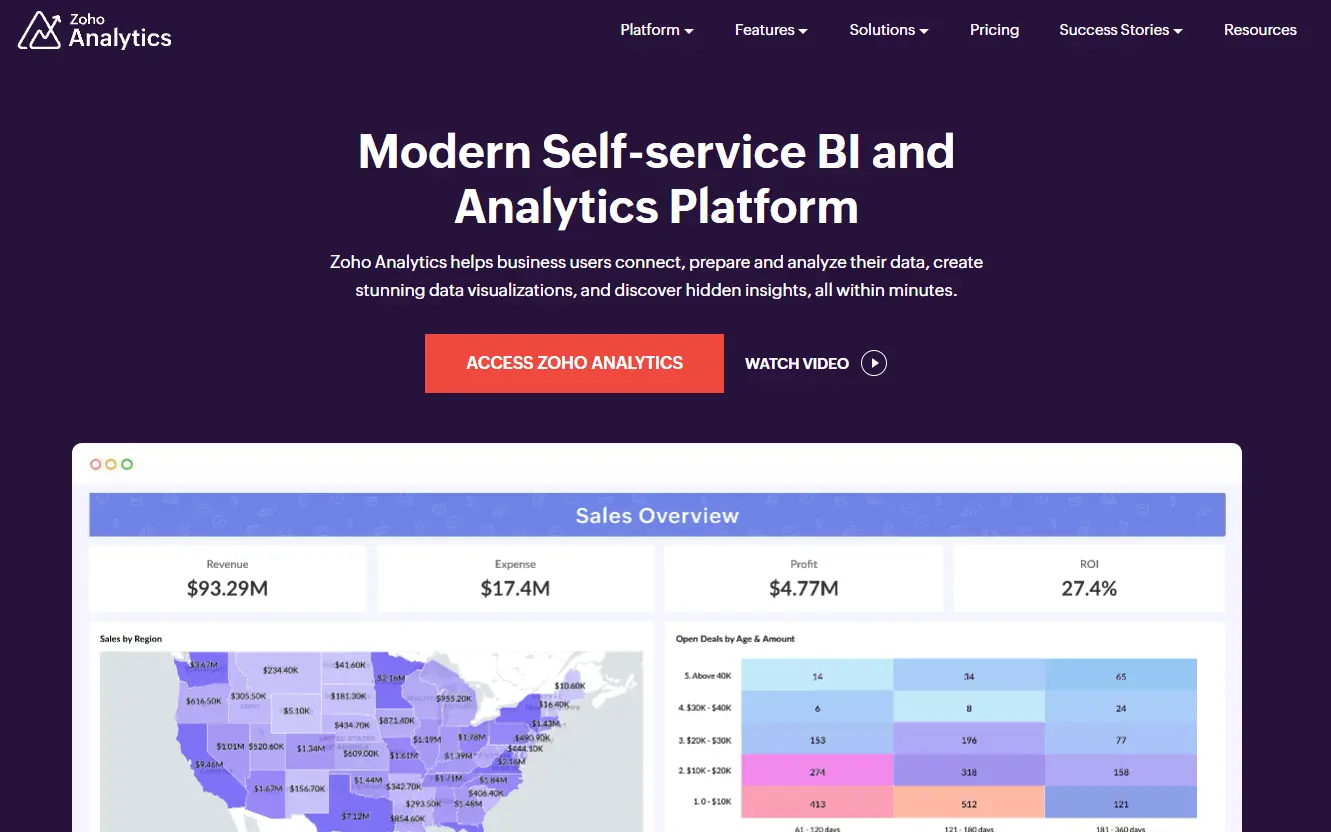
5. Zoho Analytics
Zoho Analytics lets businesses help connect, prepare, analyze, and collaborate data in one place. Their BI platform lets you create reports without any help from IT.
Features
- Option to connect data from different data sources and popular business applications.
- Data preparation and cleansing before report creation.
- AI data analytics
- Collaborate reports with others.
- Embed analytics in your applications with no code solutions.
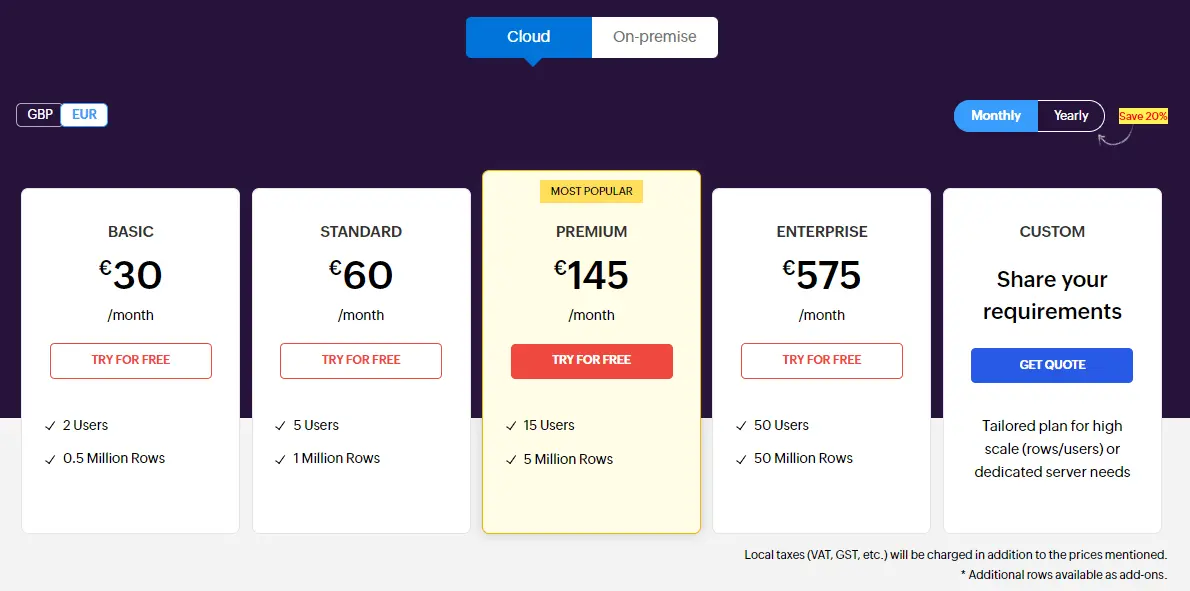
Pricing
Zoho pricing plan is separated into 2 sections: Cloud & On-premise. On-premise plan is more expensive and is separated into 4 plans:
- Basic for 30€ per month and it includes 2 users and 0.5 million rows.
- Standard for 60€ per month with 5 users and 1 million rows.
- Premium for 145€ per month with 15 users and 5 million rows.
- Enterprise for 575€ per month with 50 users and 50 million rows.
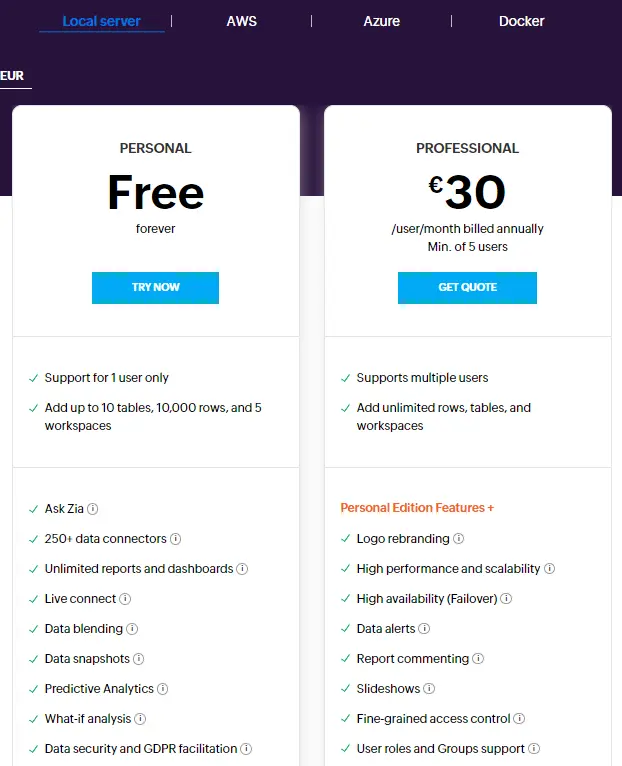
However, if you choose an on-premise solution you will pay less. Here’s a breakdown:
- You can use Zoho in the freemium plan for personal use
- The professional plan costs 30€ per month per user if you add 5 users.
Zoho limitations & cons
- Some customers complain that there should be more videos and resources for better onboarding.
- It can get costly, however, it’s still quite accessible if we compare it to the previous BI tools.
- There’s still a steep learning curve.
- User experience is not intuitive enough and for some reports, there may be a need for an IT specialist.
- Embedded charts can take some time to load.
- There’s still a need to learn SQL to take full advantage of this platform.
The limitations were summarized based on the review site and authors’ tests.
Best For
- Nontechnical teams.
- Users who are not fluent in data analytics.
- Small to medium businesses.
- Analysts who work with SQL.
Related Article: Creating effective data visualization dashboards that tell a story
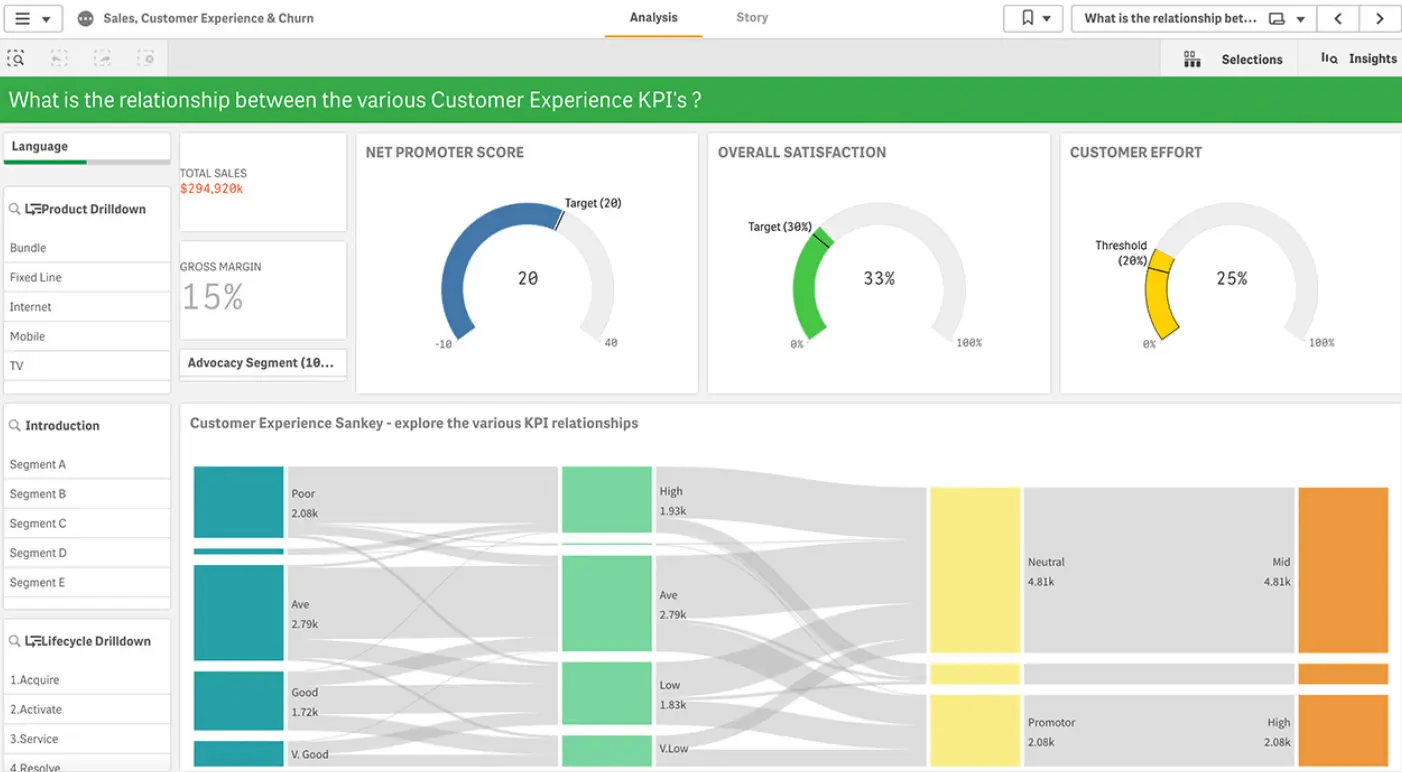
6. Qlik Sense
The selling point that Qlik Sense offers is next-level AI insights and actions from your data. They offer data visualization, AI models, active analytics, and hybrid cloud platforms.
Features
- Self-service visualizations
- Interactive dashboards
- Advanced and predictive analytics
- Reporting
- Mobility
- Custom & embed functions
- AI-powered data insights and analytics.
Pricing
Qlik Sense offers 3 pricing plans:
- Standard plan which costs 20$ per user a month (billed annually) but you have to purchase full users who can create these reports. That will cost you extra.
- The premium plan offers more data capacity, different data sources, and unlimited users. The plan costs $2,700/mo.
- Enterprise is a custom plan where you can get an offer tailored to your needs with better performance and scalability.
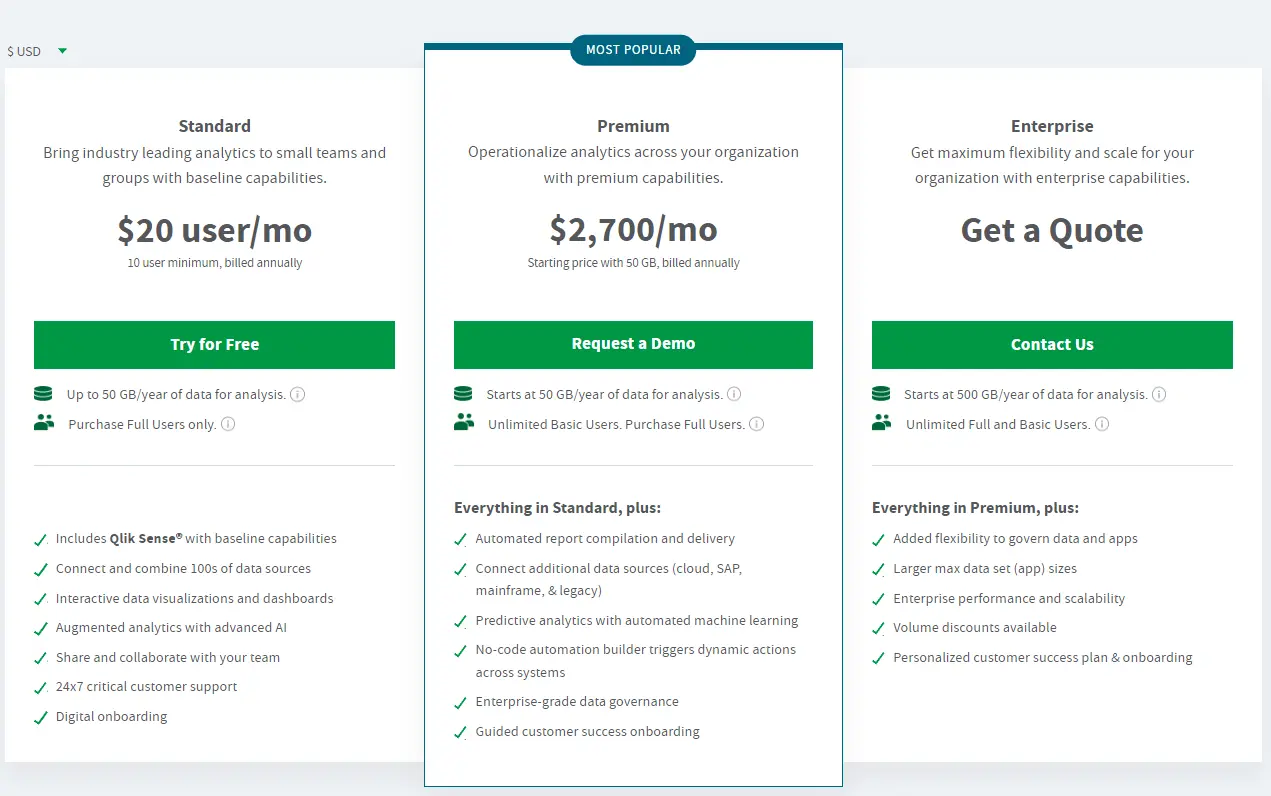
You can also get a 30-day free trial to try out the tool.
Qlik Sense limitations & cons
- Data extraction is limited
- Limited visualizations offer basic charts
- Complicated pricing
- You can face speed issues when working with big amounts of data.
Cons were summarized using feedback from review sites.
Best For
- Data analytics experts
- Medium businesses
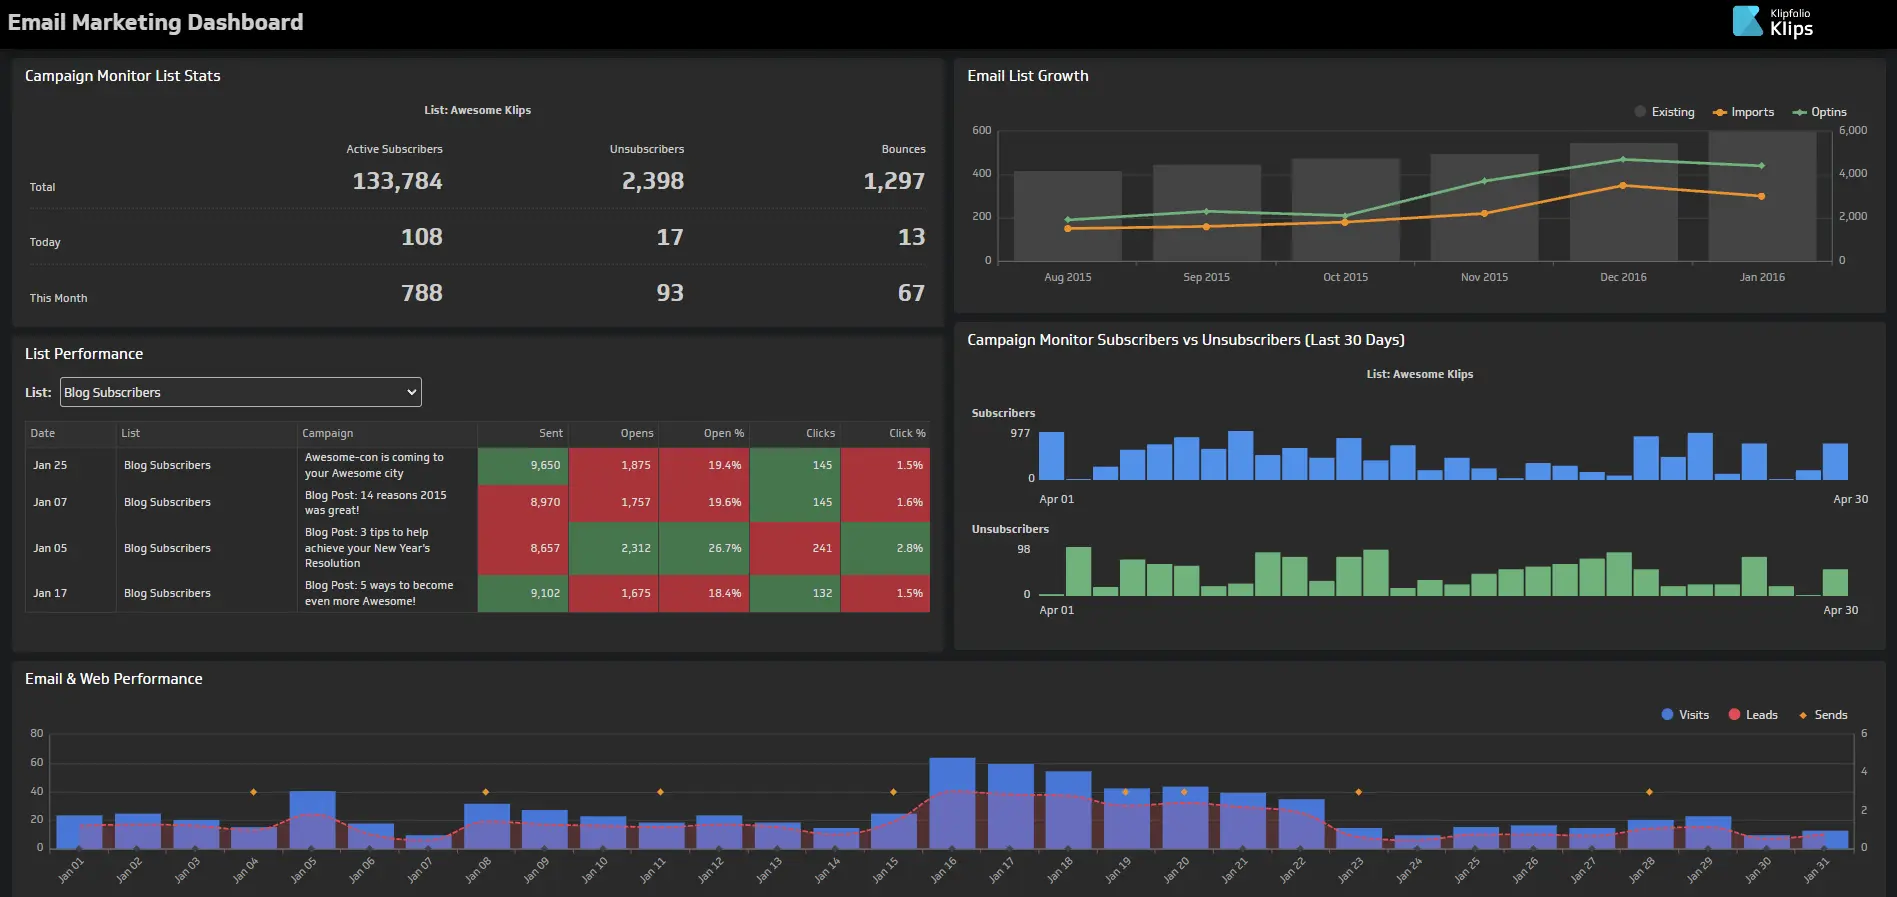
7. Klipfolio
You can create visualizations from spreadsheets to SQL queries with more than 100 data sources. Klipfolio offers great visualizations to make your dashboard professional.
Features
- Create your metrics.
- Ability to connect data from more than 100 data sources.
- Data preparation.
- Data visualization.
- AI data analytics.
- Collaboration and sharing.
Pricing
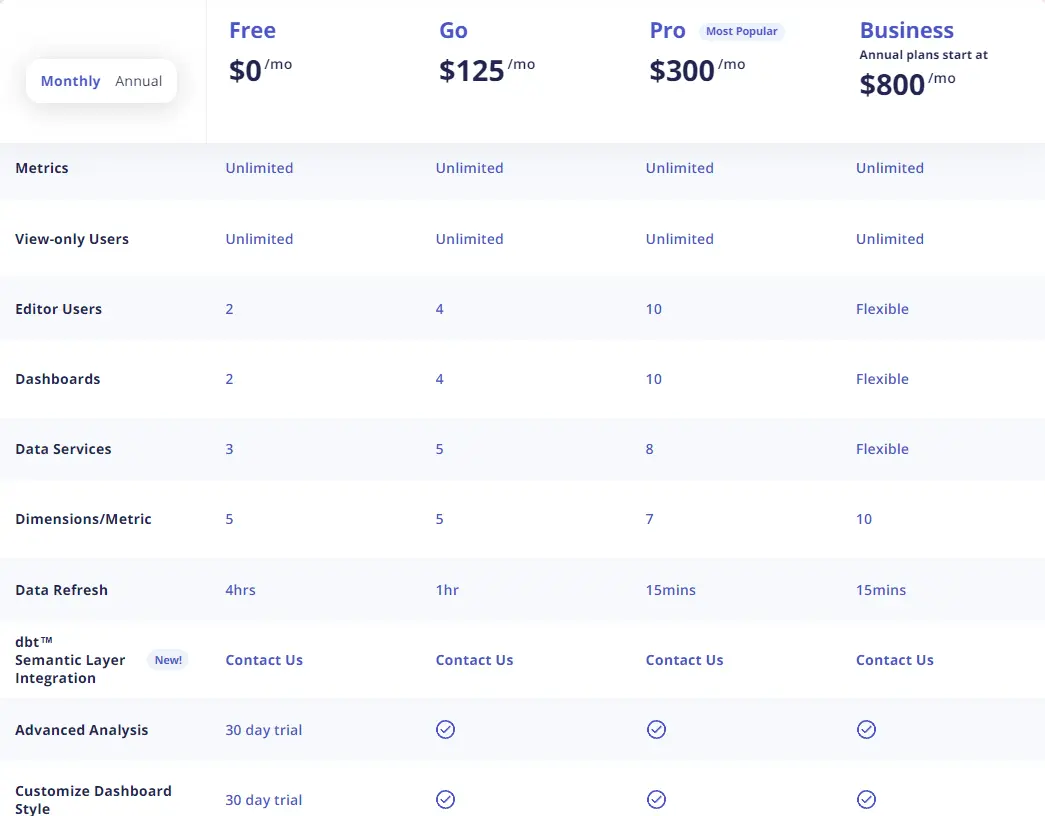
Klipfolio offers 4 pricing plans:
- The free version includes a limited count of users, dashboards, and data sources but it can be enough for small businesses or if you want to try it out. You can get a 30-day trial to test out advanced analytics.
- Go plan will cost you 125$ monthly and it offers more functionality as well as advanced analytics and dashboard customization.
- The pro version costs 300$ monthly and you’ll be able to add more users, dashboards, datasets, etc.
- The business plan costs 800$ a month. In this plan, you can flexibly manage user count, datasets, etc. In addition, you can have a Custom service agreement and vendor assessment.
You can also customize the plan by adding individual licenses:
- Editor – 19$ per user a month
- Adding more metrics – 7$ per metric a month
- Additional dashboard – 19$ per dashboard a month
And the list continues with more different customization features. Keep in mind that these are annual subscription prices if you want to get monthly prices that will cost more.
Klipfolio limitations & cons
- Similar to other BI platforms you might experience lags and speed issues.
- Lack of user interactivity, such as, drag and drop functionality.
- Backend dashboard creation is a complex process.
- You might need an IT professional who will set up & renew API connections.
Cons summarized from the review site.
Best For
- Small to medium companies.
- Non-technical users.
- Great for basic to intermediate data analytics.
Summary
Here’s a quick summary with Power BI alternatives and pricing comparisons.
| Feature | Power BI | Ajelix | Dundas BI | Tableau | Looker | Zoho | Qlik Sense | Klipfolio |
|---|---|---|---|---|---|---|---|---|
| Coding needed | ||||||||
| Pricing | 10$-8.5K$ | 20$-200$ | Not available | 15$-75$ | 30$-5000$ | 30$-575$ | 20$-2700$ | 125$-800$ |
| Complex Pricing | ||||||||
| Freemium |
FAQ
Some Power BI alternatives offer mobile access or easier report building. Additionally, free tiers or budget-friendly options might be a better fit. For those who don’t rely on Microsoft products, alternative platforms offer seamless integration. Finally, some specialize in features like AI or unique visualizations, providing a broader range of analytical capabilities.
Yes, several free and open-source alternatives to Power BI exist, offering similar data visualization features. Some popular options include Ajelix, Tableau, Apache Superset, Metabase, and Redash.
There’s a general perception that Power BI has a slight edge in ease of use, especially for beginners. However, both offer intuitive interfaces and drag-and-drop functionality, making the learning curve manageable.
When choosing a Power BI alternative, focus on your needs: budget, features (mobile access, specific analytics), existing software ecosystem (avoiding Microsoft lock-in), and desired level of visualization complexity (AI, unique charts).
Ready to start creating reports with Ajelix AI Agents?
From data to report in one minute or less with Ajelix AI Agents


