Small Business Data Visualization: Where To Start?
Businesses of all sizes are collecting and gathering mountains of data. ⛰️But what’s the point of gathering if you don’t analyze it? That’s where small business data visualization plays a vital role.
The main goal of data visualization is to turn raw data tables into actionable charts and graphs to help you identify patterns and make informed decisions.
This article will cover why data visualization matters and help small business owners start this process painlessly.
Change the way you work with agentic AI
One-click dashboards,KPI tracking, and AI-powered insights—for work that actually gets done.

What is Small Business data visualization?
Data visualization is the graphical representation of data to help you uncover patterns, trends, and insights. It can help you transform raw data into a visual format, allowing you to understand complex information quickly.
Data visualization can help any small business:
- Turn data into actionable insights
- Make informed decisions
- Communicate data findings more efficiently
Why Small Businesses Should Embrace Data Visualization?
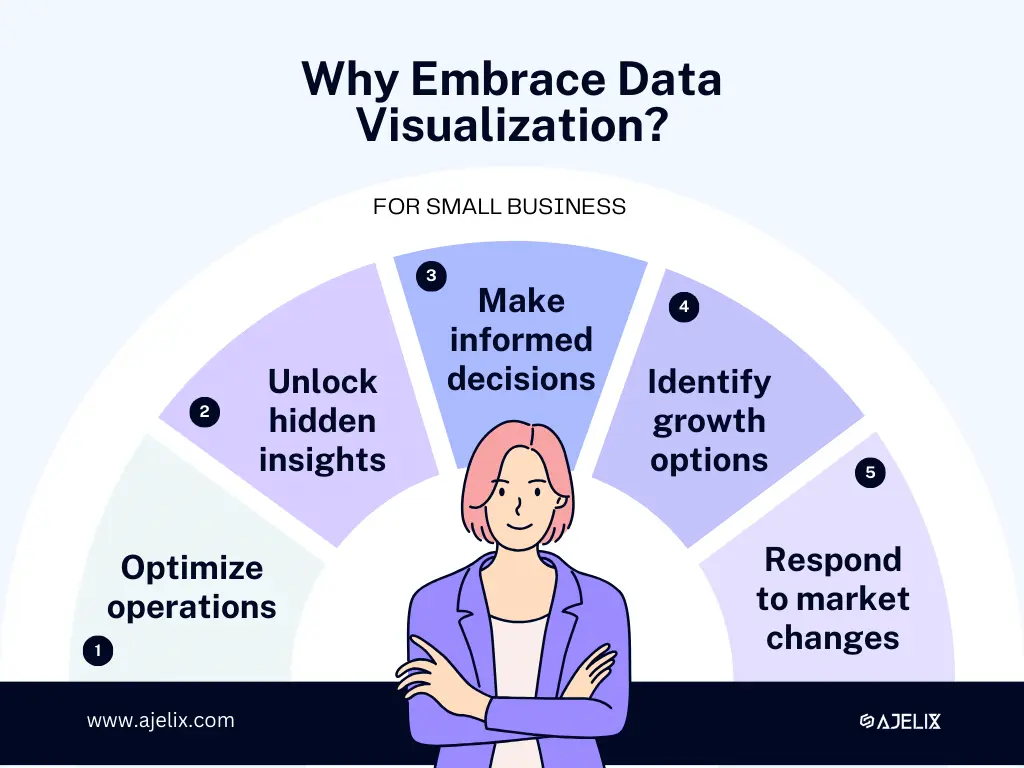
Small businesses, often navigating resource constraints, can leverage data visualization to optimize their operations. This process can foster a culture of data-driven decision-making, helping unlock hidden insights, identify growth opportunities, and respond proactively to market trends.
What are the Benefits of Data Visualization for Small Businesses?
1. Improved Decision-Making
Data visualization can help business owners see patterns and trends in their data that might not be apparent from looking at raw numbers. This can help you make more informed decisions about everything from product development to marketing campaigns.
2. Increased Efficiency
Identify areas where you can improve efficiency. By tracking key performance indicators (KPIs), businesses can see where they are losing time or money. This information can be used to make informed decisions in processes.
3. Improved Customer Satisfaction
Understand your customers better. By tracking customer behavior and preferences, you can tailor your products and services to better meet customer needs. This can lead to increased customer satisfaction and loyalty.
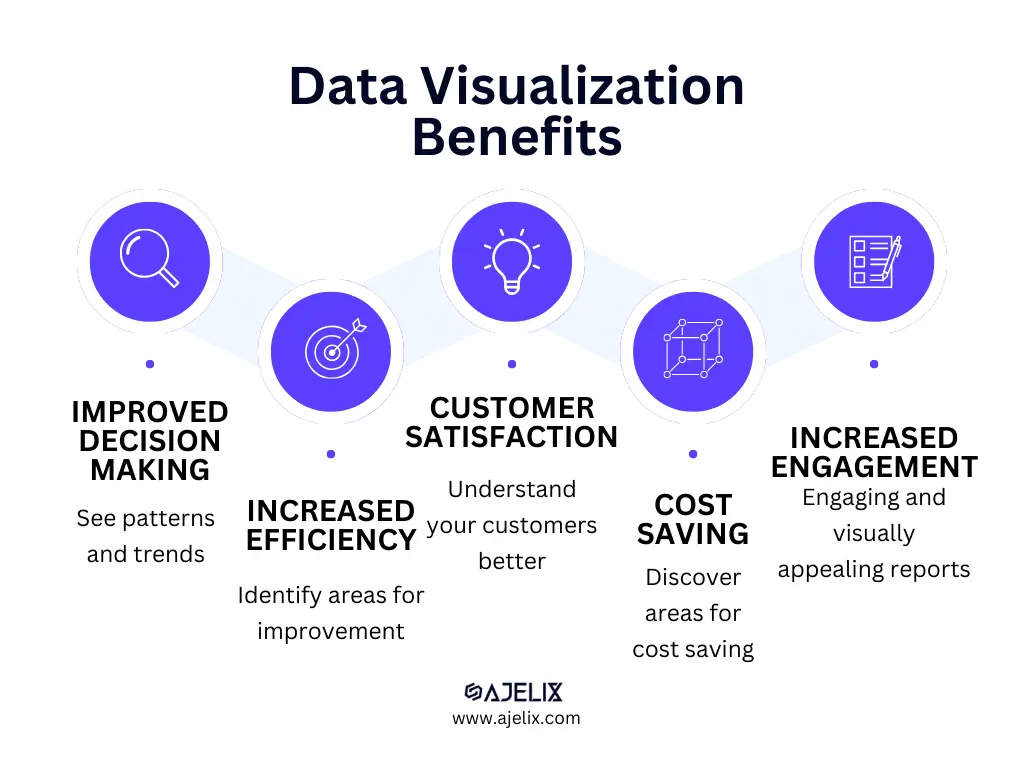
4. Cost Saving
Data visualization tools can be relatively inexpensive, and they can often be used to save money in other areas of the business. Or with the help of data analytics you can discover areas where your business is draining money.
5. Increased engagement
Create more engaging and visually appealing presentations, reports, and dashboards. This can help improve communication and make it easier for employees to understand complex data. It can make it easier to communicate complex findings to stakeholders, fostering a shared understanding of business strategies and goals.
6. Identify Trends and Patterns
Data visualization tools excel in highlighting trends and patterns within data sets, providing small businesses with invaluable insights into customer behaviors, market trends, and operational efficiencies.
Related Article: Explore Best Data Visualization Software for Mac
How To Implement Data Visualization In Your Business?
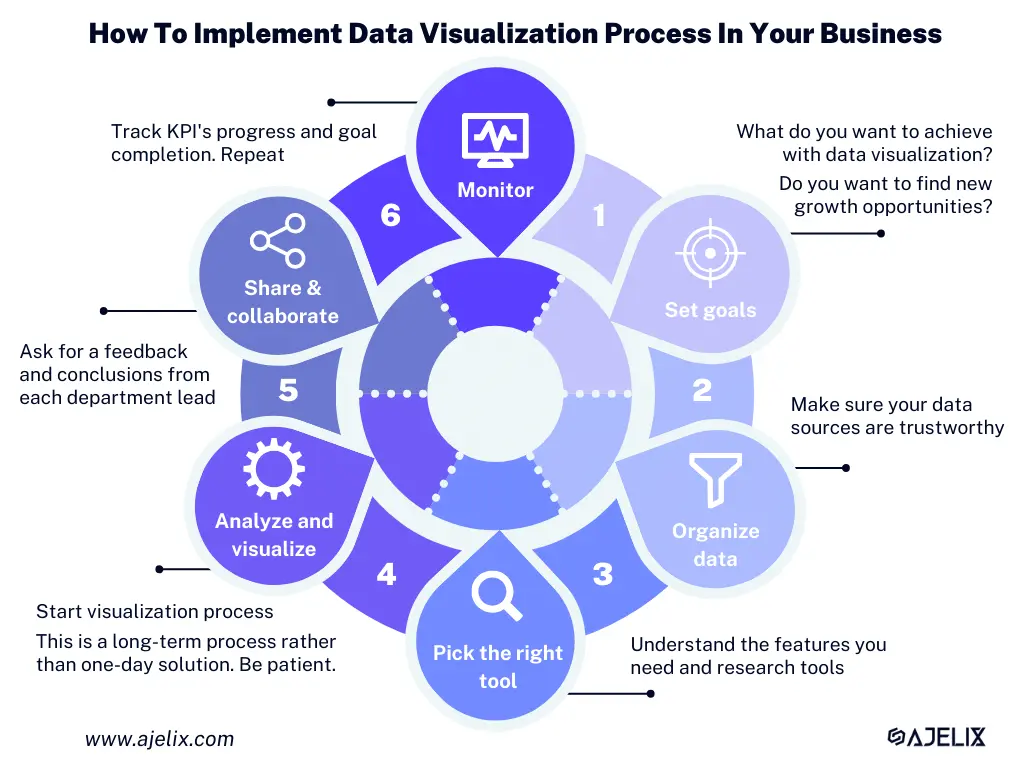
Time needed: 2 days
6 steps every small business owner should do to implement data visualization
- Identify goals and objectives
What do you want to achieve with data visualization? Do you want to find new growth opportunities? Optimize your processes of cut costs? Define your goals and the whole process will become crystal clean.
- Organize your data
Once you have the objectives you can understand what data you need. Organize it and clean it. Make sure your data sources are trustworthy as the quality of decisions will depend on the data.
- Pick the data visualization tool
Once you’ve defined the goals it will become easier to understand what kind of tool do you need. Understand the features and budget you can spare for this position. We will discuss this topic later in the article along with best data visualization tools in the market.
- Analyze and visualize data
Once you’ve defined everything we mentioned above you can start analyzing. Develop visualization process and start analyzing. Remember that it can take some time once you adapt to the platform and get insights. This is a long-term process rather than one-day solution. So be patient.
- Share and collaborate
Once you have visualizations it’s important to share it with your team to understand the data results in depth. Ask for a feedback and conclusions from each department lead. Together you should define if the results are good/bad and what can you do to improve. Set KPI’s for each function and follow-up.
- Track the results
Once you’ve your business data dashboard it’s important to follow-up on the data regularly involving all the stakeholders. Track KPI’s progress and goal completion. Create your own follow-up schedule that all team members understand.
Related Article: Top 10 Best Business Intelligence Tools Comparison
What Are the Common Challenges in Implementing Data Visualization?
1. Limited Resources
Small businesses often face resource constraints, both in terms of finances and skilled personnel. Implementing data visualization tools may seem daunting, but strategic choices and targeted investments can overcome these challenges.
Note: Setting your ideal budget and understanding the final costs is critical for successful data analytics process implementation.
2. Lack of Data Literacy
The successful implementation of data visualization requires a certain level of data literacy within the organization. Small businesses need to invest in training and educational resources to ensure their teams can effectively interpret and utilize visualized data. Investing in comprehensive ERG software solutions can streamline this process by offering built-in training modules and intuitive interfaces.
Note: Understand who are the main users and their skill set. That will help you define the ideal tool. If you’ve have a low data literacy level pick self-service tool that is created for non-technical users.
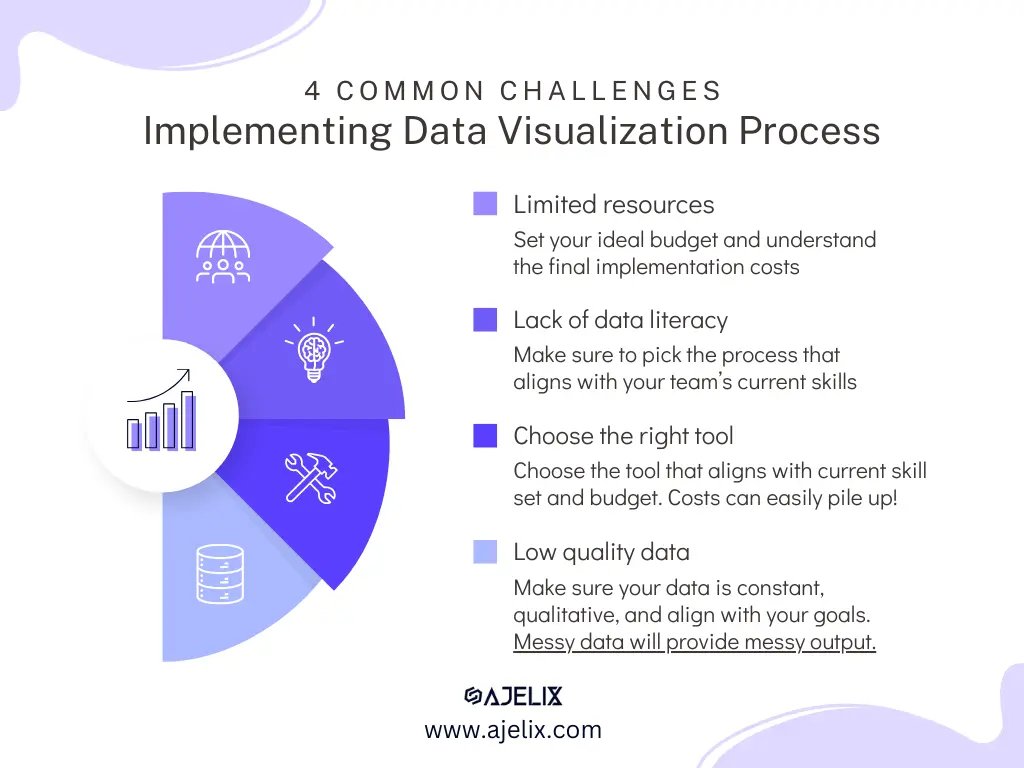
4 common challenges in data visualization process, infographic made by author
3. Choosing the Right Tools
The market is flooded with data visualization tools, and selecting the right one for a small business can be overwhelming. Careful consideration of business needs, scalability, and user-friendliness is crucial in making an informed decision.
Note: Be careful when you choose this software, make sure that you can setup the platform yourself. As most of the platforms have complex setups, requires IT and coding skills. So make sure you pick the tool that aligns with your strategy, costs and ease of use requirements. It’s easy to pile up big costs…
4. Low Quality Data
If your business data is messy than your visualizations will be messy and won’t provide good insights. Make sure you have constant data streams that are relevant, qualitative and align with your goals.
How To Choose the Right Data Visualization Tool?
Consider 4 questions before you choose the right tool:
- Purpose: What do you want to achieve with data visualization? Are you looking to identify trends, make better decisions, or communicate your findings to others? Different data visualization tools are better suited for different purposes.
- Data: What kind of data do you have? How much data do you have? Different data visualization tools can handle different types and sizes of data.
- Skill level: What is your technical skill level? Some data visualization tools are more user-friendly than others.
- Budget: How much are you willing to spend on a data visualization tool? There are a variety of data visualization tools available, both free and paid.
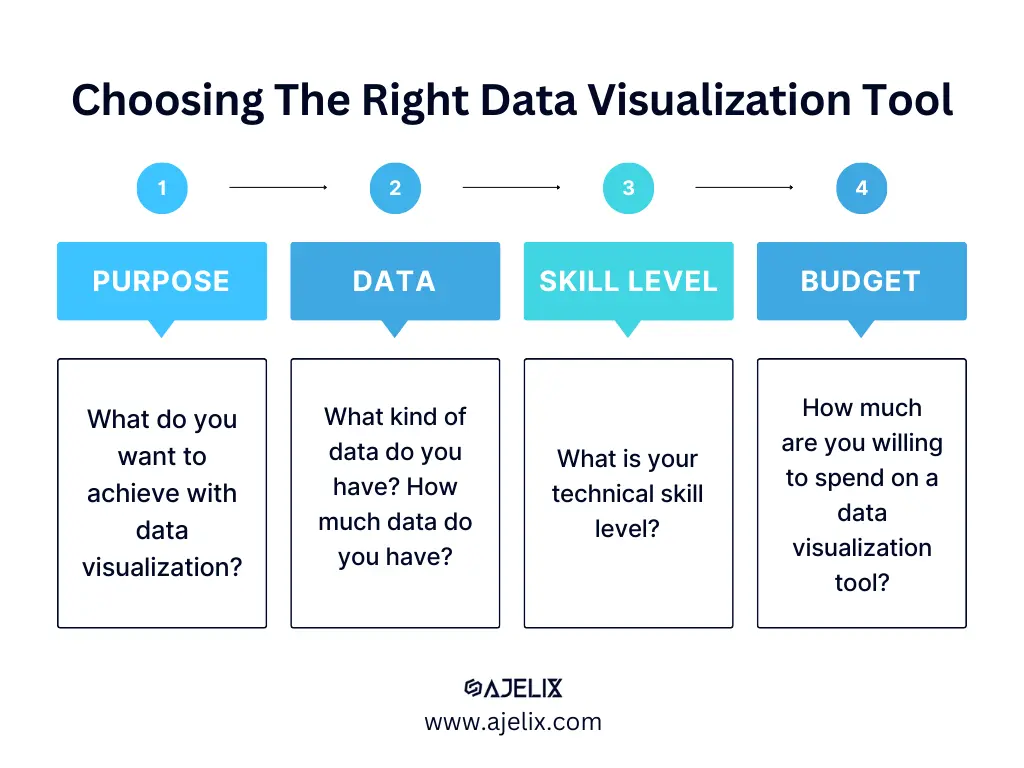
4 things to consider when choosing the data visualization tool, infographic made by author
popular data visualization tools for small businesses:
How Ajelix BI can help with data visualization?
While there are many great data visualization tools available, Ajelix BI stands out for its ease of use, powerful features, and affordable pricing. This platform is designed specifically for businesses of all sizes, so you don’t need to be a data expert to use it.
This tool lets you easily connect your data sources, create stunning visualizations, and share your insights with others.
- Create stunning visualizations: customize your visualizations to match your brand and your message.
- Analyze your data with ease: you can filter, sort, and group your data with ease.
- AI insights and chart builder: create your reports using AI for more efficient workflow
- Share your insights with others: share reports with others using links, passwords or emails.
Reporting gives you a headache?
Upload your data and create professional reports with agentic AI

Start free
Try free and upgrade whenever
Conclusion
Data visualization is not just a technological trend; it’s a transformative tool that empowers small businesses to unlock the full potential of their data. From improved decision-making to fostering a data-driven culture, the benefits are vast and tangible.
In conclusion, the journey of data visualization may seem intricate, but the rewards for small businesses are substantial. Embracing this transformative tool positions businesses to thrive in an era where data reigns supreme, providing a competitive edge and paving the way for sustained success.
FAQ’s
Data visualization is a process that turns raw data tables into actionable charts and graphs to help businesses identify patterns and make informed decisions.
– Improved decisions-making
– Cost saving
– Effective communication
Ready to start data visualization journey with Ajelix?
From data to report in one minute or less with Ajelix AI Agent


