6 Best Zoho Analytics Alternatives & Competitors 2026

Just like any other platform, Zoho Analytics has many advantages and disadvantages. This software is well known for its powerful features and team plans. The Zoho BI solution offers professional-looking visualizations and analytics.
In this article, we will take a look at the best Zoho Analytics alternatives that are available in the market.
6 Best Zoho Analytics Alternatives
Change the way you work with agentic AI
One-click dashboards,KPI tracking, and AI-powered insights—for work that actually gets done.

Zoho Analytics Overview
Zoho Analytics empowers businesses to seamlessly connect, prepare, analyze, and collaborate on data within a unified platform. With their business intelligence (BI) platform, you can effortlessly generate reports without the need for IT assistance.
Feature Overview
- Choose to integrate data from various sources and well-known business applications.
- Prepare and cleanse data prior to creating reports.
- Utilize artificial intelligence for data analytics.
- Collaborate and easily share reports with others.
- Embed analytics into your applications using no-code solutions.
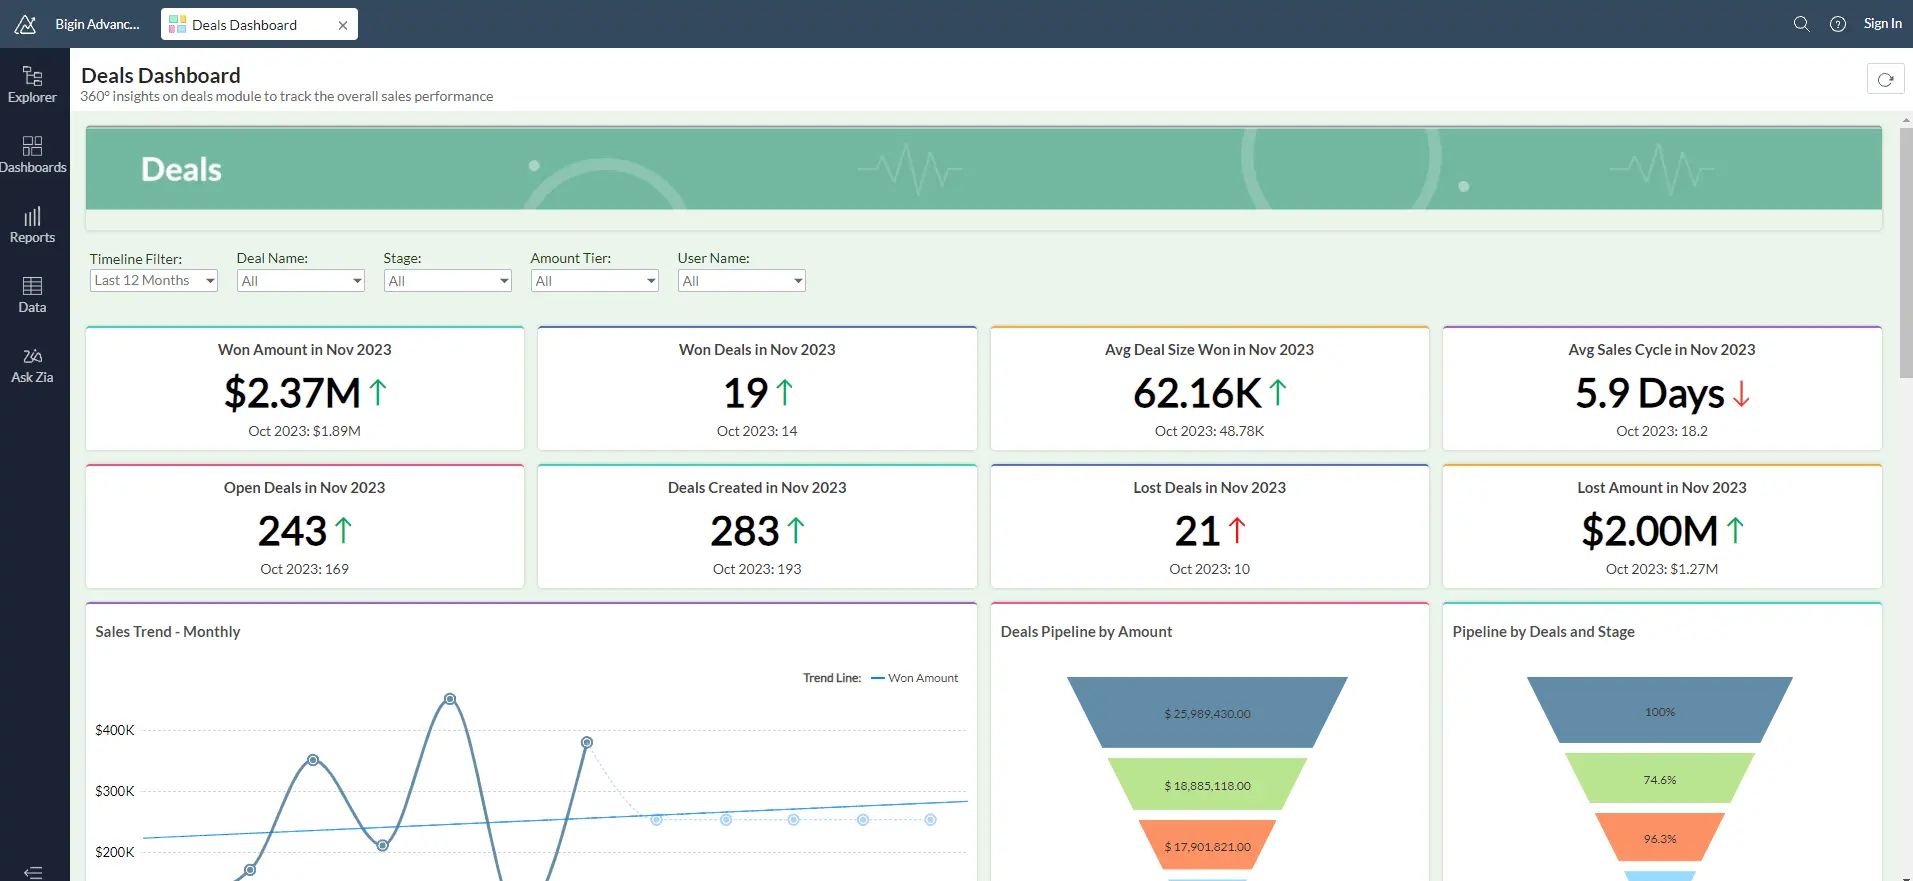
Zoho dashboard screenshot
Users:
- Teams without technical expertise.
- Individuals lacking proficiency in data analytics.
- Small and medium-sized enterprises.
- Analysts proficient in SQL.
Limitations & cons
- Certain customers express the need for additional videos and resources to enhance the onboarding process.
- While it can incur costs, it remains relatively accessible when compared to previous BI tools.
- There is still a significant learning curve associated with the platform.
- The user experience lacks sufficient intuitiveness, and certain reports may require the assistance of an IT specialist.
- Embedded charts may experience delays in loading.
- To fully leverage this platform, there is still a requirement to acquire proficiency in SQL.
Pricing
Zoho’s pricing structure is divided into two segments: Cloud and On-Premise. The On-Premise plan, which consists of four different plans, is more expensive.
- The Basic plan is 30€ per month and includes 2 users and a capacity of 0.5 million rows.
- The Standard plan is 60€ per month and provides 5 users and a limit of 1 million rows.
- For the Premium plan, priced at 145€ per month, users can benefit from 15 user accounts and an allowance of 5 million rows.
- The Enterprise plan, which costs 575€ per month, offers extensive features with 50 user accounts and a capacity of 50 million rows.
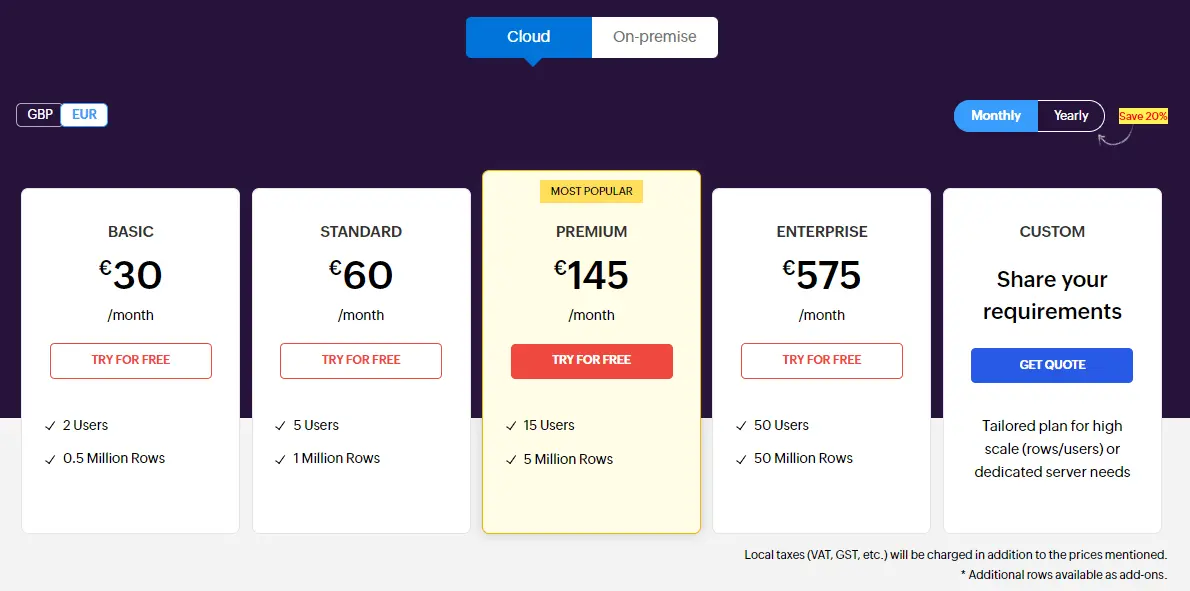
Zoho analytics pricing screenshot from https://www.zoho.com/analytics/pricing.html
Top 6 Zoho Analytics Competitors & Alternatives
Let’s take a look at the Zoho Analytics alternatives.
1. Ajelix
Ajelix stands out from the typical business intelligence tools found in the market. Designed for an effortless user experience, this tool is crafted to facilitate swift and trouble-free report creation for everyone. Using a no-code editor, you can construct reports within minutes.
One of the significant benefits of this platform is its user-friendly nature, eliminating the need for complex setups or training sessions.
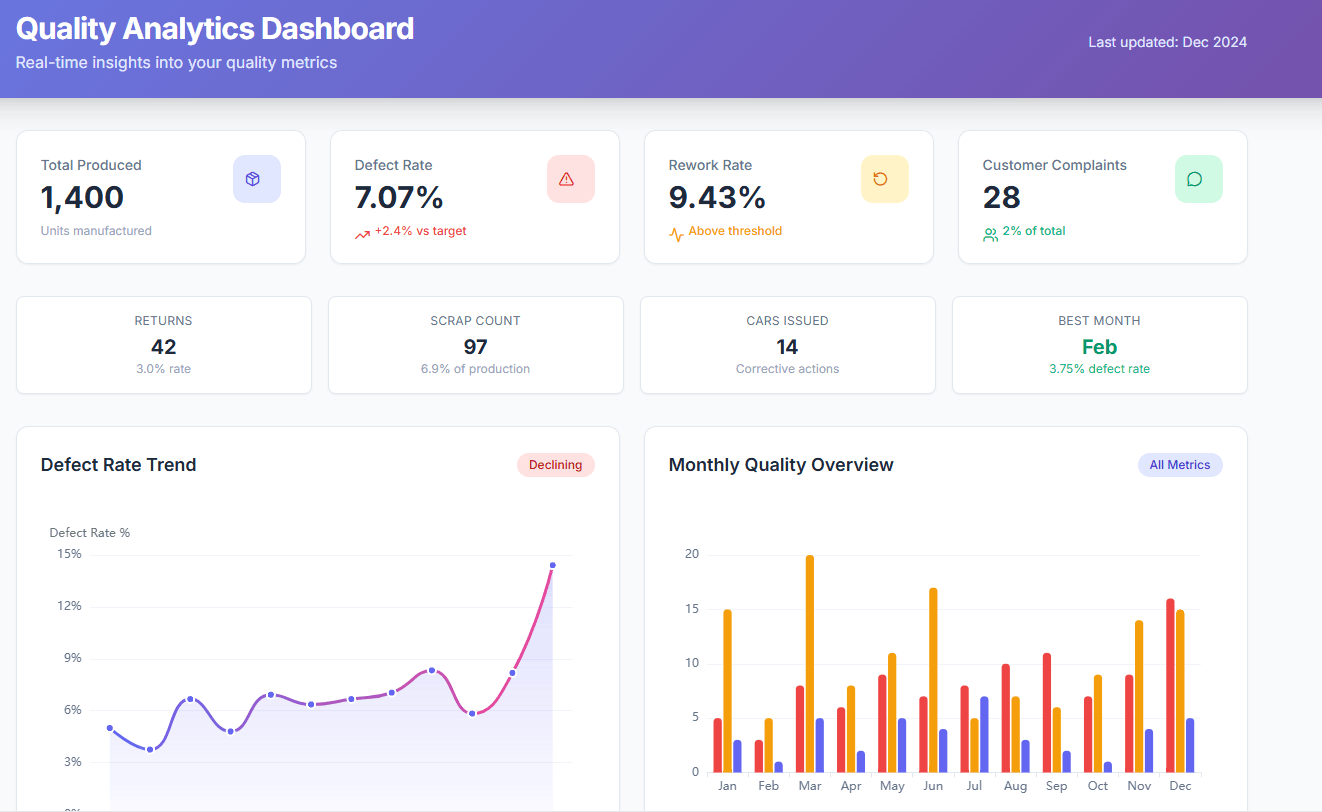
Ajelix quality analytics dashboard example.
Features
- Easy AI agent – describe what you need, get working assets instantly.
- No training required. Sign up and start creating immediately.
- Conversational AI for instant insights and visualizations.
- Import from Google Sheets, Excel, PDFs, CSVs, presentations and documents.
- AI dashboards in seconds. Upload up to 1GB, no manual formatting.
- Auto-clean data and calculate KPIs from any file.
- Share dashboards and apps with one-click links.
- Persistent workspace remembers your files across chats.
- AI explains trends and delivers actionable recommendations.
- Create dashboards, Excel files, presentations, and web apps in one click.
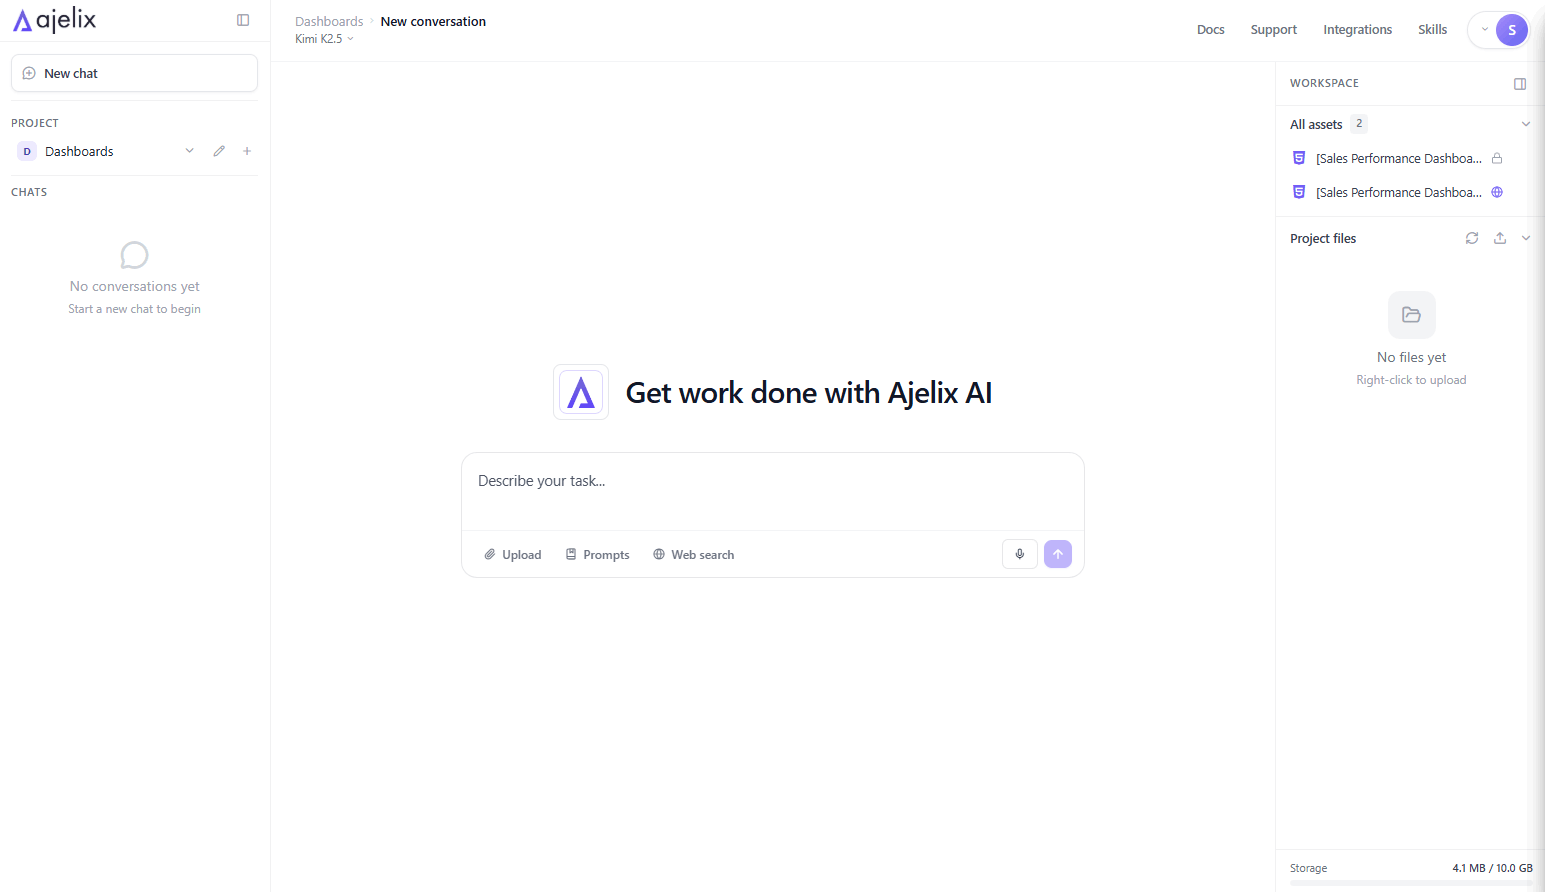
Ajelix chat interface.
Users
- Individuals and solo entrepreneurs requiring rapid data-driven decision-making.
- Small to medium-sized businesses.
- Teams without technical expertise.
- Excel users seeking more efficient report creation.
Pricing
The pricing for the Ajelix data visualization platform is clear and simple:
- You can test it for free before committing.
- The Lite plan is $39/month for individuals who need more power – 20MB files, 500MB workspace, and asset creation.
- The Pro plan at $99/month unlocks the full experience with best-in-class models, 100MB files, 2GB workspace, and extended usage.
- The Max plan at $199/month is built for heavy workloads – 500MB files, 10GB workspace, and 2x the processing power.
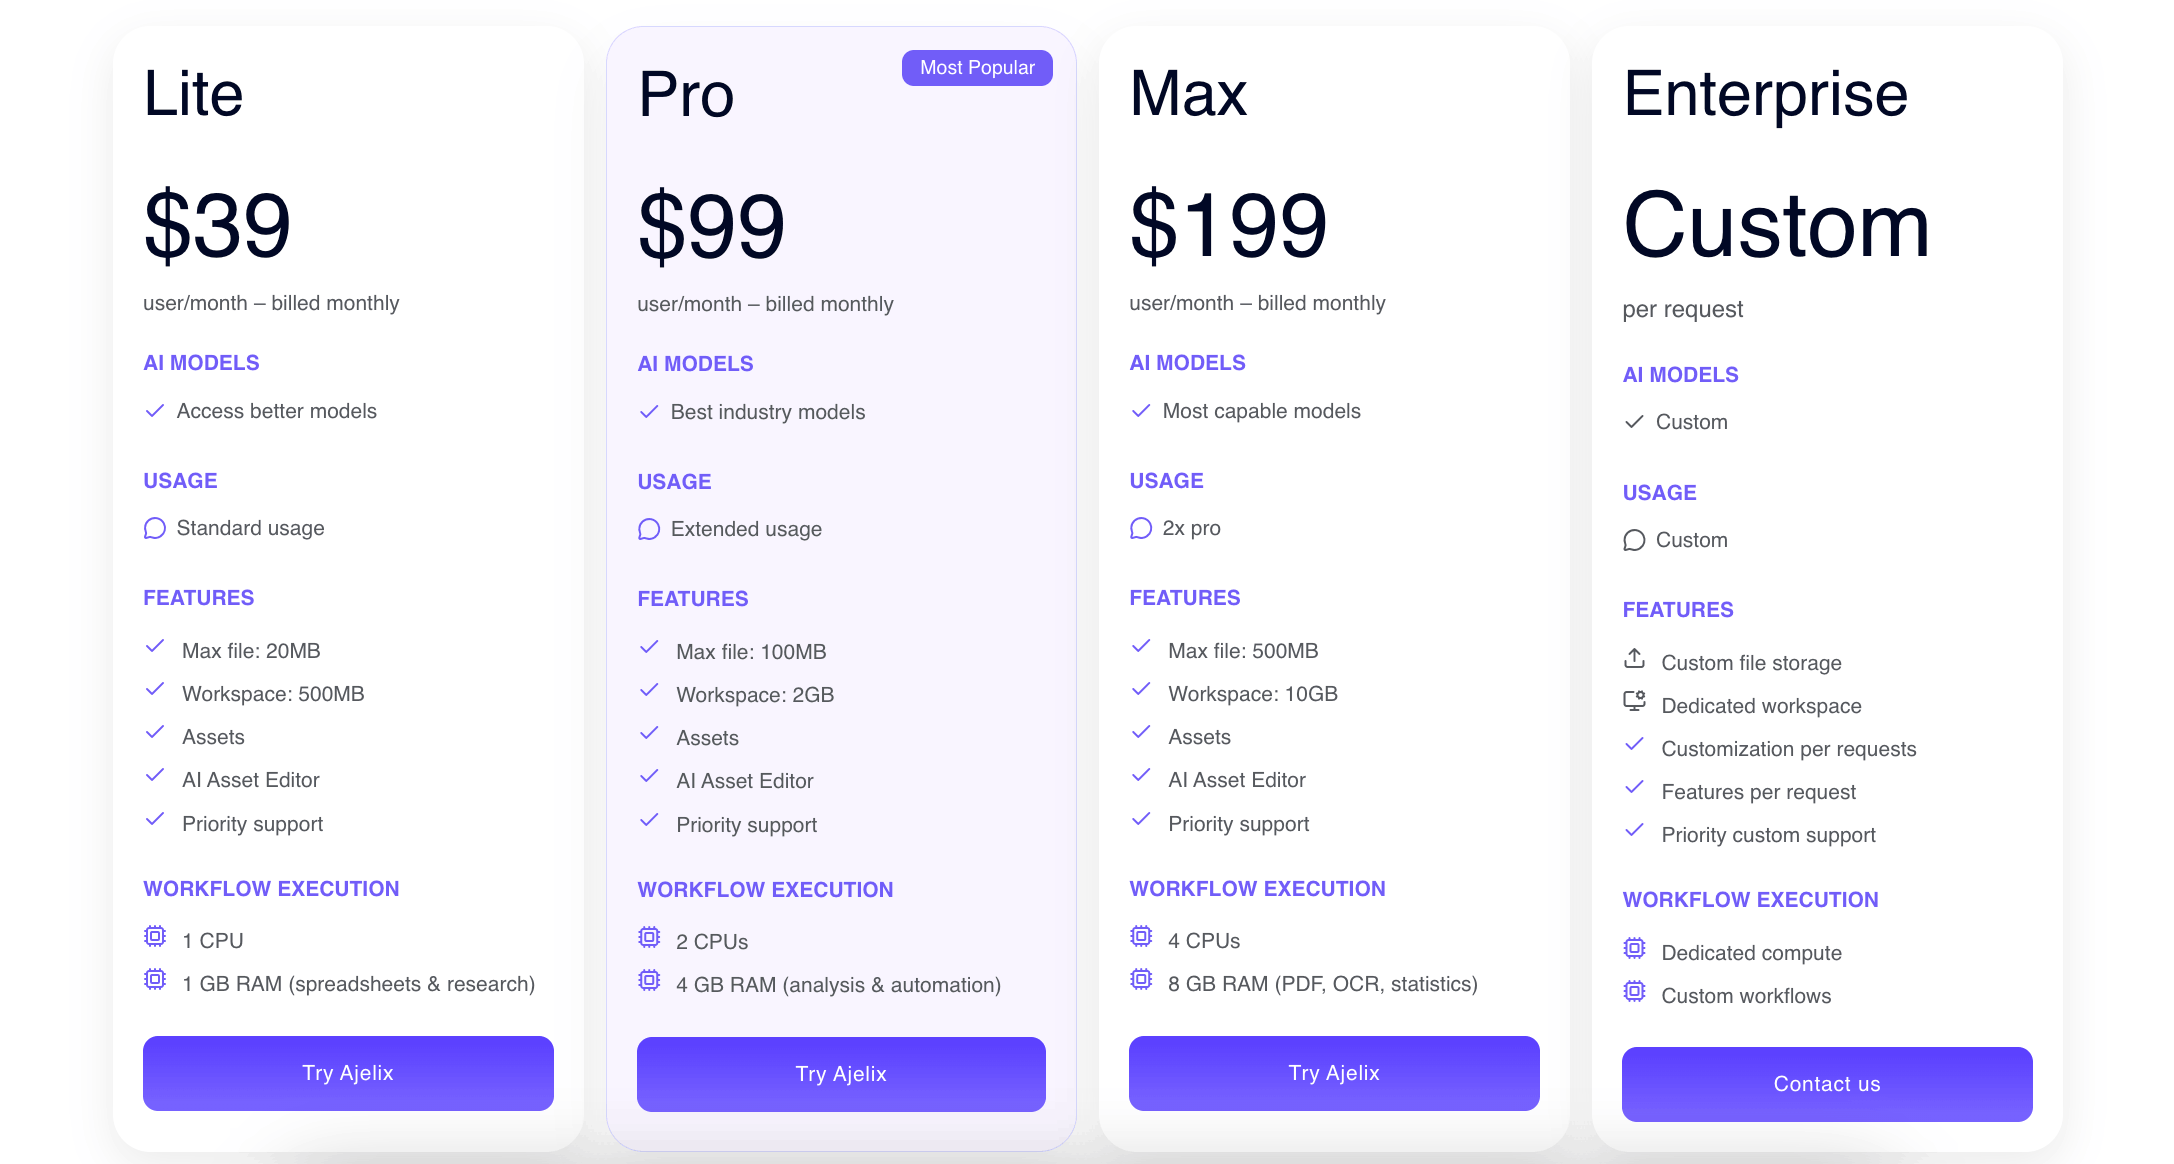
Ajelix pricing plan
By selecting the Ajelix team, you’re endorsing individual developers dedicated to crafting impactful tools that enhance business effectiveness. With consistent updates and immediate support, you’ll derive greater long-term value.
Reporting gives you a headache?
Upload your data and create professional reports with agentic AI

Start free
Try free and upgrade whenever
2. Datapad
The Dataset is a tool designed to foster a data-driven culture within small organizations and non-technical teams. Its user-friendly interface is crafted to enable even individuals with minimal technical expertise, making it accessible to various users.
Let’s explore the advantages and constraints that this tool presents.
Features and Benefits
- No coding or intricate setups are required.
- Access this through multiple pre-built integrations and data sources.
- Choose from over a hundred pre-built KPI templates.
- Share reports with others using public links.
- Collaborate and add comments to data with colleagues.
- Enjoy automated reports and scheduled reporting emails.
- Utilize mobile applications.

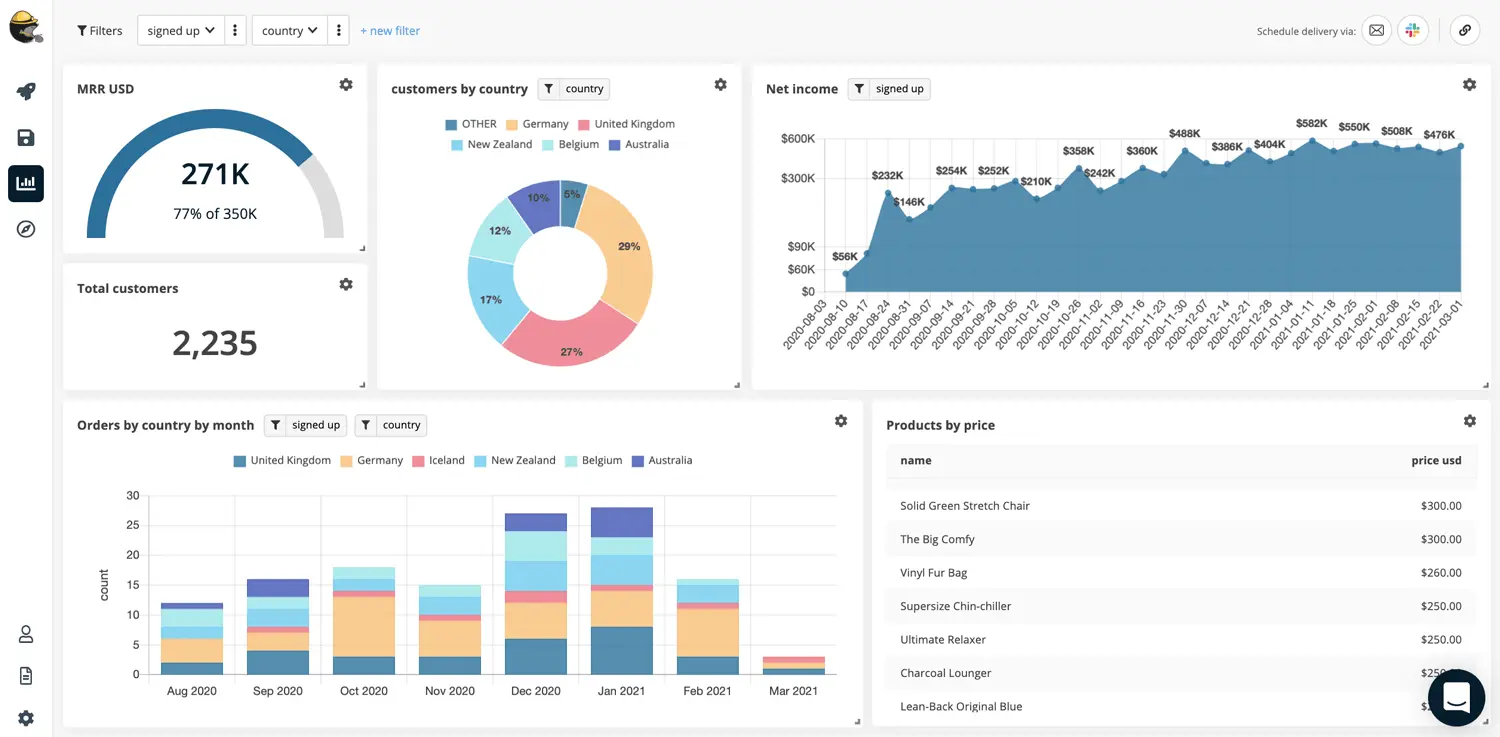
Datapad report dashboard screenshot from https://www.datapad.io/
Ideal Users
- Solo entrepreneurs and individuals who need a few visualizations
- Organizations with a small amount of data
Datapad limitations & cons
- A straightforward tool with limited customization options.
- A modest number of data sources.
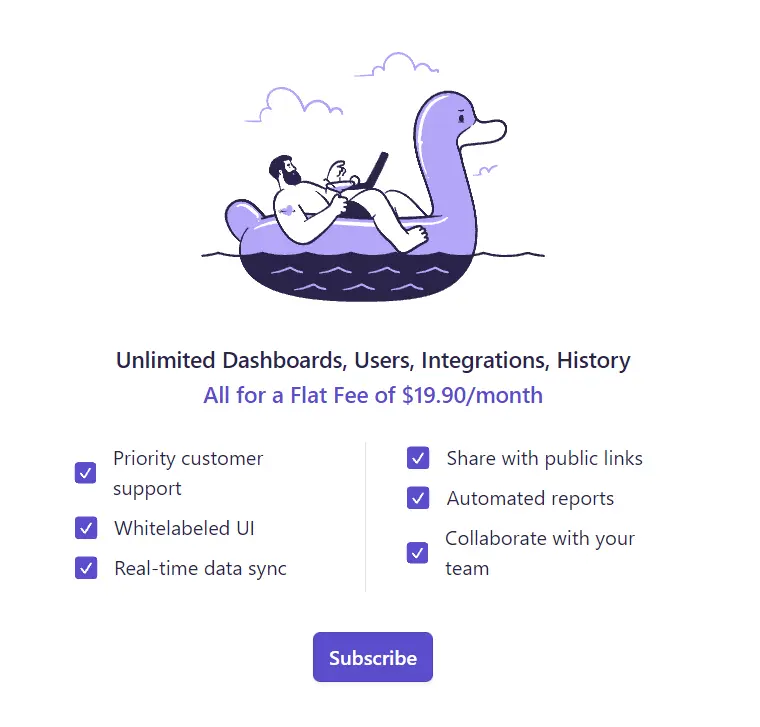
Pricing plan
Datapad offers a free trial and a single pricing plan, making it straightforward—unlimited features for just $19.90 per month.
Related Article: The Top 7 Power BI Alternatives For Data Visualization
3. Trevor
Quick setup, no requirement for SQL knowledge, and no-code embedded dashboards to empower your non-technical teams. Trevor is a BI platform designed to relieve your engineers. Let’s explore the features and benefits of this tool.
Benefits and Features
- The BI platform caters to non-technical teams unfamiliar with SQL.
- Creation of dashboards and visualization of data.
- Option to set up data alerts.
- A self-service platform equipped with a no-code editor.
- No-code embedded dashboards designed for applications.
- Quick setup.
- Various workflows with the capability to transmit data to other applications.
- Access to data sources from different applications.
Users
- Teams without technical expertise.
- Small organizations with just a single data source.
Trevor Limitations & Cons
- Manual data uploads via files are not supported; you can only connect with databases.
- The options for data sources are restricted, and combining different databases is not possible.
- Editing options are limited, making it challenging to align or resize elements uniformly. Visuals are also quite constrained.
- There is limited information available about the company.
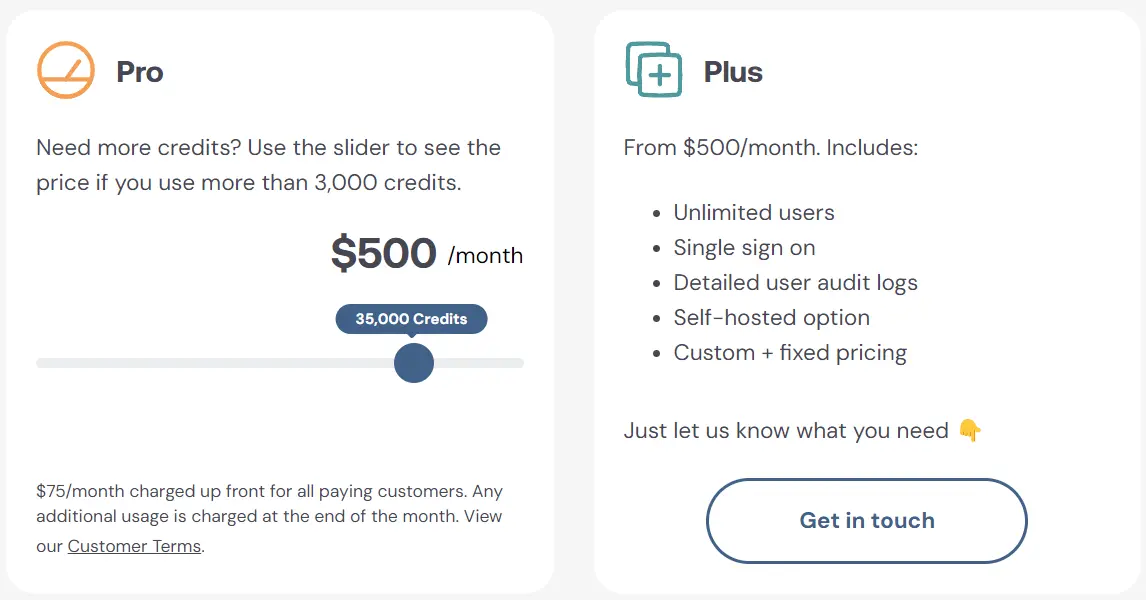
Pricing
Trevor’s pricing is separated into three sections:
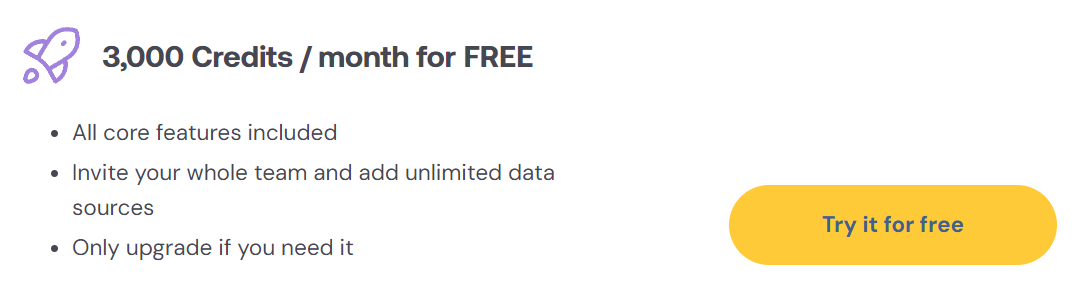
1. Free plan offering 3000 credits per month, encompassing all fundamental features.
2. The Pro plan is priced at $75 per month, providing 5000 credits. You should consider upgrading this plan when additional credits are required. Opting for this plan allows you to acquire extra credits, and at the end of the month, you’ll be billed for any credits used beyond the allotted amount. The more credits you require, the more advantageous this plan becomes.
3. The Plus plan is priced at $500 per month and encompasses unlimited users, single sign-on, a self-hosted option, and custom pricing.
Related Article: 8 Best Business Intelligence (BI) Tools For Small Businesses
4. Datapine
Another BI platform utilized for data analytics. This platform demands a profound understanding of analytics and often necessitates IT assistance. Nevertheless, it is also viable to generate basic charts from your data.
Datapine pros
- Reports with interactive features
- Dashboards tailored to your preferences
- Multilingual dashboard capability
- Collaboration features for enhanced teamwork
- Intuitive and user-friendly interface
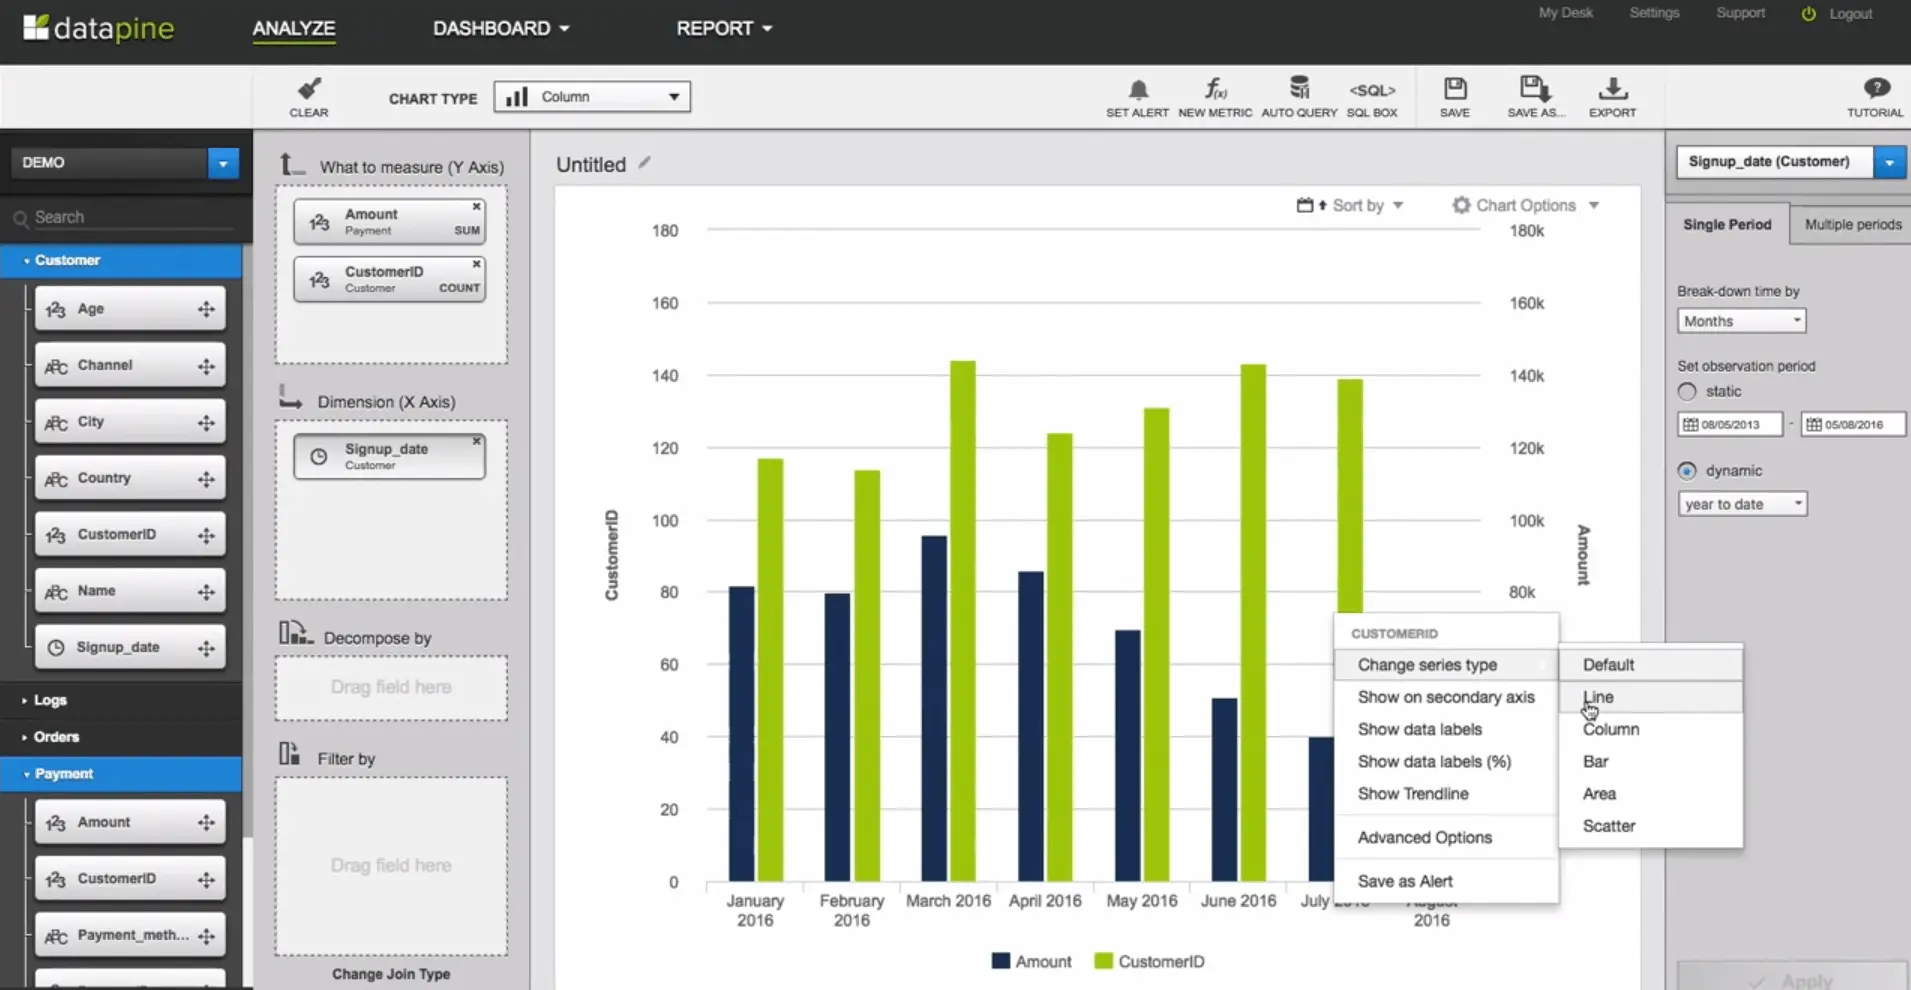
Datapine editor screenshot from https://www.youtube.com/watch?v=S4oauiFoUYI&ab_channel=datapine
Cons
- Incomplete documentation and absence of video guides
- Limited functionality and incompatibility in the mobile dashboard design
- Short duration of the free trial with no freemium option
- Necessitates assistance from an IT specialist and analytics for setup
- Some functionalities may require proficiency in SQL
Related Article: 5 Free And Budget Friendly Data Visualization Tools
5. Databox
The Databox platform provides comparable functionality to other tools. It is user-friendly, offers automated reporting, and provides the capability to create data dashboards.
Additionally, they provide numerous integrations and data sources for your reports. However, some customers have raised concerns about occasional bugs, noting that the solution is relatively new and lacks certain integrations and customization options.
Nevertheless, the freemium and paid plans offer excellent value in comparison to their respective prices.
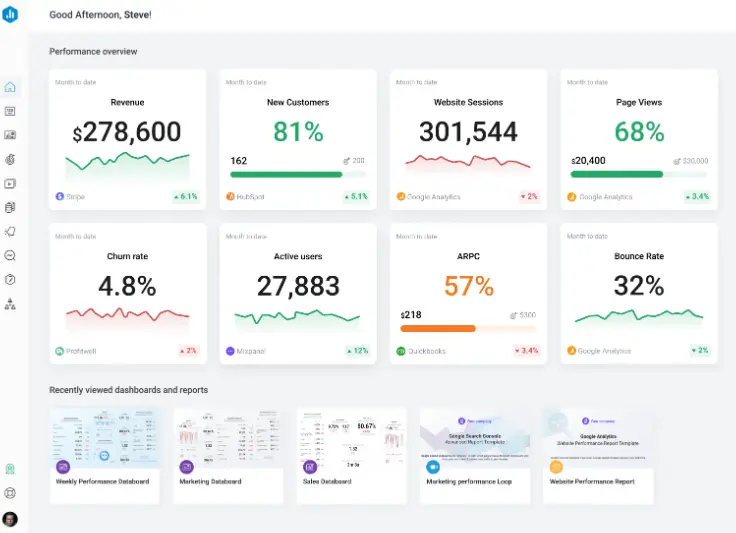
Databox Features (Paid & Free)
- Tracking metrics and business goals
- Access to over 100 data sources
- Collaboration capabilities with users and editors
- Numerous dashboard examples for facilitating visualization creation
- User-friendly data visualization features
Additional pricing plans can be found on the official Databax website. It’s worth noting that, in comparison to the tools mentioned above, this tool is among the more expensive options. Discover other databox alternatives further in this article.
Related Article: 7 Best Self-Service Business Intelligence (BI) Tools
6. Klipfolio
Klipfolio is a cloud-based application renowned for its impressive data visualization capabilities and a wide range of data connections. It excels in visualizing and monitoring key performance indicators (KPIs). The platform supports real-time data collection and sharing, allowing users to create visualizations seamlessly, whether from spreadsheets or SQL queries, with access to over 100 data sources.
What Are Klipfolio Features?
- Customize your individual metrics.
- Connect data from over 100 sources.
- Access pre-made data dashboards with live reporting.
- Generate your own data feeds using SQL, among other methods.
- Prepare your data prior to report creation.
- Leverage data visualization tools.
- Collaborate and easily share with others.
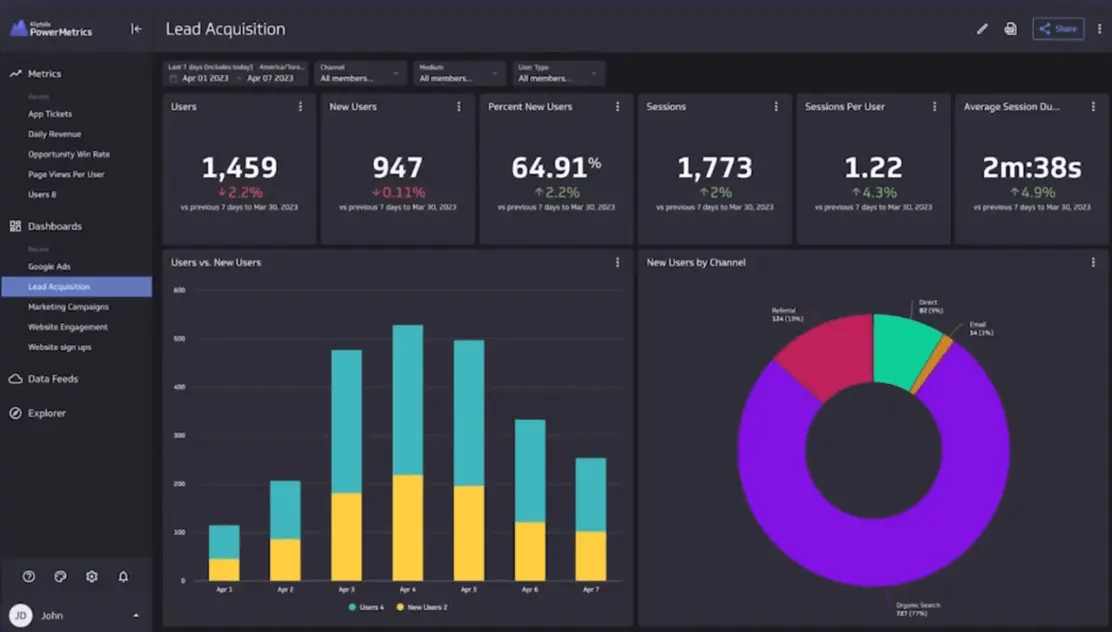
Klipfolio editor view screenshot from klipfolio
Users
- Ideal for small to medium-sized companies.
- Suitable for non-technical users.
- Well-suited for basic to intermediate data analytics.
What Are Klipfolio Limitations & Cons?
- Like other BI platforms, you may encounter delays and speed issues.
- It lacks user interactivity features, such as drag-and-drop functionality.
- The support/help documents are challenging to navigate and don’t always align with the actual product session.
- Creating a backend dashboard can be a complex process.
- Several users have highlighted that it can be overwhelming to create something beyond the pre-defined reports, as it requires prior knowledge and some technical skills.
- You may require the assistance of an IT professional to set up and renew API connections.
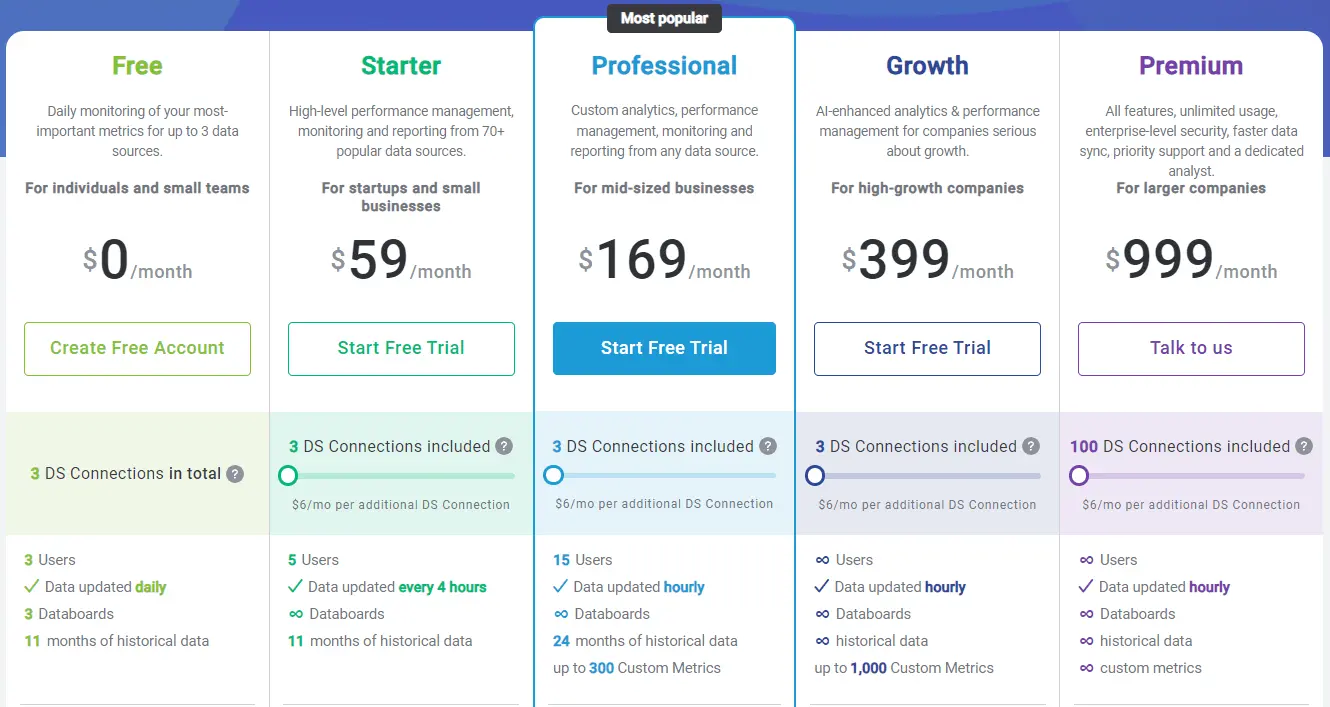
What Is The Pricing For Klipfolio?
Klipfolio provides 4 pricing plans: Free, Go, Pro, and Business.
- The free version has restrictions on user numbers, dashboards, and data sources, but it could be suitable for small businesses or those exploring its features. Additionally, there’s a 30-day trial for the Pro plan.
- The Pro version is available for $300 per month, providing flexibility to add more users, dashboards, datasets, and other features.
- The Business plan, priced at $800 per month, allows for flexible management of user count and datasets. Additionally, it incorporates a Custom service agreement and vendor assessment as supplementary features.
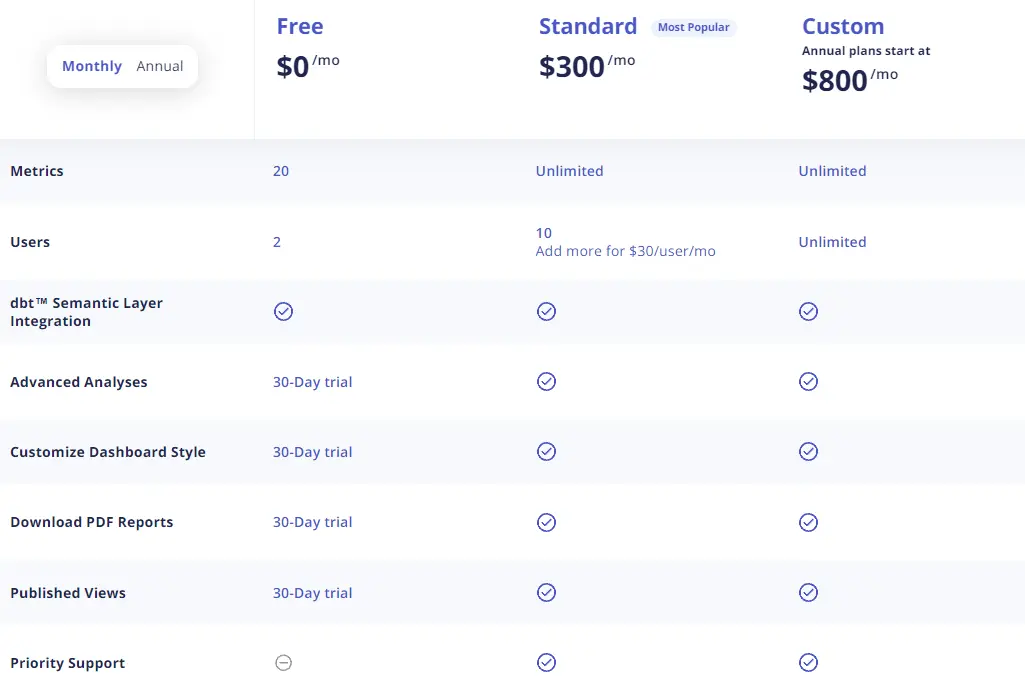
You can also customize the plan by adding an individual license 30$ a month for each user.
Related Article: 5 Tableau Alternatives To Explore Data
Summary
There are many alternatives to Zoho Analytics. Each software is attributed with functionalities to cater to different BI users. From advanced analytics to easy editing and visualization. Anyone who needs software needs to understand the benefits and cons behind the solution. There’s no one-size-fits-all.
FAQs
Ajelix, Trevor, Klipfolio, Datapine, Databox, and Datapad.
Yes, one of them is Ajelix, launched in 2023. This tool is developing quickly.
Ajelix and Trevor are the best alternatives for small businesses.
Ready to start creating reports with Ajelix?
From data to report in one minute or less with Ajelix AI Agents


