5 Tableau Alternatives For Your Team 2026

Tableau is the first business intelligence platform that strived for innovations and data analysis. The start of this tool dates back to 2003, bringing exciting solutions to businesses for almost two decades now. Although this platform is one of the leading analytics solutions, it’s also the most advanced one and requires learning the domain-specific language VizQL. That’s why many businesses are looking into Tableau alternatives that could help them do the same more easily.
Using specific language for report creation means that you need advanced analysts who specialize in this field. Additionally, they will be the only ones who can create and customize reports that can create a bottleneck in the company’s data analytics processes.
Change the way you work with agentic AI
One-click dashboards,KPI tracking, and AI-powered insights—for work that actually gets done.

Thankfully, the market is flooded with BI and data visualization platforms that outweigh the disadvantages of Tableau. We will review the top 5 best alternatives to help you explore data with AI in 2026 and guide you through choosing the right platform for your business needs.
5 Best Tableau Alternatives for 2026
Tableau Overview
Tableau’s balance of usability and scalability makes it a popular choice for organizations seeking powerful data visualization and analysis tools. It’s great for enterprise companies looking for the next level of data insights, as Tableau is one of the most advanced systems.
Tableau features
- You can use complex data flows, preparation, and cataloging to manage and connect data.
- Advanced AI & ML integration with Einstein Discovery.
- Intuitive drag and drop interface with desktop version.
- Embedded analytics.
- Data preparation before visualizations.
- You can choose where to store your data: server or cloud.
- Tableau offers a mobile version.
- You can perform complex analytics with large amounts of data without any issues.
- The platform is built to carry out difficult tasks without speed issues.
- Have a mobile-friendly version.
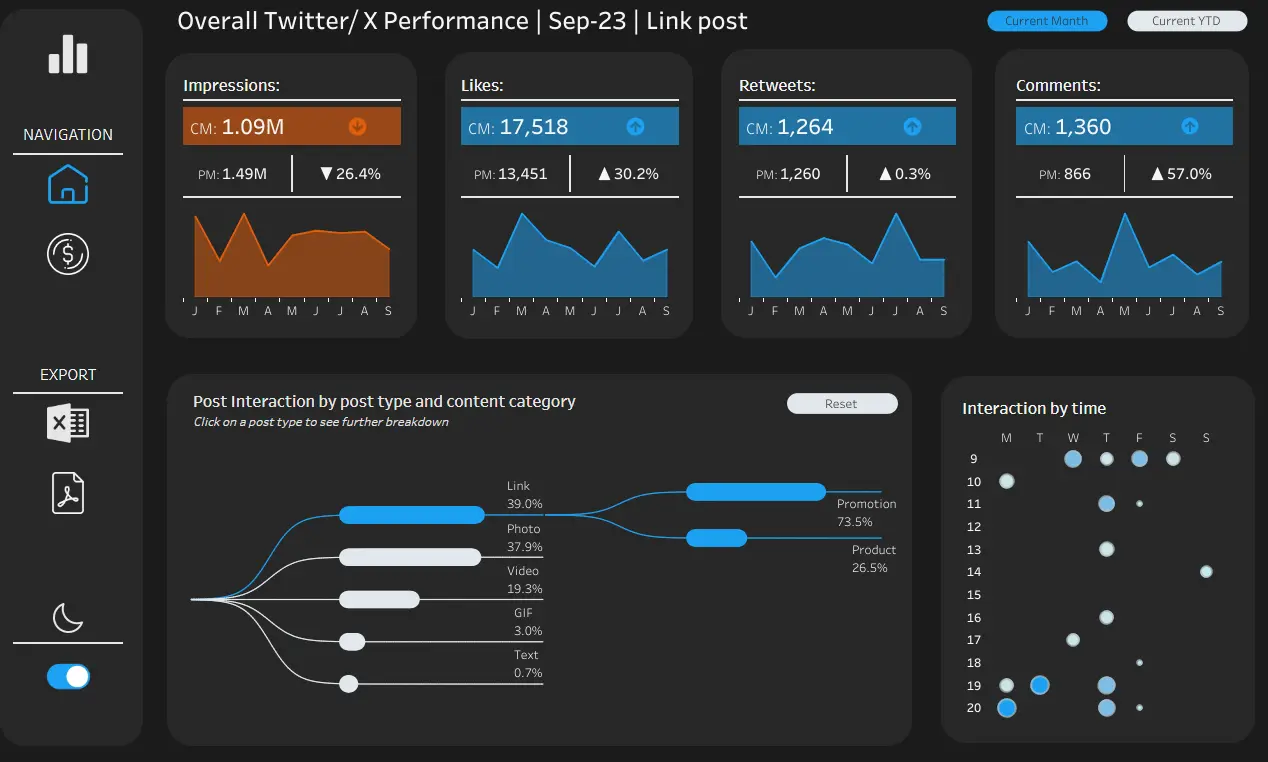
Tableau social media performance tracking dashboard from https://public.tableau.com/app/discover
Pricing
Tableau offers three pricing plans:
- Tableau Viewer which will cost you 15$ per user a month. This plan includes only the privilege to view the reports your analysts have created.
- Explorer will give you the possibility to edit existing reports and collaborate with other users on the platform.
- Creator at least one of the users from your company should have this license, as it lets you create the reports and share them. It will cost you 75$ a month per user.
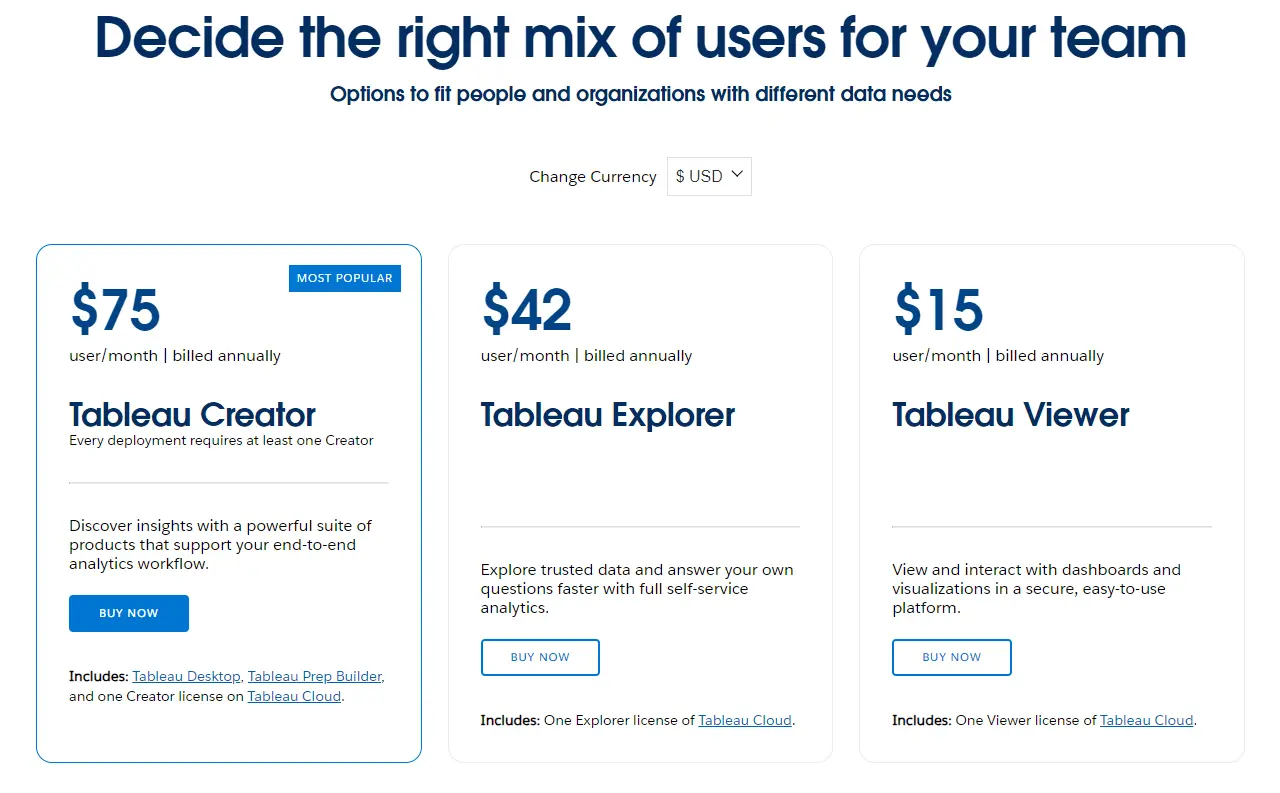
Tableau pricing screenshot from https://www.tableau.com/pricing/teams-orgs
It’s important to mention that all of the plans are billed annually. So if you decide to use this platform you have to pay in advance. The platform doesn’t have a freemium, however, you can get a free trial to understand if this solution is for you.
Tableau limitations & cons
- Tableau doesn’t offer automatic report refreshing, so manual effort is always necessary.
- The pricing plan is not flexible and is the most pricy solution out there with annual subscriptions.
- Requires SQL and/or VizQL knowledge, so it can get pricy to get an expert who can set up & maintain the reports.
- Limited visualization options: you can’t import custom visuals, unlike in other platforms.
- You have to format all visuals independently; there’s no option set the same style for all reports.
- Doesn’t have version control.
- Dashboards are not responsive, so you have to create a separate version for mobile and desktop.
- You need to manually approve any changes so they appear in the report.
Best For
- Advanced data analysts
- IT specialists
- Enterprises with large amounts of data
- Experts who work with complex data analytics
Related Article: Top 9 Data Visualization Trends
Top 5 Tableau Competitors & Alternatives
Tableau has a market share of 15.54% in the data visualization market. (Based on 6sence report) The 2020 Accenture report says that 74% of employees feel overwhelmed when working with data.
Tableau stands as a major contender in the market. Now, let’s explore ways to transform these statistics into a more favorable outcome by examining superior alternatives.
1. Ajelix
Ajelix is not your average business intelligence tool on the market. Built with a simple user experience in mind, it helps anyone create reports quickly and without the headache.
Build reports and dashboards with an AI Agent that gets you results in minutes. What makes this platform stand out is how easy it is to use – no complicated setup, no training needed.
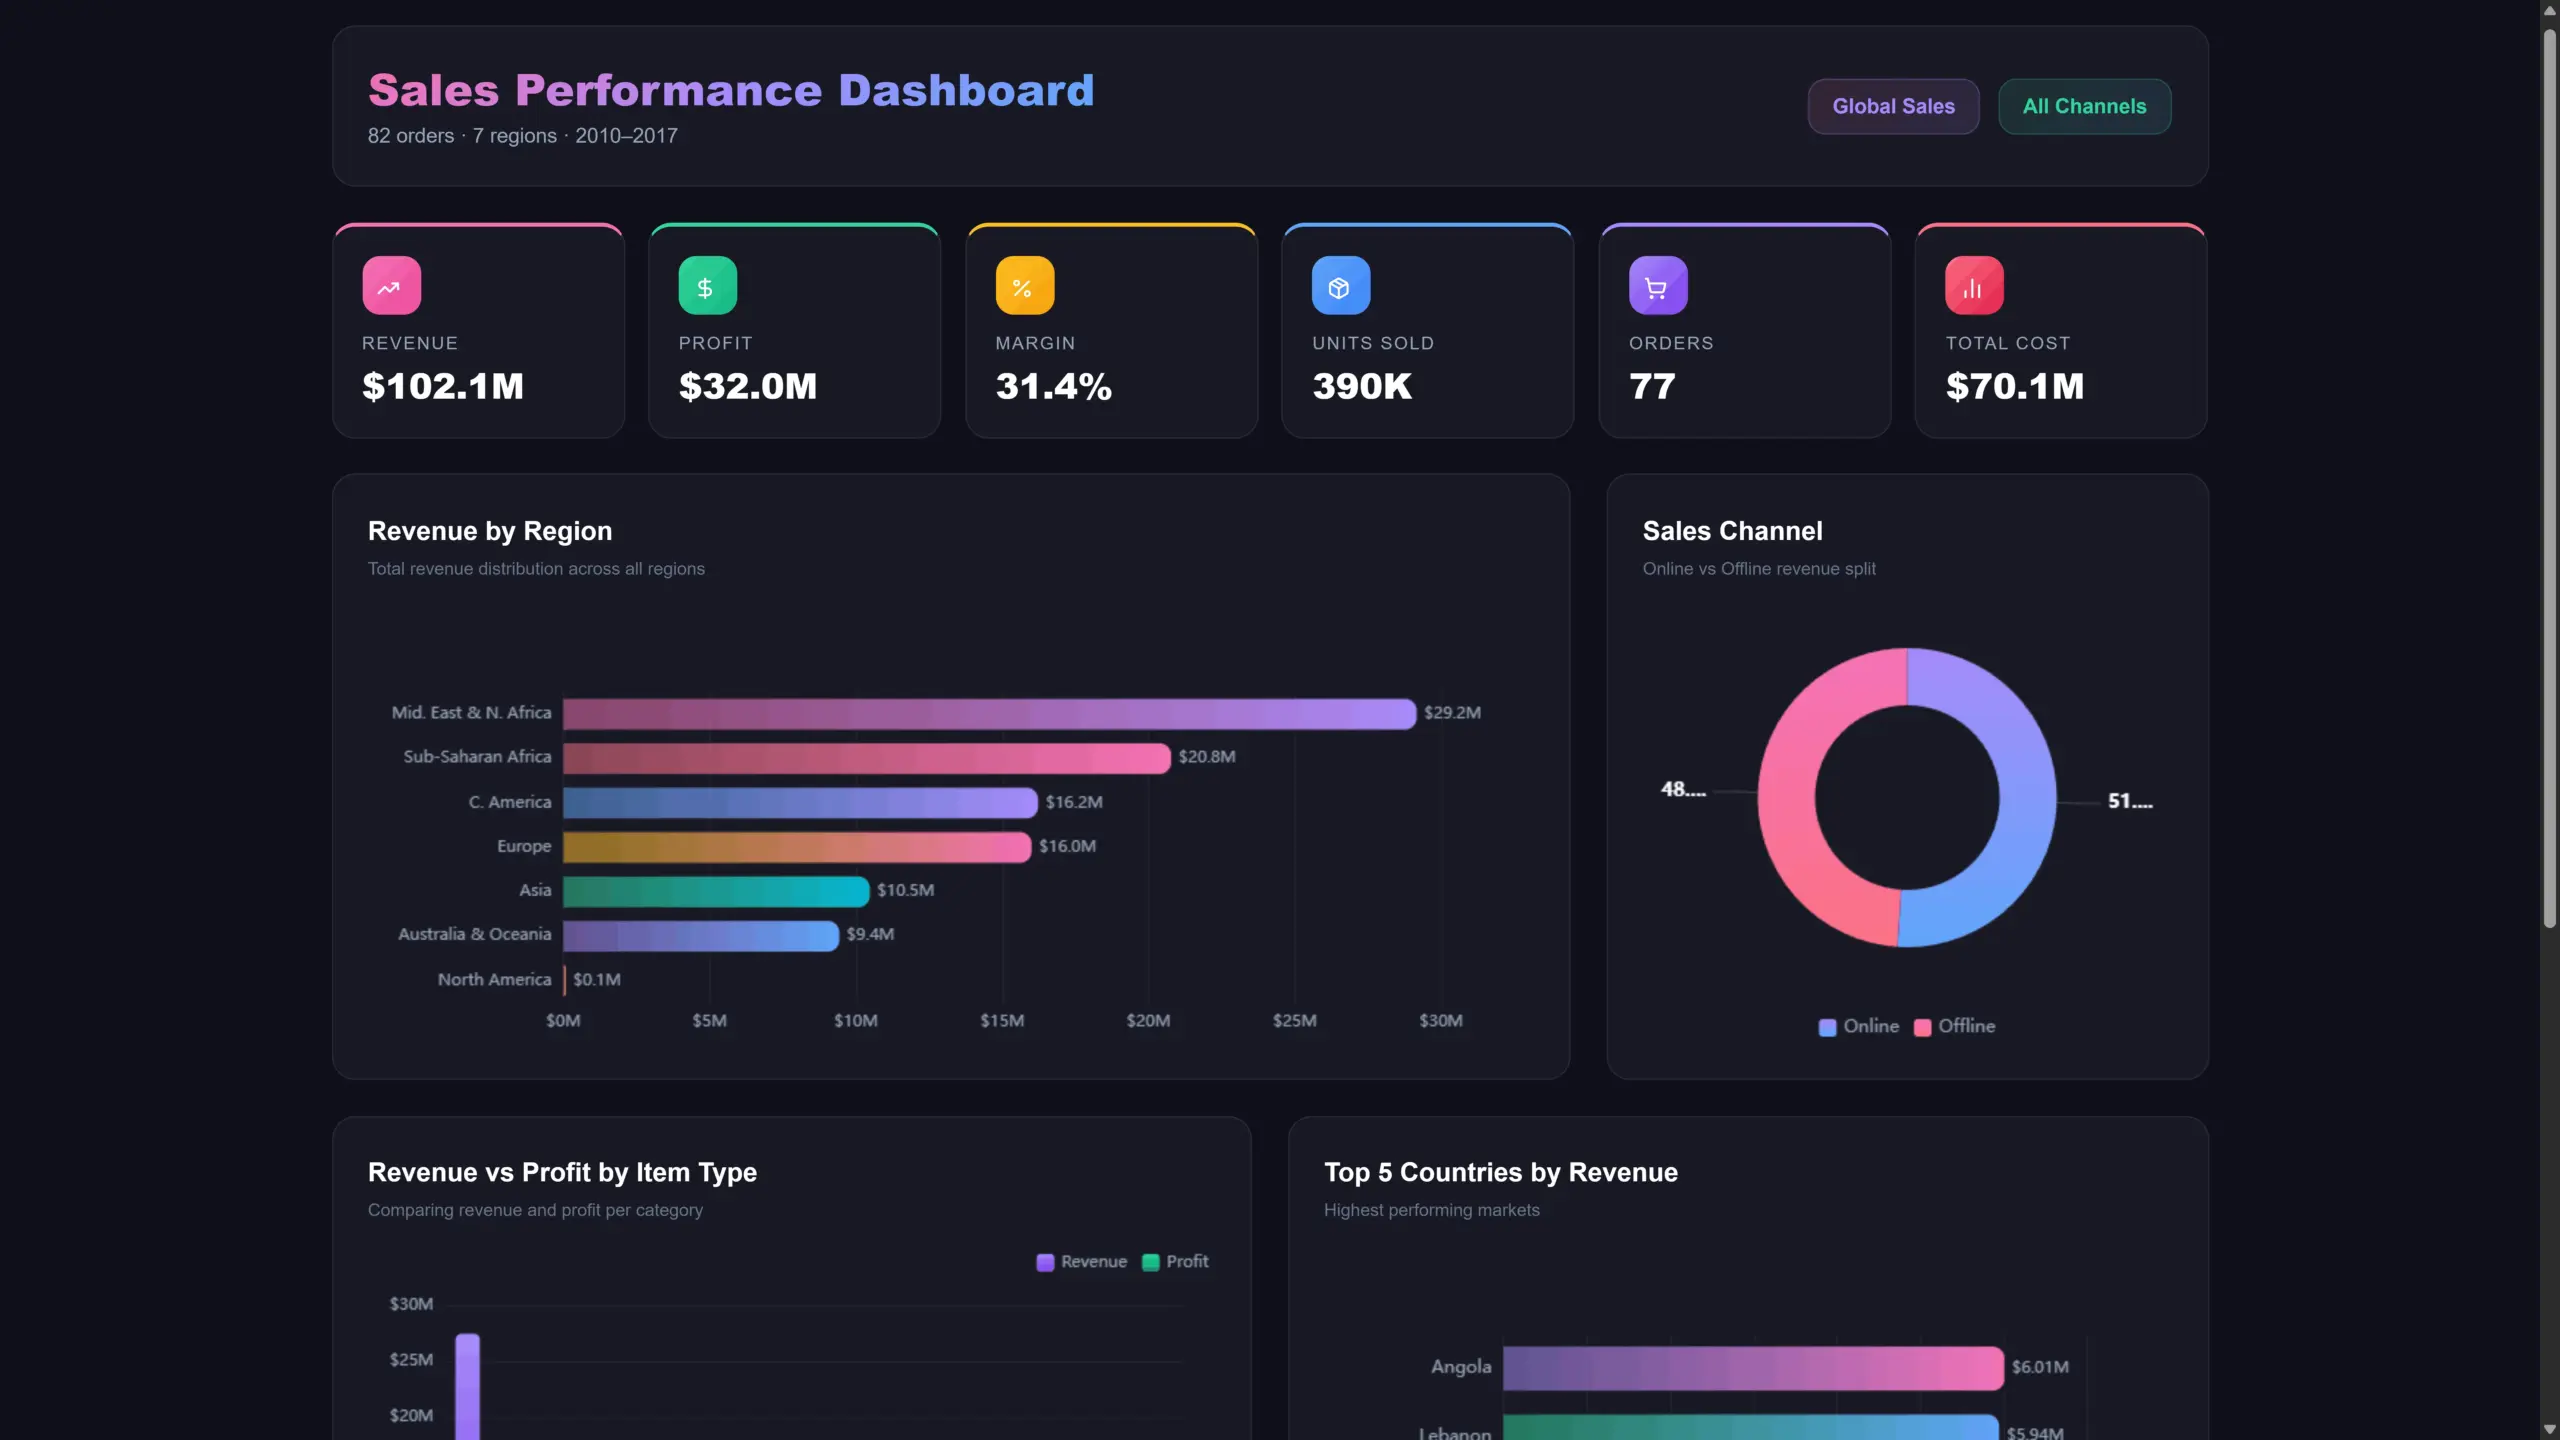
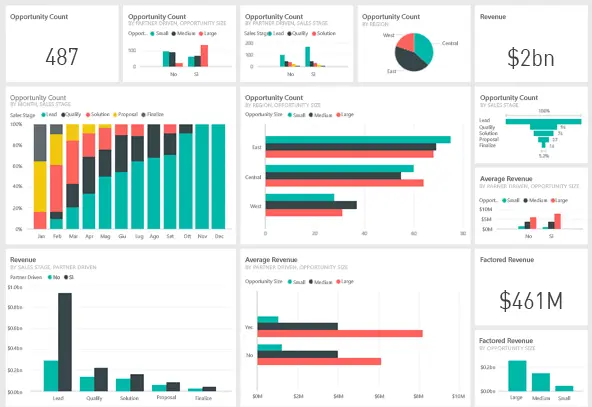
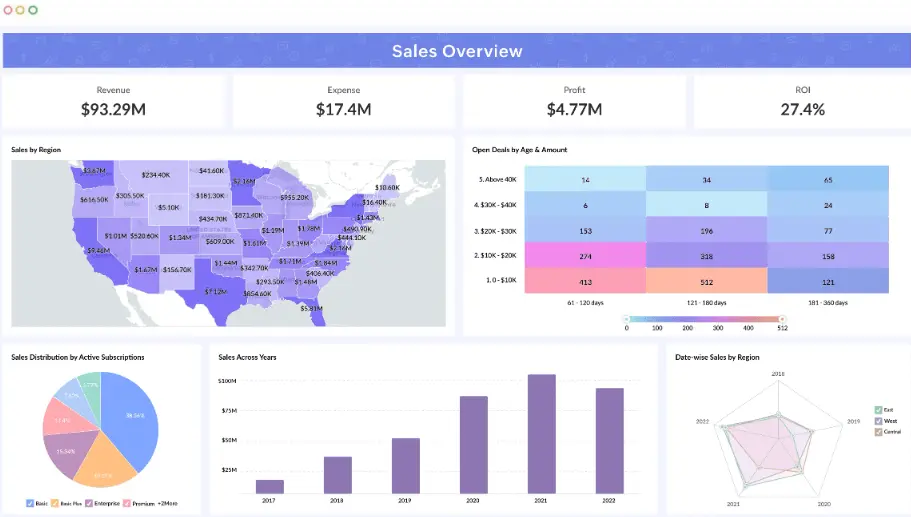
Ajelix sales preformance dashboard report example
Features and Benefits
- An easy-to-use AI Agent that builds working assets fast and intuitively. Just describe what you need and get production-ready deliverables in seconds.
- No training or complicated setups. Sign up and start building dashboards, reports, and apps right away – the platform is designed to get you going from day one.
- Conversational AI that lets you dig deep into your data using plain language. Ask questions and get instant insights, analysis, and visualizations without writing a single formula.
- Pull data from multiple sources into one report. Connect Google Sheets, Excel files, PDFs, CSVs, presentations, and documents all in one place.
- Turn raw data into leadership-ready dashboards in seconds. Upload files up to 1GB and let the AI handle the formatting, structure, and design for you.
- Automatic data preparation and KPI tracking. Clean up messy files, pull data from PDFs and images, and calculate key metrics – all without manual work.
- Share your work instantly with a single link. Dashboards, apps, and reports are embedded and ready for collaboration the moment you hit share.
- A persistent workspace that remembers everything. Your files, assets, and conversation history stay in place – no need to re-upload or re-explain anything.
- AI-powered insights that tell the story behind your numbers. Get automatic trend detection, analysis, and actionable recommendations without digging through the data yourself.
- Build dashboards, Excel files, presentations, and web apps with AI. Describe what you need and get a production-ready asset in one click.
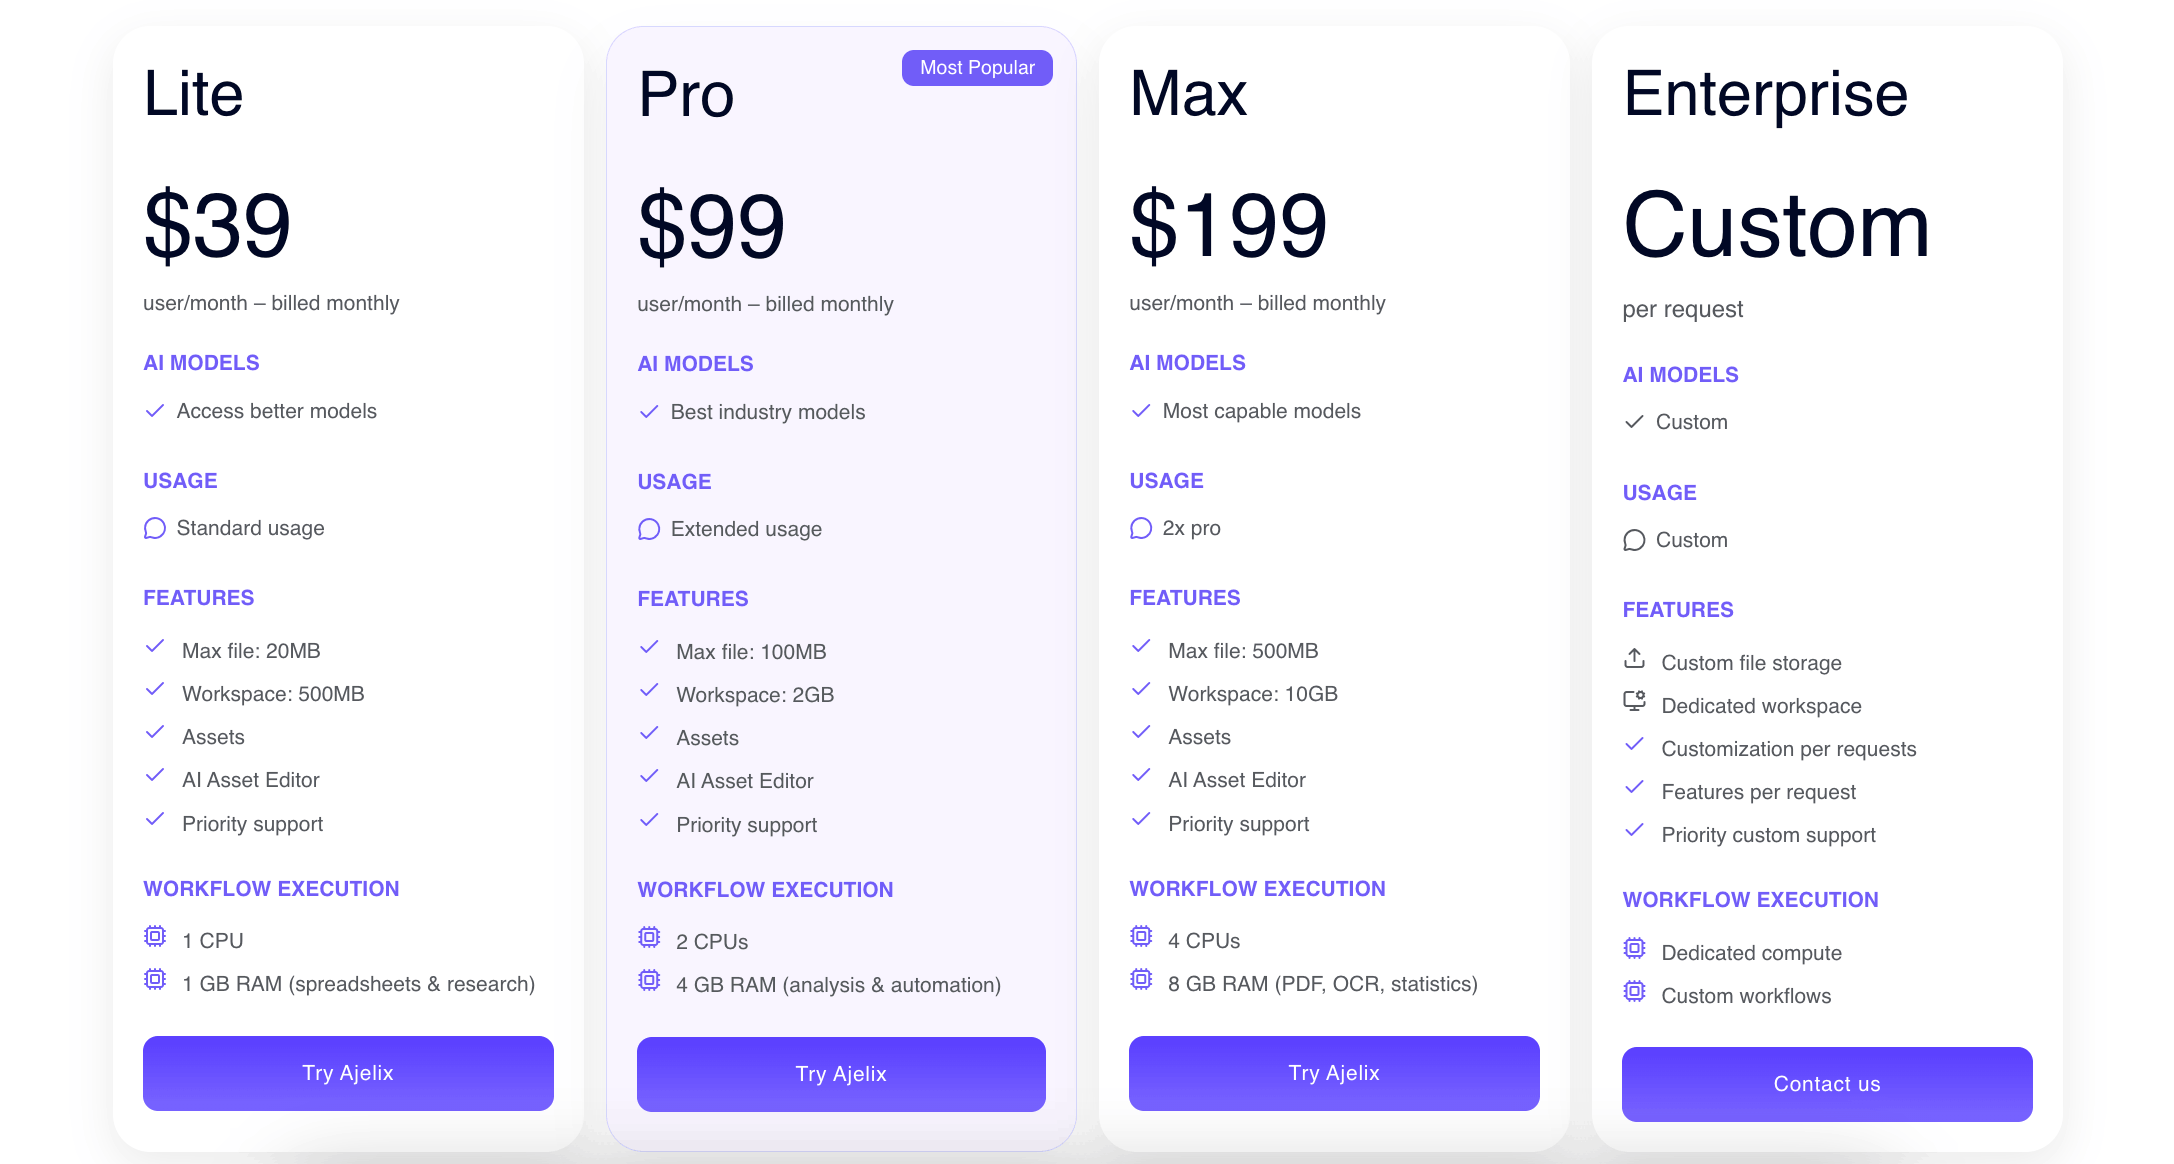
Pricing
Ajelix data visualization platform pricing is straightforward:
- You can try it for free before committing.
- The Lite plan is $39/month for individuals who need more power – 20MB files, 500MB workspace, and asset creation.
- The Pro plan at $99/month unlocks the full experience with best-in-class models, 100MB files, 2GB workspace, and extended usage.
- The Max plan at $199/month is built for heavy workloads – 500MB files, 10GB workspace, and 2x the processing power.
When you choose Ajelix, you’re backed by a team of developers who care deeply about building tools that actually move the needle for businesses. With hands-on support and continuous improvements, your investment keeps paying off long after day one.
Best For
- Solo entrepreneurs and individuals who need fast, data-driven decisions
- Finance teams looking to automate reports and variance analysis
- Marketing teams that turn data into polished, client-ready deliverables
- Departments across any organization that need flexible, ad-hoc reporting
- Small to medium businesses that move fast and need results to match
- Non-technical teams who want powerful outputs without the complexity
- Anyone who needs working assets – dashboards, apps, presentations, and Excel files ready in minutes
2. Power BI
Power BI stands out as a prominent tool for data visualization and analytics, fostering a culture driven by data within organizations. As per the Trust Radius survey, Microsoft Power BI clinches the top spot as the leading BI software in 2021, commanding an impressive 36% of the market share.
Power BI benefits and features
For such an advanced platform, we won’t mention all the features. However, we will highlight the best feature that makes Power BI one of the best BI platforms out there.
- A variety of data connections
- DAX formulas
- Real-time information and regular data updates
- Data transformations through queries (Power Query editor)
- Seamless integration with Microsoft’s applications
- Easy integration with Excel queries, data models, and reports.
- Affordable solution with one of the lowest BI subscription prices on the market.
- Personalized dashboard and fully customized visualizations (requires coding)
- Built-in AI analytics.
Power BI proves to be a robust tool tailored for experts, developers, and seasoned data analysts. However, its complexity poses a challenge for users lacking experience. Additionally, the cost factor can be significant. In this section, we will succinctly outline the drawbacks and limitations of this platform.
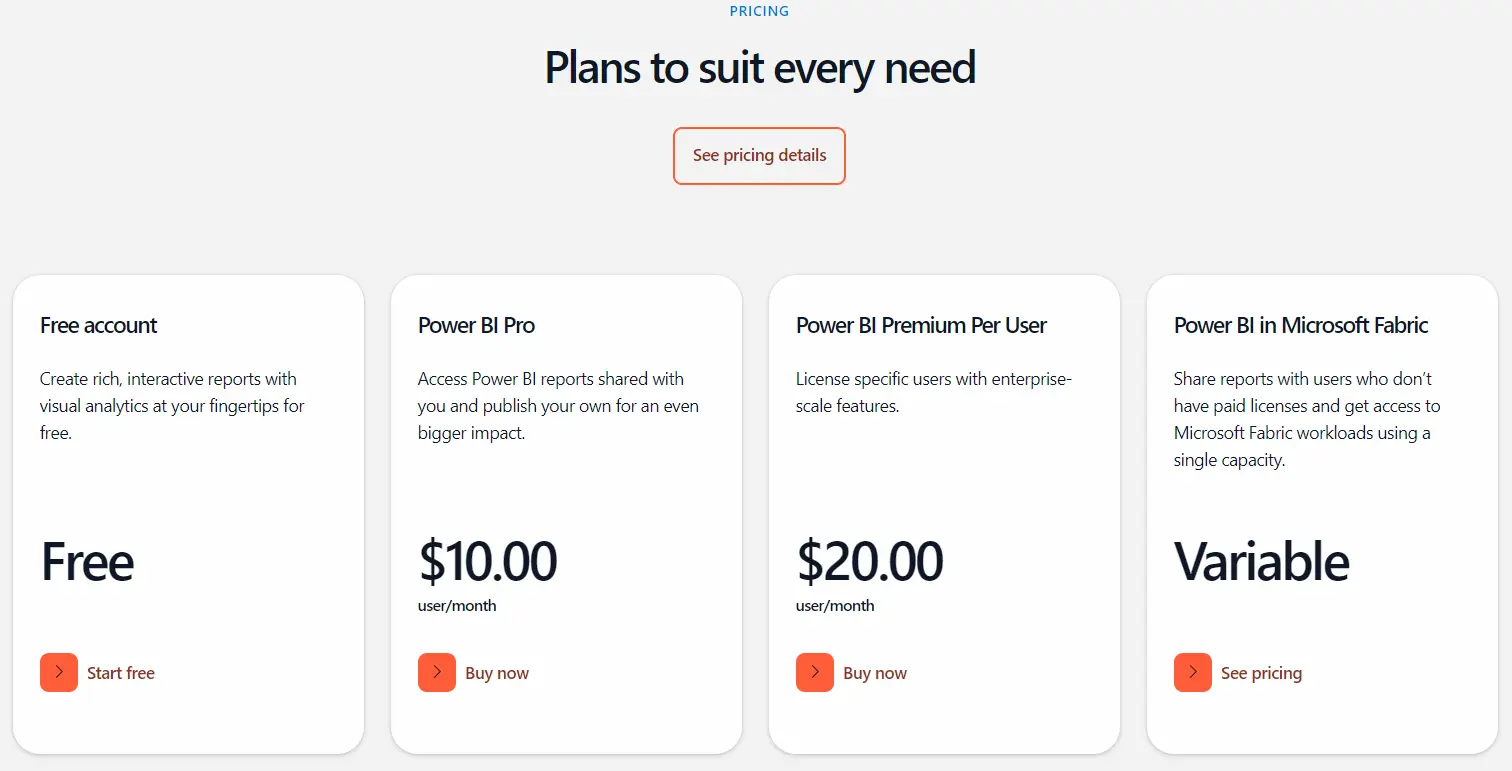
Power BI dashboard screenshot from https://learn.microsoft.com/it-it/power-bi/create-reports/service-dashboards
Power BI limitations and cons
- The setup process demands a grasp of complex DAX function writing.
- Advanced data analysts are essential for configuring reports tailored to your business needs.
- Mobile application creation is challenging. You need to develop a separate report for mobile apps.
- Lacks web interface for report building.
- The learning curve is steep, with an abundance of functionality that can overwhelm most users when attempting to create a report.
- Password protection for reports is unavailable; once published online, anyone can open the report with link.
- Making changes is cumbersome, requiring contact with data analysts each time adjustments are necessary.
- Opening the report on a new computer isn’t straightforward; you will have to set up the files every time access is needed.
- Simultaneous user editing is unsupported; the report, stored locally, prevents multiple editors from collaborating.
- Immediate problem resolution is unattainable; issues may take weeks to resolve with external consultants.
- Cross-platform editing is not possible; editing reports from mobile or tablet devices is not supported.
- Dependency on the Microsoft ecosystem, while advantageous for existing Microsoft product users, may pose limitations for organizations on other platforms.
- Incorporating custom HTML and videos is hard, contrasting with the simplicity of the desired feature.
- Real-time data refresh is not instant; you will experience a delay between report changes and system updates.
- Unpublishing a report is not a straightforward process, so you have to delete the file to remove the report from online sharing.
- Discover more detailed overview of Power BI pros & cons.
The drawbacks of this platform can vary, given that each organization has different needs and capabilities. The next section will provide an overview of the available pricing plans.
Pricing
Power BI provides primarily three plans with fixed pricing; however, you can obtain a customized offer by reaching out to the sales team.
- Free: Designed for individuals creating reports for personal use, this plan does not allow for sharing reports or collaborative work with others.
- Power BI Pro: Geared towards individual users seeking collaborative report capabilities, this plan includes advanced analytics features not found in the free version. The cost is $10 per user per month.
- Power BI Premium per user: Encompassing advanced features such as AI analytics, insights, a quicker refresh rate, and 23 additional functionalities, this plan is priced at $20 per user per month.
The MS Fabric plans to commence at $4,995 and scale upwards. Organizations need to consider that opting for these plans entails substantial migration and implementation phases. Nevertheless, in the long run, this could prove highly advantageous for companies dealing with significant volumes of data.
Best For
While the potential of this platform is nearly limitless, it doesn’t necessarily cater to everyone. Here’s our list of individuals who should consider utilizing this platform:
- Large enterprises manage substantial volumes of data.
- Companies with numerous data sources are seeking assistance in consolidating data integration.
- Experienced professionals, particularly data analysts proficient in DAX formulas.
- Workspaces are already operating within the Microsoft environment.
3. Looker
Looker is a platform for data modeling, governance, and the creation of intricate data systems. They offer a self-service platform where you can build custom applications as well as chat with your business data. Looker is great for applications and big data analytics.
Features and Benefits
- Real-time insights and reports from your choice of cloud.
- Available embedded analytics
- Option to connect with other BI platforms
- Custom templates
- Their language – Looker Modeling Language (LookML) is built around SQL to create semantic data models.
Pricing
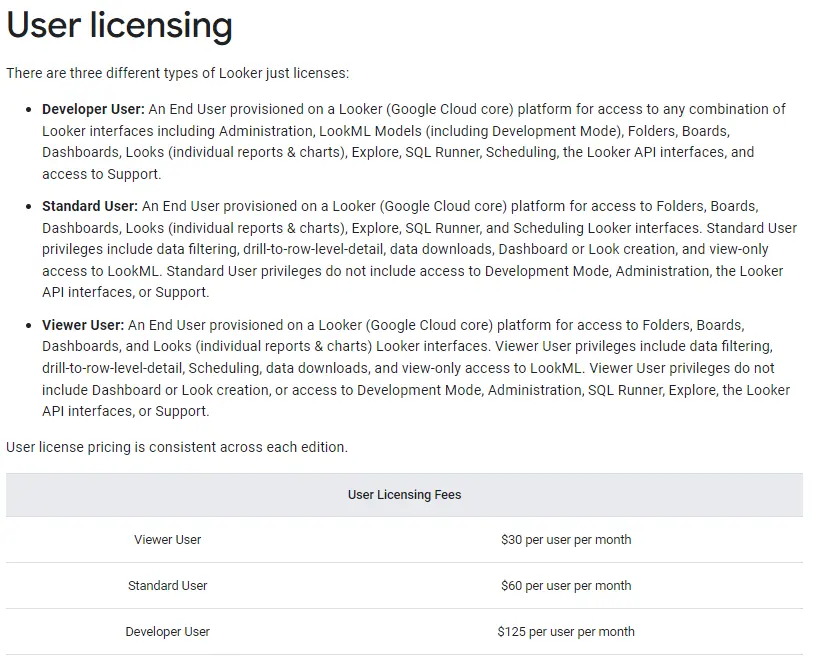
Looker’s pricing plan is separated into two parts: packages and individual licensing. They offer 3 platform editions: Standard, Enterprise, and the Embed plan. You can purchase individual licenses:
- The developer user is the license holder who will be able to create the report, it has access to anything this BI platform offers. The cost is 125$ per user per month.
- Standard users will be able to use and analyze the created reports. This user won’t have access to development mode, administration, API, or support. It will cost you 60$ per user a month.
- Viewer users are pretty straightforward, you can only view the reports and interact with them. The license is 30$ per user per month.
Looker cons and limitations
- Steep learning curve: Mastering SQL and advanced analytics is a prerequisite for setting up this BI platform.
- High costs: In our review, this platform stands out as one of the most expensive, making it ideal for enterprises but potentially overwhelming for small to medium-sized businesses.
- Restricted customer support: Obtaining assistance can be difficult, with extended wait times.
- Performance concerns: Some developers have reported lagging issues when dealing with substantial amounts of data.
- Missing some filtering functions based on the reviews from customers.
- Complex user management and sharing, when building a dashboard, you should keep in mind how many users you will add.
- Missing advanced formula creation compared to other tools.
- The user interface and editing could be better. Users complain that it’s hard to edit and that the tool is missing some visualization functions.
Best For
- Large-scale enterprises
- Experienced data analysts proficient in SQL and Google solutions
- Companies dealing with substantial amounts of data
- Lacks mobile application support
Related Article: Ajelix Insights: Why Business Intelligence Has Become Overwhelming?
4. Zoho Analytics
Zoho Analytics helps businesses connect, prepare, analyze, and collaborate with data in one place. With this BI platform, you create reports without any help from IT.
Features
- Zoho offers a variety of data source connections from popular data sources and different business applications.
- Data cleansing and preparation before report creation. You can also cleanse data using intelligent insights to remove duplicates and invalid entries.
- With User-friendly editing with drag and drop functionality, you can create interactive dashboards.
- Analyze data with AI to reveal insights. You can use conversational analytics, predictive analytics, and what-if analysis.
- Collaborate and share reports with others.
- Embed analytics in your applications with no-code solutions.
Pricing
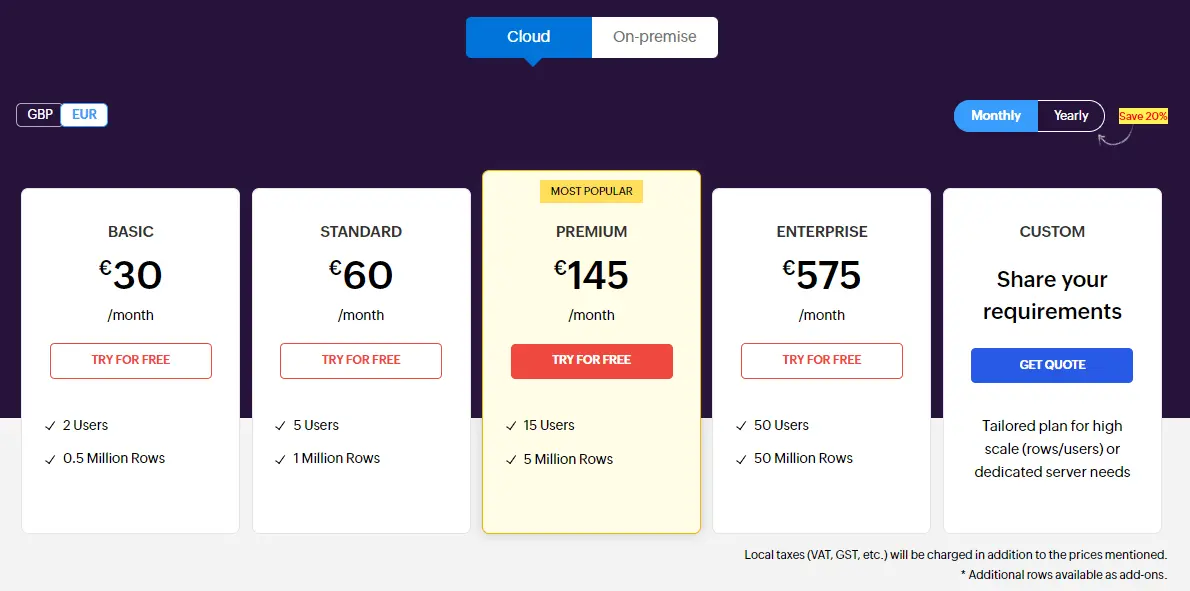
Zoho’s pricing structure is divided into two sections: Cloud and On-Premise. The On-Premise plan is pricier and is further categorized into four plans:
- The Basic plan is priced at 30€ per month, covering 2 users and 0.5 million rows.
- The Standard plan is available at 60€ per month, providing access for 5 users and accommodating 1 million rows.
- The Premium plan, costing 145€ per month, offers usage for 15 users and supports 5 million rows.
- The Enterprise plan, priced at 575€ per month, caters to 50 users and accommodates 50 million rows.
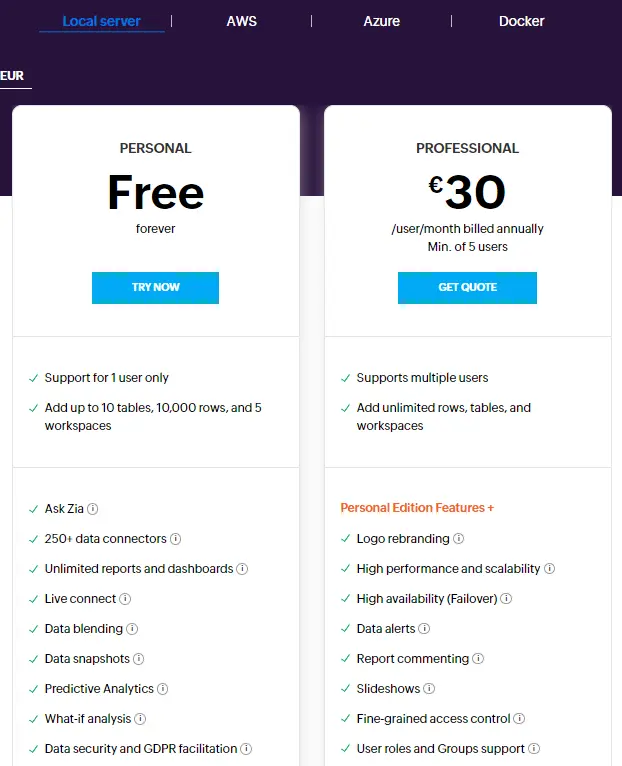
Nevertheless, opting for the on-premise solution will result in lower costs. Here’s a detailed breakdown:
- The freemium plan of Zoho is suitable for personal use.
- The Professional plan is priced at 30€ per month per user when you include 5 users.
Limitations and Cons
- Certain customers express the need for additional videos and resources to enhance the onboarding process.
- While the cost can add up, it remains relatively reasonable when compared to previous BI tools.
- A significant learning curve persists.
- The user experience lacks sufficient intuitiveness, and certain reports may require the assistance of an IT specialist.
- Loading times for embedded charts can be prolonged.
- Full utilization of the platform still requires a grasp of SQL.
Ideal Users
- Nontechnical teams.
- Users who are not fluent in data analytics.
- Small to medium businesses.
- Analysts who work with SQL.
Related Article: Master Real Estate Data Visualization
5. Domo
Domo is another BI platform that offers AI analytics and data visualization. They offer predictive analytics using AI, encouraging data exploration. Let’s take a look at the most popular features.
Features and Benefits
- Use AI and machine learning to get predictive analysis and uncover insights.
- You can create customizable charts and dashboards.
- They offer a mobile version for reporting
- Embed analytics
- Real-time data reporting
- Offers different data sources to bring data into one place.
- SQL needed for advanced analytics.
Pricing
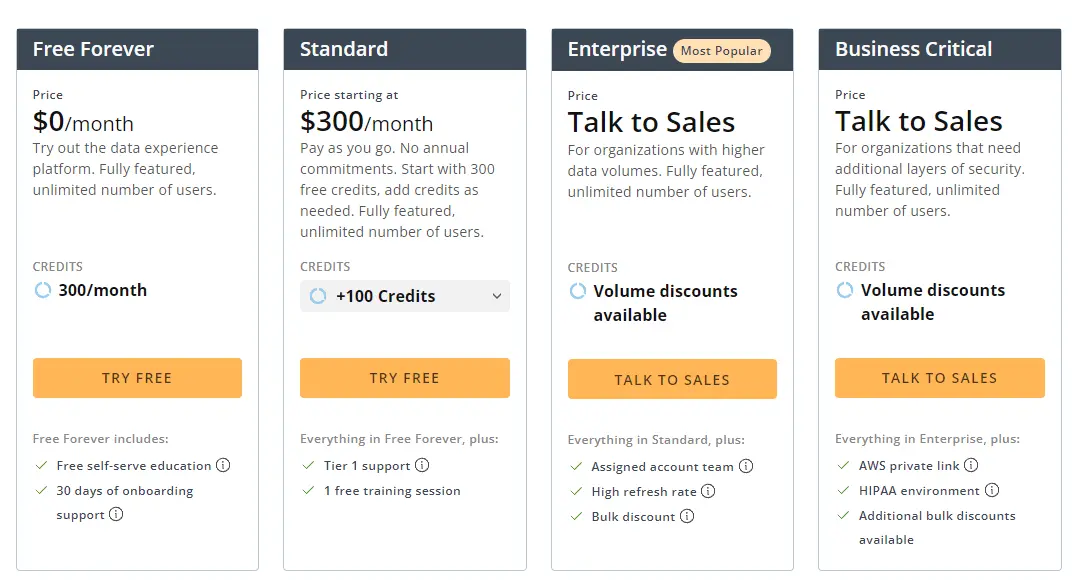
Domo offers 4 pricing plans:
- Free plan with unlimited experience that lets you try the platform fully. The only limitation are credits that you have 300/month. If you want more, you’ll have to subscribe.
- Standard plan starts from 300$ with no annual commitments, that let’s you add credits as much as you need. Each 100 credits costs 300$ but you don’t have to deal with more licenses or complex pricing plans.
- To get the enterprise and business-critical plan, you have to contact the sales team.
What are Domo limitations and cons?
- The visualizations are limited and lack customization options.
- There are missing interactive guides with screenshots and videos, so it’s hard to follow the text block guides.
- Pivot table functionality is limited
- Large dataset processing can get slow.
- A little bit pricy, and the pricing system with credits can be confusing
- The system is not very user-friendly, and the setup can be hard.
Who are the ideal Domo Users?
- Large enterprises
- Medium businesses
Related Article: Data visualization principle’s and best practices
Other Tableau Alternatives
There are more BI tools worth mentioning that could be a great Tableau alternative. Here are a few of them:
- Sisense: this platform is custom-built for every customer, so there’s no “one solution fits all”.
- Klipfolio: With great visualizations, this tool could be considered as an alternative.
- Qlik Sense: another powerful BI platform for data analytics experts
Summary
Here’s a quick summary with Tableau alternatives and pricing comparisons.
| Feature | Tableau | Ajelix | Power BI | Looker | Zoho | Domo |
|---|---|---|---|---|---|---|
| Coding needed | ||||||
| Pricing | 15$-75$ | 20$-200$ | 10$-8.5K$ | 30$-5000$ | 30$-575$ | 20$-2700$ |
| Complex Pricing | ||||||
| Freemium | ||||||
| Automatic Data Refreshing | ||||||
| AI Data Analytics |
Frequently Asked Questions
There isn’t one answer to this question, as each organization has different needs and a budget. Therefore, you have to compare all the tools and understand which solution is the best for your situation. Subjectively, we think that the rising star, Ajelix could be the best alternative.
Yes, you need to have advanced data analytics knowledge using SQL and setting up API’s to create reports. However, as a user, you need to go through training and video materials to understand how the system works.
So what is the best alternative to Tableau? That’s the question only you can answer.
Ready to test Ajelix?
From data to report in one minute or less with Ajelix AI Agents


