How To Use AI Dashboard Generator

Data is king, but manually sifting through spreadsheets and reports can feel like searching for gold in a mountain of sand. 🏜️ In today’s fast-paced business world, we need insights quickly and effortlessly, and that’s where AI dashboard generator come in.
Imagine a solution that automatically creates insightful visualizations, highlighting key trends and uncovering hidden patterns in your data – all with just a single click. Sounds like science fiction, right? With the help of different AI tools, this futuristic vision is already a reality.
This blog explores the exciting world of AI-powered dashboards, diving into how they work, the benefits they offer, and the different solutions available.
Change the way you work with agentic AI
One-click dashboards,KPI tracking, and AI-powered insights—for work that actually gets done.

What is an AI Dashboard?
AI dashboard is a digital representation of your data that leverages Artificial Intelligence to automatically generate insights and visualizations. You don’t have to manually configure charts, graphs, and layouts – AI takes the reins, pulling key trends and patterns directly from your data and presenting them in an easy-to-understand format.
This means no more endless hours spent building dashboards, letting you focus on what truly matters: analyzing the information and making data-driven decisions.
An AI dashboard generator is a tool that uses artificial intelligence for visualizations and dashboards. These dashboards are typically interactive and present insights gleaned from your data.
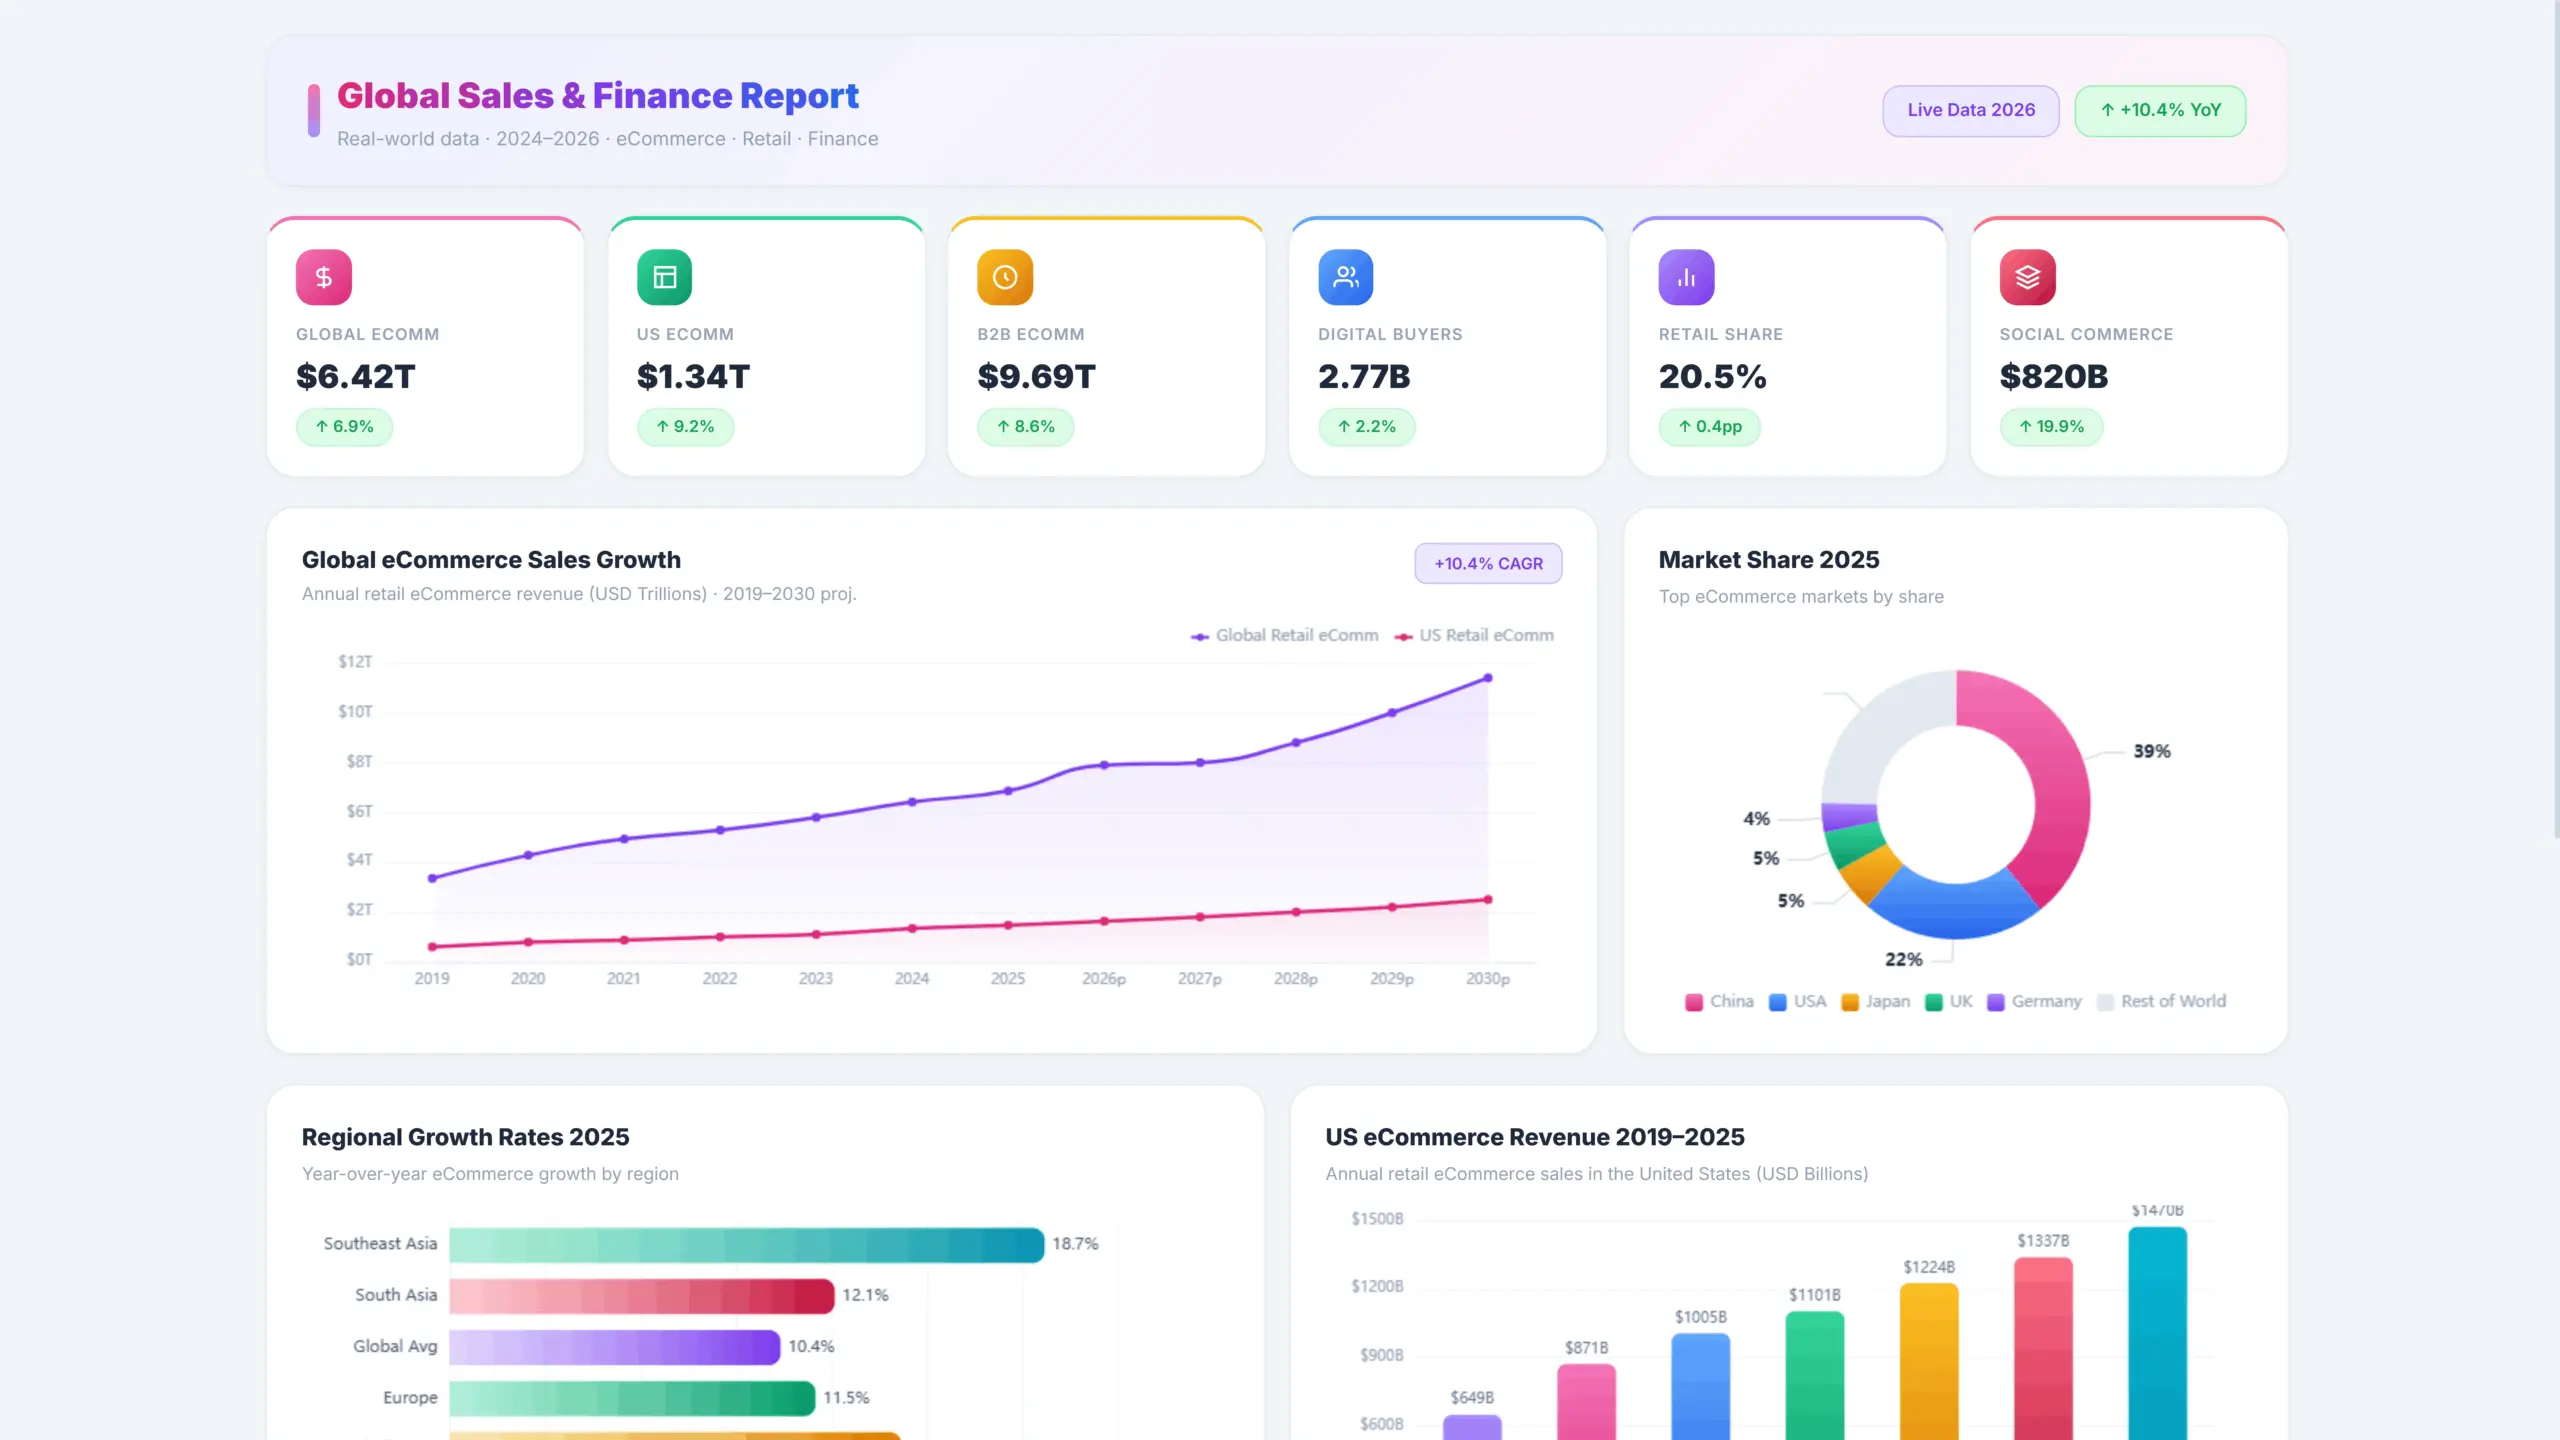
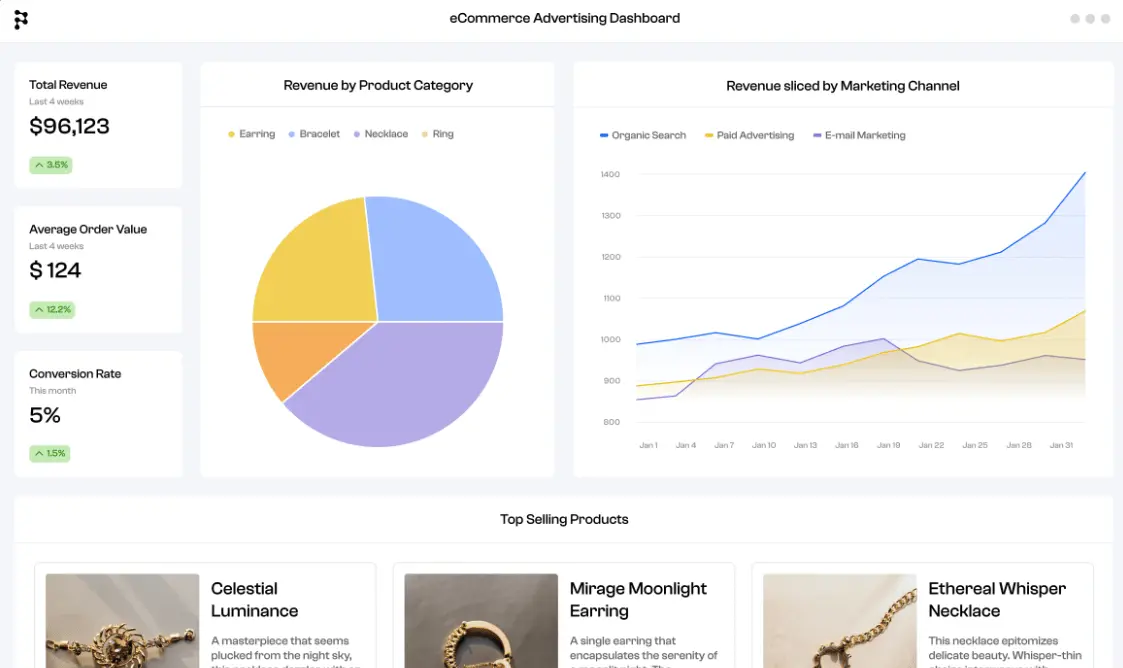
Imagine uploading your sales data and within seconds, having a dynamic dashboard showcasing top-selling products, and regional trends. That’s the power of AI in action. And when it comes to making this a reality, platforms like Ajelix stand out by offering one-click AI dashboard generation.
How does AI Dashboard Generator work?
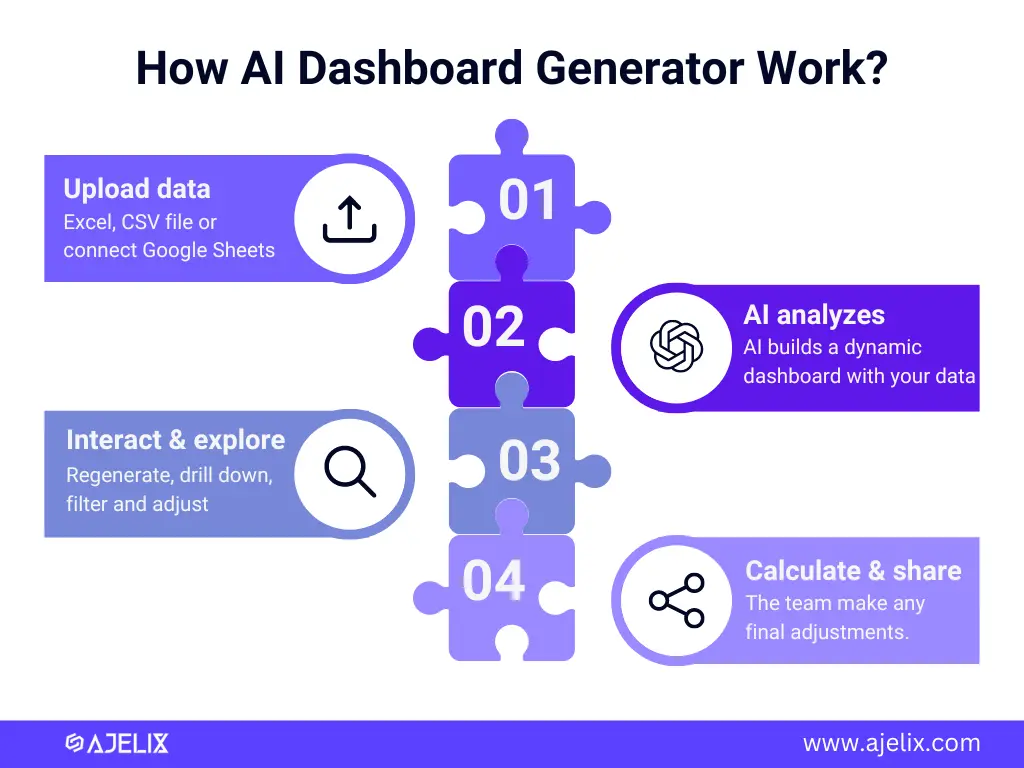
Simply connect your data source, and the AI engine will automatically create live, interactive dashboards tailored to your specific needs. No coding is required, just instant insights at your fingertips. Here’s a more detailed explanation of how the AI dashboard generation in Ajelix works:
- Data upload
- AI analyzes & creates dashboard
- User analyzes data with AI
- Dashboard customization & sharing
1. Upload Your Data
Start by adding your file to the system. Ajelix allows you to upload Excel or CSV files directly or connect with your Google Sheets for seamless data access.
Note: Your data is securely encrypted and saved on our severs. Only you can access your data directly. Data is not used for AI/ML module training and is not shared with third parties.
2. AI Analyzes and Creates
Once your data is uploaded, the AI engine takes over. It analyzes the data structure, identifies key metrics and trends, and determines the most suitable visualizations to represent them.
Without any manual configuration, the AI builds a dynamic dashboard tailored to your data. This may include charts, graphs, and other visual elements that effectively showcase the insights hidden within your data.
3. Interact and Explore
Your AI-generated dashboard is live and interactive. You can regenerate it or drill down into specific data points, filter information, and adjust visualizations to gain deeper understanding.
Want to unlock further insights? Ask the AI to explain any chart, and it will break down the data behind it, highlighting key trends and correlations in plain language.
4. Calculations and Sharing
Need to perform specific calculations on your data? Utilize the Ajelix AI agent to generate custom KPI metrics and calculations directly within your workspace.
Collaboration is key. Easily share your AI-powered dashboard with colleagues or stakeholders through secure sharing options. Everyone can access the insights, regardless of their technical expertise.
Reporting gives you a headache?
Upload your data and create professional reports with agentic AI

Start free
Try free and upgrade whenever
Ajelix simplifies data analysis by empowering the AI agent to do the heavy lifting. You upload your data, and the AI works its magic, generating informative dashboards and unlocking the hidden potential within your information. No coding, no complex configurations – just powerful insights at your fingertips.
the benefits of AI Data dashboards
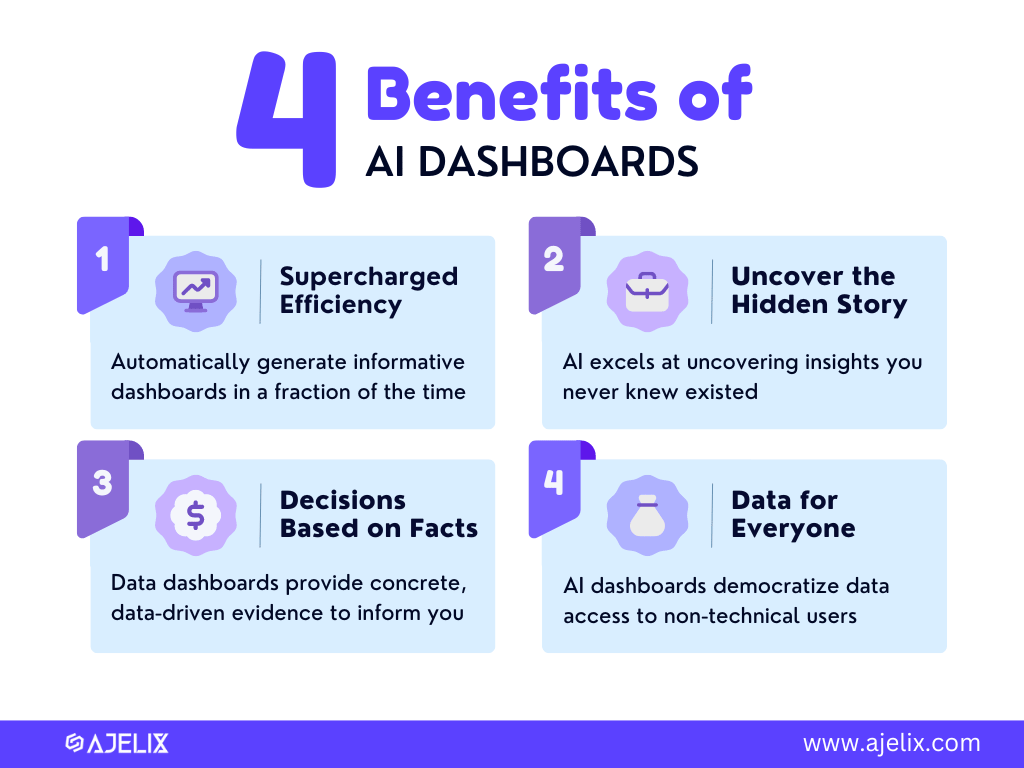
Infographic with 4 benefits of AI dashboards, created by author
Imagine turning your data into a crystal ball of business insights, revealing hidden trends and informing smarter decisions – all without spending hours crafting complex dashboards. That’s the magic of AI dashboards, and the benefits they offer are truly transformative:
1. Supercharged Efficiency
Say goodbye to manual chart-building and endless data manipulation. AI takes the wheel, automatically generating informative dashboards in a fraction of the time. This frees up your valuable resources for what truly matters – analyzing the insights and taking action.
2. Uncover the Hidden Story
Buried within your data lie valuable patterns and correlations that manual analysis might miss. AI, however, excels at finding those hidden gems, uncovering insights you never knew existed. This deeper understanding empowers you to make data-driven decisions with greater confidence.
3. Decisions Based on Facts, Not Guesses
No more relying on intuition or gut feeling. AI dashboards provide concrete, data-driven evidence to inform your choices. This objective perspective leads to better decision-making, improved outcomes, and a competitive edge.
4. Data for Everyone
Forget the days when data analysis was reserved for technical experts. AI dashboards democratize data access, making insightful visualizations and key metrics understandable and actionable for everyone, regardless of their technical background. This fosters collaboration and data-driven decision-making across all levels of your organization.
How To Generate AI Dashboard?
Manually creating dashboards can be time-consuming and require technical expertise. This is where AI-powered dashboards come in.
Time needed: 10 minutes
This guide will equip you with the knowledge and tools needed to create your own AI dashboard, step-by-step:
- Choose Your Platform
Several platforms offer AI-powered dashboard capabilities, each with its strengths and weaknesses. Consider your needs and preferences when choosing:
– Ajelix: Known for its one-click AI dashboard generation and ease of use, perfect for beginners.
– Looker: Geared towards large enterprises with advanced security and governance features.
– Zoho Analytics: Focuses on collaboration and embedding dashboards seamlessly into existing workflows. - Prepare Your Data
Before delving into AI, ensure your data is clean, organized, and in a format compatible with your chosen platform. This may involve tasks like:
– Cleaning and formatting: Remove inconsistencies, missing values, and duplicates.
– Transforming data: Structure your data for analysis, like creating calculated fields or joining datasets.
– Connecting to the platform: Upload your data files (Excel, CSV, etc.) or establish a connection to your data source (e.g., Google Sheets). - Leverage the AI
Trigger the AI analysis: Click the designated button or follow the platform’s specific instructions. For Ajelix AI agent platform, simply type in the chat “Generate AI dashboard” and you will get several charts and metrics.
- Explore and Customize
Your platform will generate a preliminary dashboard based on the AI analysis. But don’t stop there:
– Explore the visualizations: Understand the insights presented, identifying trends and patterns.
– Customize the dashboard: Ask AI agent to adjust visualizations, add filters, and rearrange elements to suit your needs.
– Ask the AI for explanations: Some platforms (including Ajelix) offer AI agent explanations to help you understand complex charts and trends.
- Share and Collaborate
Once you’re satisfied with your dashboard, share it with colleagues or stakeholders:
– Export or embed: Most platforms offer various export options (e.g., PDF, PNG) or embedding functionalities to share dashboards within workflows.
– Collaborate and annotate: Depending on the platform, collaborate with others through real-time editing, link sharing, and annotations. (You can easily share report on Ajelix using links, passwords or emails).
Embracing AI-powered dashboards empowers you to transform data into actionable insights, driving informed decision-making and strategic success.
Best AI Dashboard Generators
Now you’re probably wondering how to get that flashy AI dashboard? This guide will compare several leading platforms to help you make an informed decision:
1. Ajelix
| Pros | Cons |
|---|---|
| One-click AI dashboard generation: The simplest and fastest way to create AI-powered dashboards, ideal for beginners. | Limited customization options: Less flexible compared to some competitors. |
| Ease of use: Just type what you need and watch Ajelix AI agent execute it – no coding required. | Fewer industry-specific features: Less suitable for highly specialized needs. |
| Accessibility: Affordable pricing and caters to both individuals and businesses. | |
| Explainable AI: Understand complex charts with AI agent explanations. |
2. Zoho Analytics
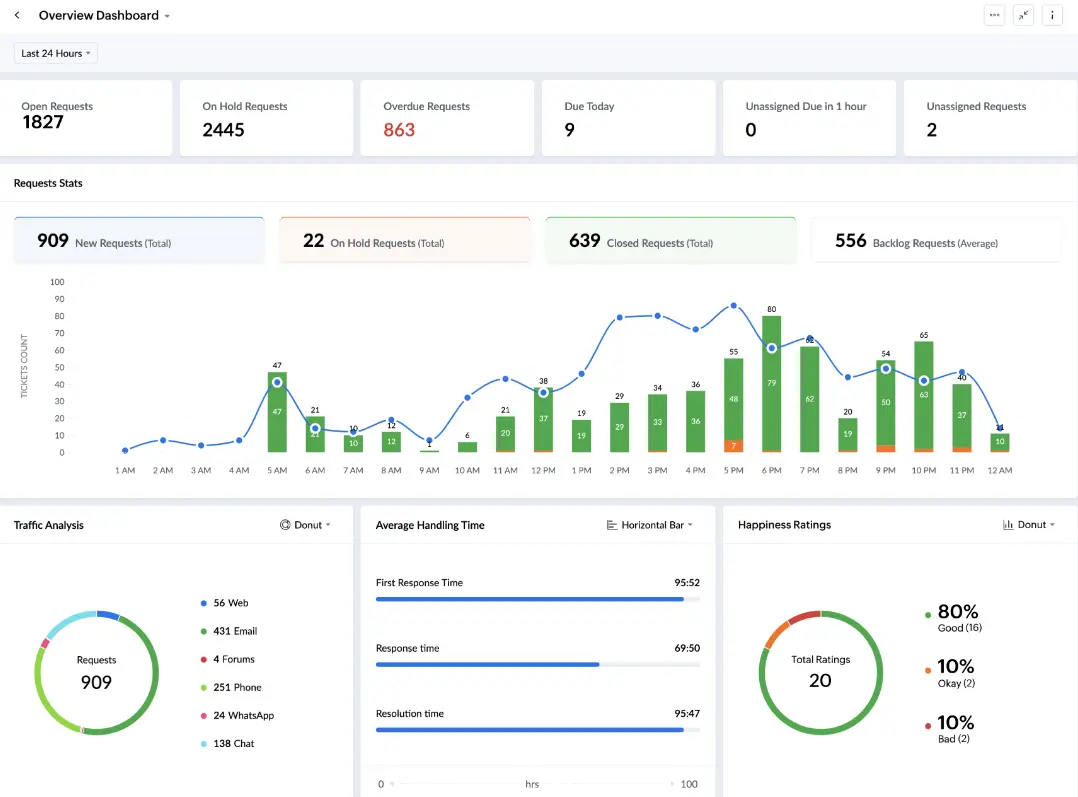
Zoho analytics dashboard screenshot, by author
| Pros | Cons |
|---|---|
| Collaboration features: Real-time editing and sharing for seamless teamwork. | AI dashboard generation not as prominent: Requires more manual configuration compared to others. |
| Embedding capabilities: Integrates dashboards directly into existing workflows. | Limited data connectors: Fewer built-in connectors compared to some competitors. |
| Industry-specific templates: Ready-made dashboards for various industries. | |
| Affordable pricing: Competitive pricing plans for different budget needs. |
3. Akkio
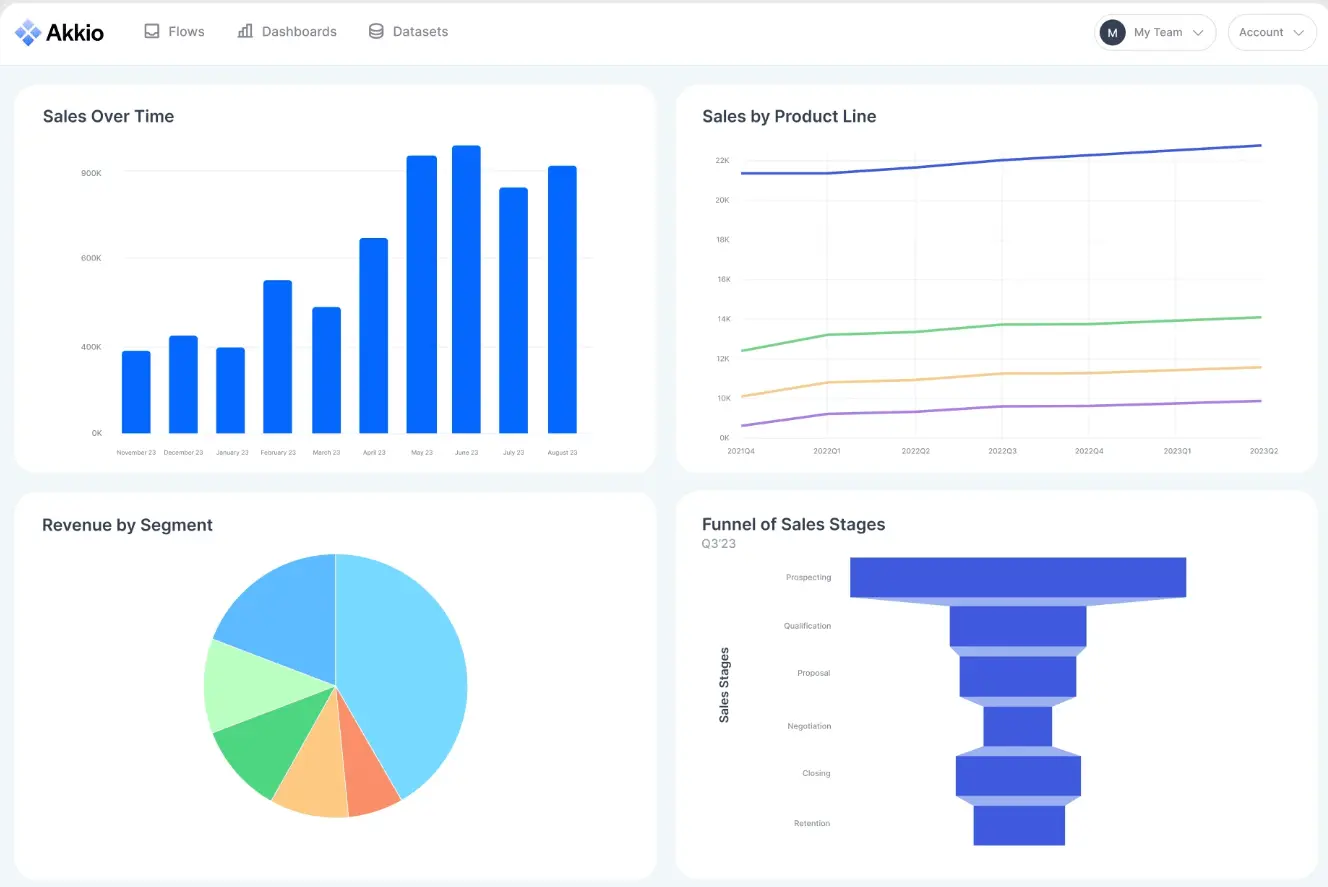
Dashboard example from Akkio website
| Pros | Cons |
|---|---|
| One-click AI dashboard generation: Creates reports instantly, ideal for fast insights. | Limited customization options: Less flexibility compared to some competitors. |
| Tailored to specific projects and goals: Analyzes your data and objectives for relevant insights. | Potentially higher cost: Pricing information not readily available on the website. |
| Live, shareable reports: Securely share and collaborate on reports with your team. | Focus on marketing & sales: Primarily caters to those industries. |
| Connects to live data sources: Ensures your reports reflect the latest information. | Limited data source options: Currently connects to Google Sheets and specific cloud platforms. |
| No coding required: User-friendly interface accessible to non-technical users. |
4. Polymer
Dashboard screenshot from Polymer website
| Pros | Cons |
|---|---|
| Free basic plan: Offers a free tier with limited functionalities. | Limited customization: Pre-built templates restrict design flexibility. |
| Pre-built templates: Streamlines initial setup and visualization process. | Fewer data connectors: Compared to enterprise-level tools. |
| Affordable: Individual and team plans with a free trial available. | Less advanced AI: Lacks complex analysis and predictive capabilities. |
| AI-powered insights: Generates automatic suggestions and identifies trends. | Focus on spreadsheets: Primarily geared towards transforming spreadsheets. |
5. Looker
Dashboard example screenshot from Looker website
| Pros | Cons |
|---|---|
| Advanced security and governance: Ideal for large enterprises with strict data regulations. | Steep learning curve: Requires technical expertise. |
| Scalability: Handles massive datasets efficiently | High cost: Expensive for smaller businesses or individual users. |
| Customization flexibility: Granular control over dashboards and visualizations. | Less AI-focused: AI features are present but not the core focus. |
| Integrations: Integrates with other BI and business tools. |
Conclusion
The world of data analysis is evolving rapidly, and AI-powered dashboards are leading the charge. With tools like Ajelix, Akkio and others reviewed in this guide, anyone can become a data analyst, uncovering deeper trends, making data-driven decisions, and achieving strategic success.
Remember, choosing the right AI dashboard platform depends on your specific needs and preferences. Consider factors like ease of use, data volume, industry focus, and budget. Don’t hesitate to explore free trials and demos to get a hands-on experience and find the best fit for your team.
FAQ
AI dashboards are data visualizations automatically generated using artificial intelligence. They analyze your data, identify key trends, and present them in clear, actionable insights without manual configuration.
Several tools offer AI-powered dashboard features, including Ajelix, Zoho Analytics, Akkio, and Polymer. Consider factors like ease of use, data volume, budget, and industry needs when choosing.
Pricing for AI dashboard generators varies depending on features, data volume, and user needs. Some offer free plans or trials, while others have tiered pricing models.
Choose one of the AI dashboard generators available in the market, such as Ajelix or Akkio, register, upload data and start dashboard creation.
Yes, there are several dashboard generators in the market, that let’s you create data dashboard with just one click.
Ready to generate AI dashboards with Ajelix?
From data to report in one minute or less with Ajelix AI Agents


