11 Best Operational KPIs For Operations Managers
Operational KPIs are measurable values that track the efficiency of a company’s day-to-day operations. They help managers assess how well things are running and identify areas for improvement.
Imagine being stuck in a maze without a map. That’s what managing operations can feel like without Key Performance Indicators (KPIs).
As an operations manager, you juggle countless tasks, resources, and deadlines. You need clear, quantifiable data to guide your decisions and steer your team towards success. That’s where operational KPIs come in, acting as your trusty compass in the ever-shifting landscape of business.
How can KPIs help you manage operational process?
These valuable metrics provide objective insights into various aspects of your operations, from production efficiency to customer satisfaction. Tracking and analyzing them empowers you to:
- Identify areas for improvement: Pinpoint bottlenecks, inefficiencies, and potential problems before they derail your progress.
- Measure progress and success: Track your performance against set goals and objectives, celebrating wins and course-correcting when needed.
- Make data-driven decisions: Ditch guesswork and rely on concrete evidence to guide your resource allocation, process optimization, and strategic planning.
- Boost team accountability: Set clear targets and track individual and team performance, fostering a culture of ownership and responsibility.
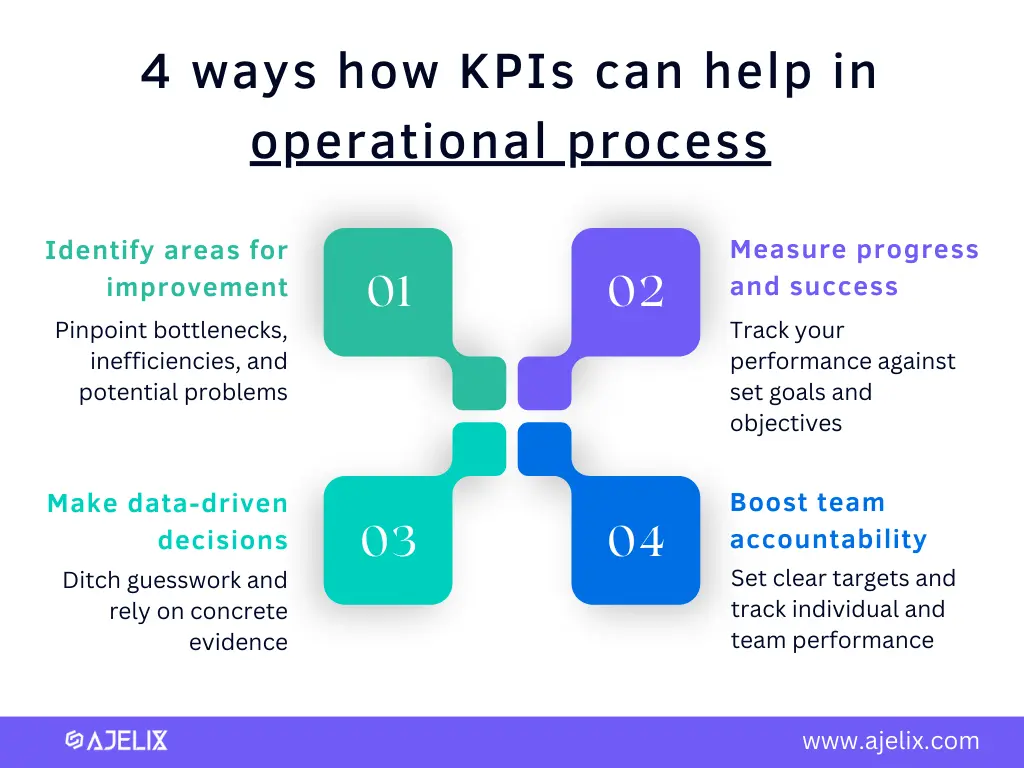
Infographic with 4 tips how KPIs can help in operational process made by author
Whether you’re overseeing a bustling manufacturing plant or a dynamic customer service team, effective operational KPIs are your key to unlocking efficiency, profitability, and growth. So, are you ready to ditch the maze and navigate your operations like a pro? Buckle up, because we’re diving into the 11 best operational KPIs every operations manager needs to know!
The 11 Most Important Operational KPIs
Now that we’ve established the power of operational KPIs, let’s delve into the nitty-gritty, including formulas and examples to bring them to life! Remember, adapt these to your specific context and industry for optimal results.
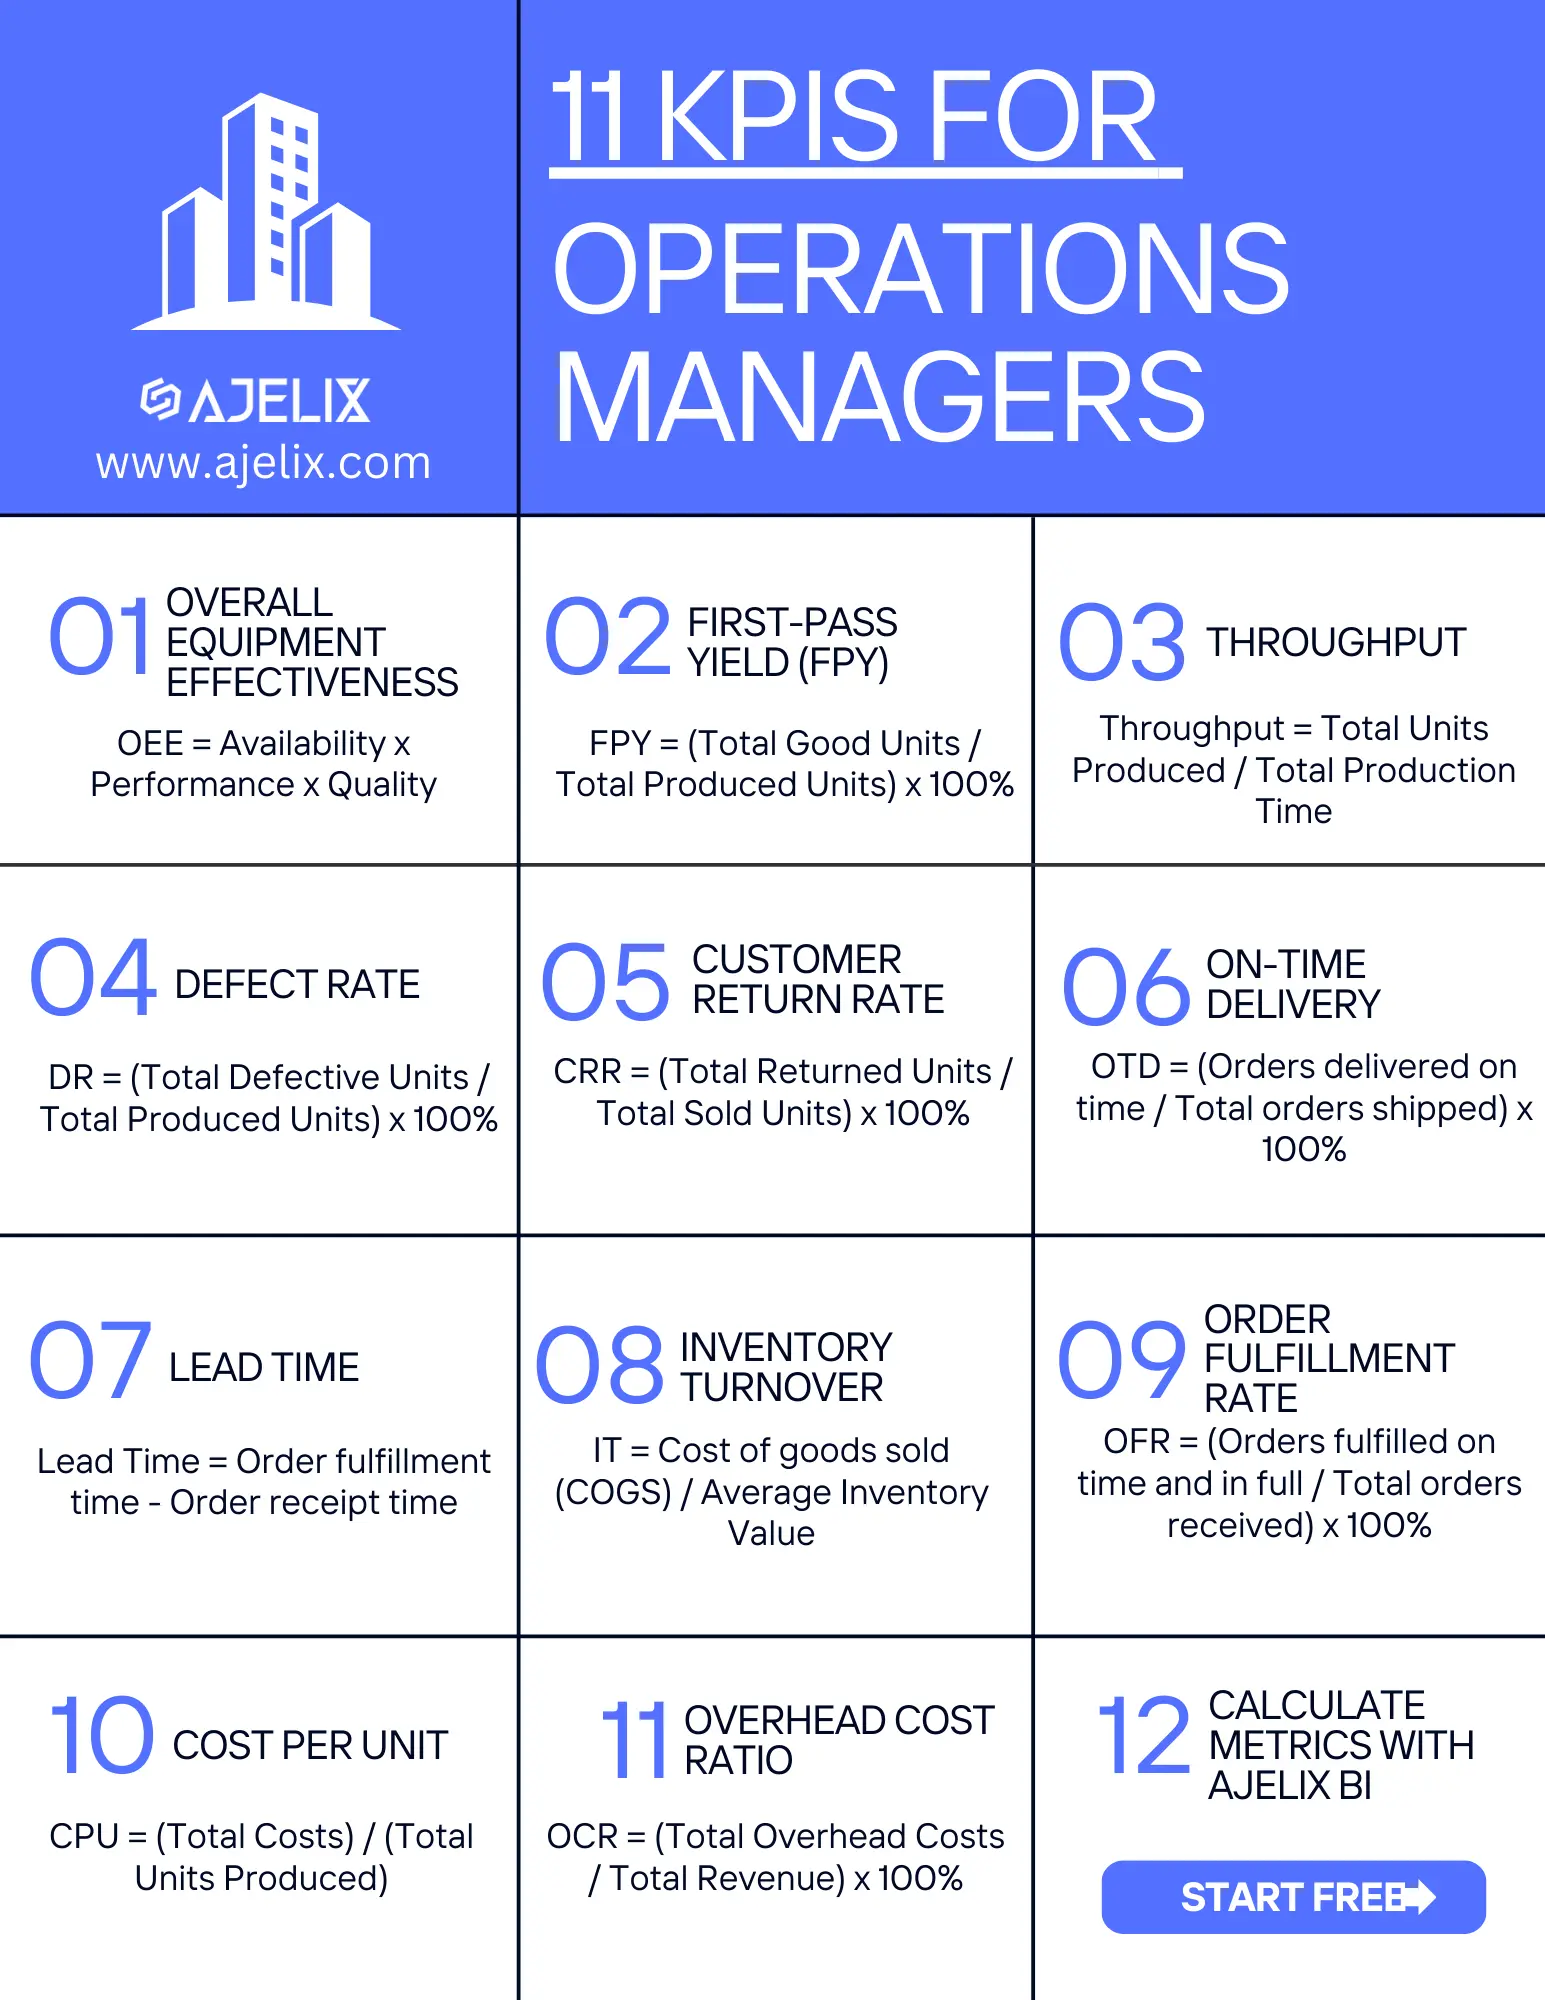
Here’s a quick recap of the most popular operational KPIs:
- Overall Equipment Effectiveness (OEE)
- First-Pass Yield (FPY)
- Throughput
- Defect Rate
- Customer Return Rate (CRR)
- On-Time Delivery (OTD)
- Lead Time
- Inventory Turnover
- Order Fulfillment Rate
- Cost per Unit
- Overhead Cost Ratio
1. Productivity KPIs For Operations
Imagine a machine humming tirelessly, churning out high-quality products at lightning speed. Now, envision your entire operation performing with that same level of efficiency. Sounds exhilarating, right?
That’s the magic of Productivity Metrics, a group of key performance indicators (KPIs) designed to supercharge your production output and optimize your resources.
By tracking and analyzing productivity metrics, you can:
- identify bottlenecks
- eliminate waste
- maximize the performance of your equipment, workforce, and processes
- discover actionable strategies to optimize your production flow
- minimize downtime
- drive your operation towards peak performance.
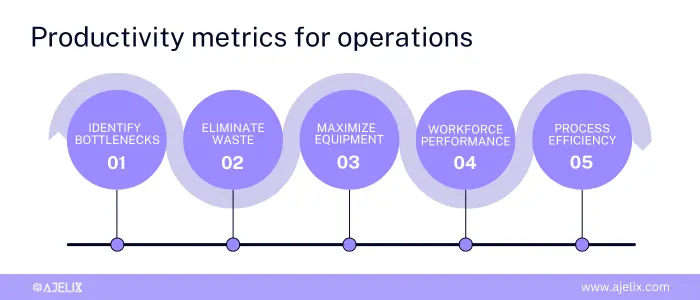
5 ways how productivity metrics can help improve operation process, infographic by author
1.1. Overall Equipment Effectiveness (OEE):
Think of OEE as your personalized efficiency compass, guiding you towards optimal production output. It combines three key factors:
- Availability: How much time is your equipment producing compared to planned downtime?
- Performance: Is your equipment running at its full potential speed while operational?
- Quality: Are you producing good units without defects or rework?
The magic happens when you multiply these three factors:
OEE = Availability x Performance x Quality
Example: Imagine a machine runs for 8 hours (availability), and produces 90% of its potential output (performance), but 5% of products are defective (quality). OEE = (8 hrs / 8 hrs) x 0.9 x 0.95 = 6.84.
Aim for an OEE of 85% or above, but remember, the target can vary depending on your industry and equipment.
1.2. First-Pass Yield (FPY):
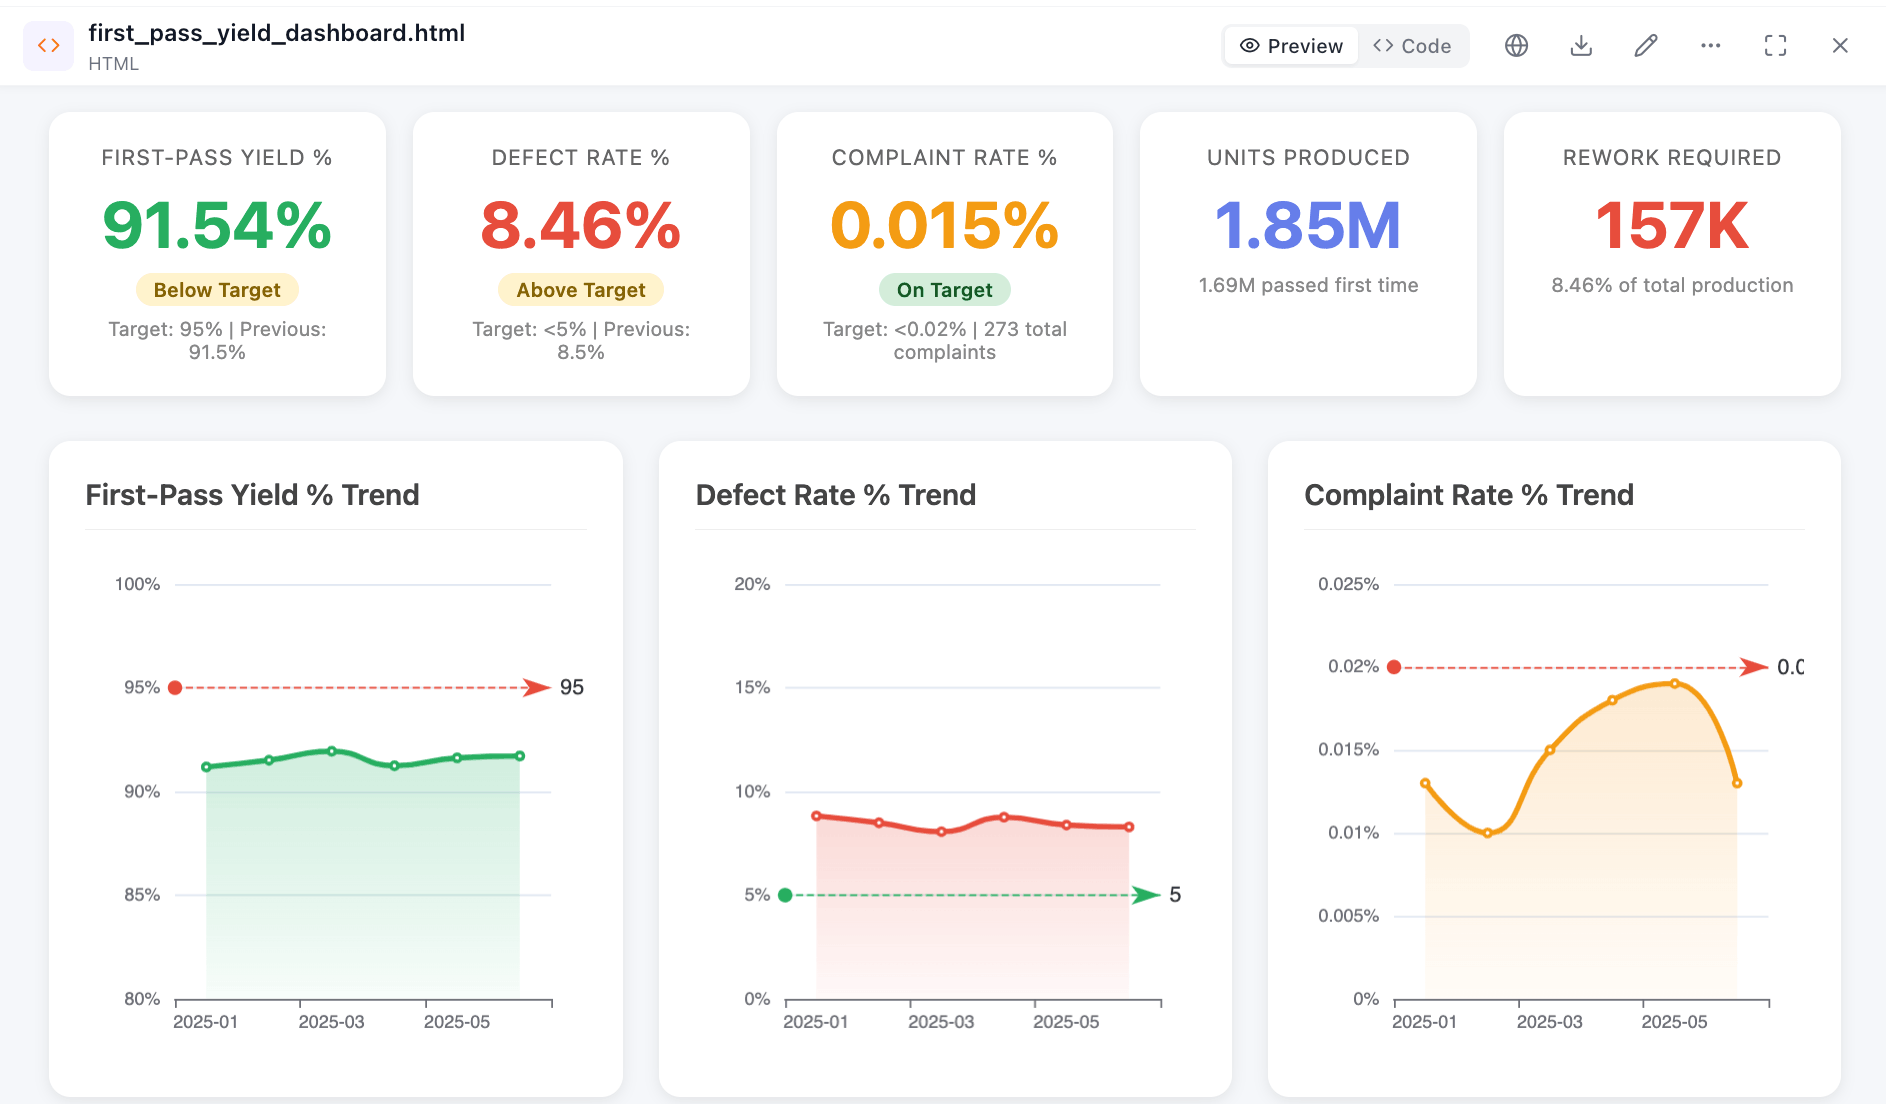
FPY measures the percentage of units passing quality inspection on the first try, reflecting the effectiveness of your manufacturing processes and quality control measures. In simpler terms, it tells you how often you get things right the first time.
FPY = (Total Good Units / Total Produced Units) x 100%
Example: If your factory produces 1000 units and only 50 require rework, FPY = (950 / 1000) x 100% = 95% (aim for 95% or above).
Strive for an FPY of 95% or above. This indicates efficient processes, minimal waste, and consistent product quality, ultimately leading to satisfied customers and improved profitability.
1.3. Throughput:
Imagine a river flowing steadily, carrying products from raw materials to finished goods with efficient speed. That’s the image of throughput, a crucial metric that measures the rate at which your operation transforms inputs into outputs. In simpler terms, it tells you how much you produce per unit of time.
Throughput = Total Units Produced / Total Production Time
Example: If your bakery produces 100 cakes in 2 hours, Throughput = 100 cakes / 2 hours = 50 cakes/hour (optimize for your specific product and capacity).
While a higher throughput generally indicates greater production capacity, remember, context matters. Optimize it based on your specific product, equipment, and demand. A maxed-out throughput might compromise quality, so find the sweet spot for efficient and sustainable production.
2. Quality KPIs
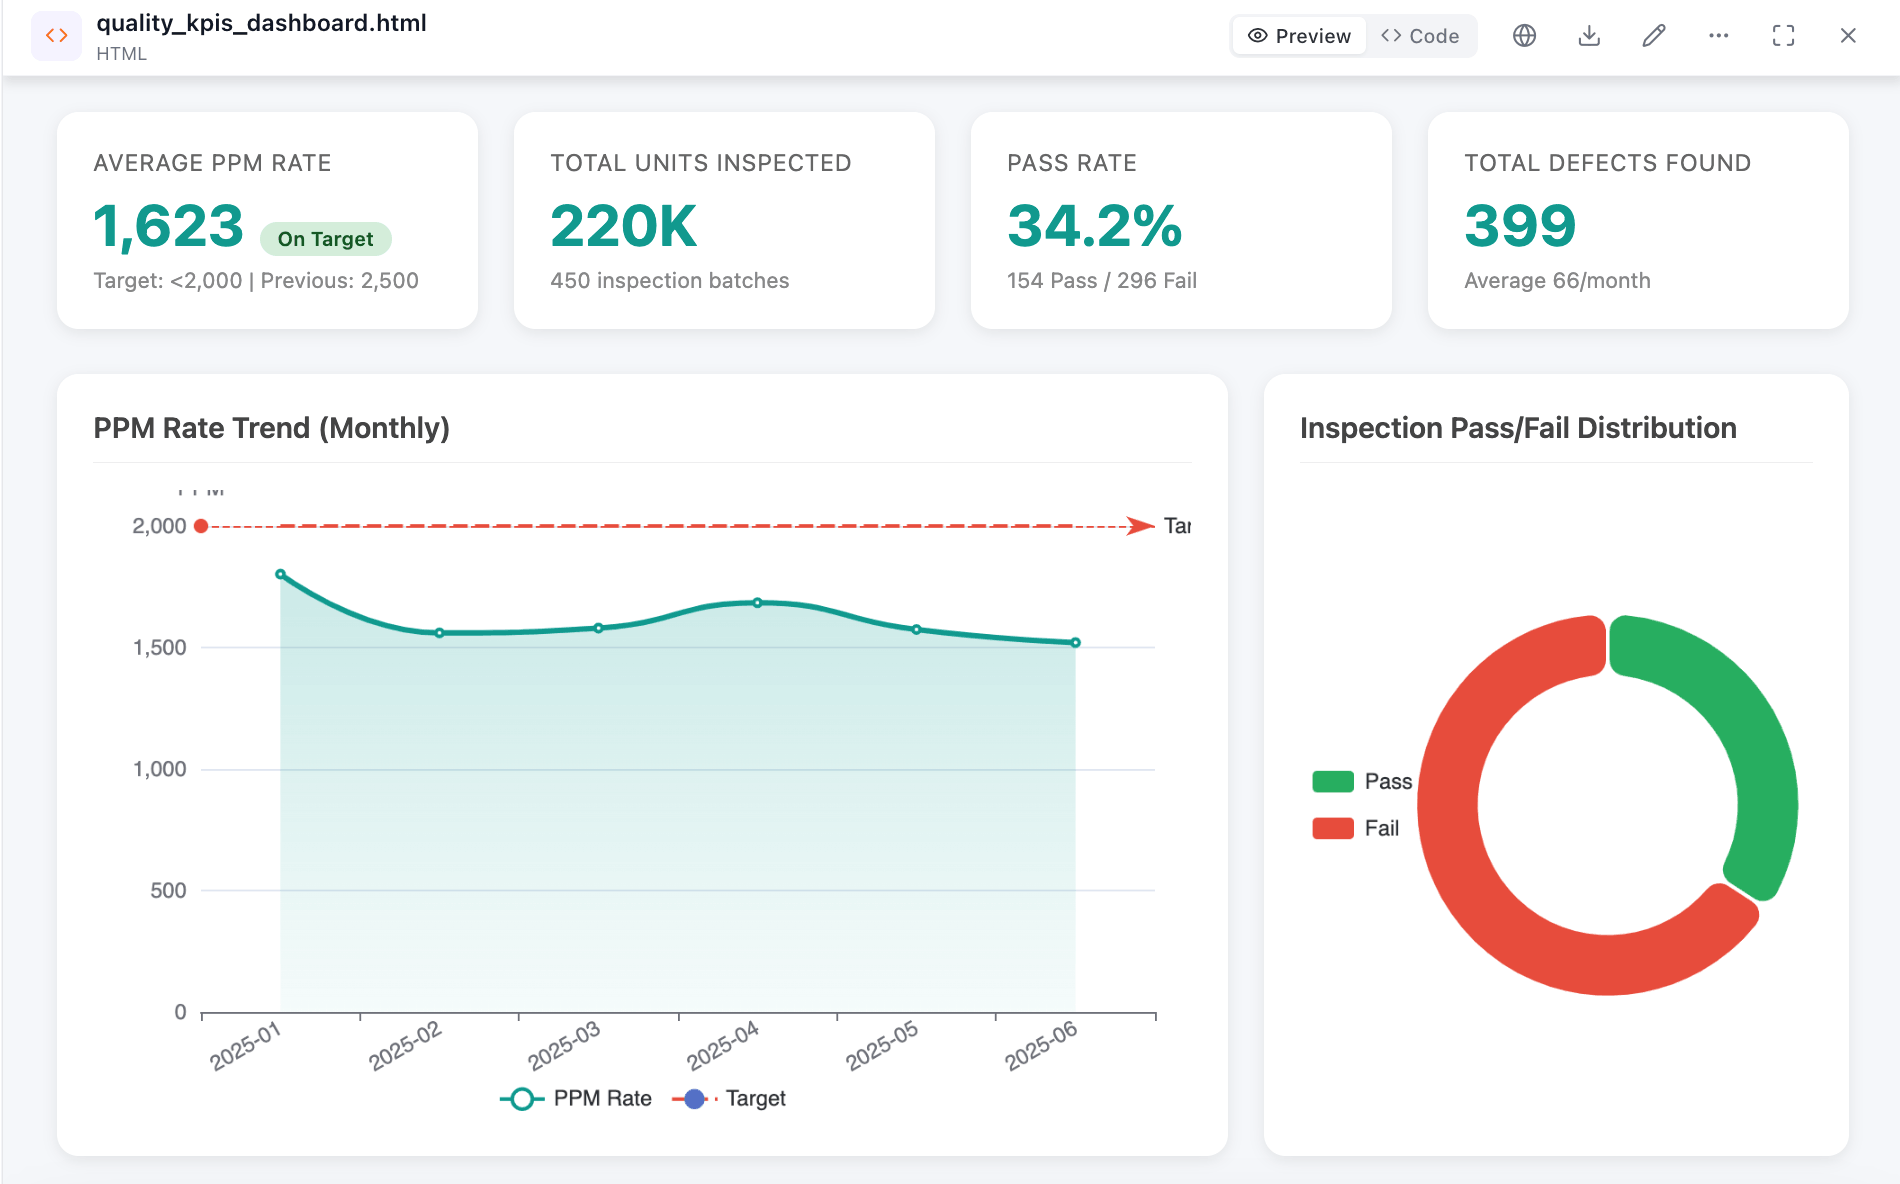
Quality isn’t just a word, it’s a promise. In today’s competitive landscape, delivering products that consistently meet and exceed customer expectations is crucial for building trust and loyalty.
By wielding these metrics like a quality inspector’s magnifying glass, you can identify even the subtlest imperfections, ensure consistent adherence to standards, and cultivate a culture of continuous improvement. This subchapter equips you with the tools to:
- discover strategies to minimize errors
- optimize processes
- implement robust quality control measures
- learn how to leverage on-time delivery
- perfect order fulfillment to transform your customers into raving fans
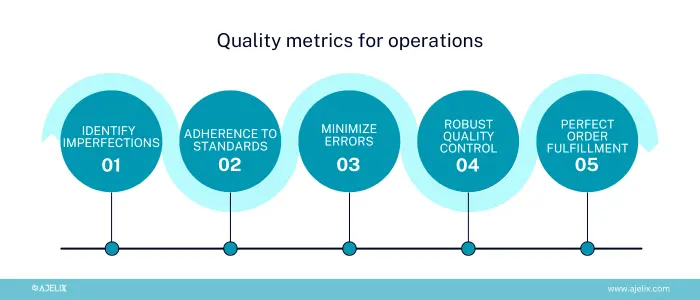
5 ways how quality metrics can improve operation process, infographic by author
Get ready to champion quality and witness the transformative power of satisfied customers. Let’s begin our journey with defect rate – the first line of defense against imperfections. For a more detailed overview check quality dashboard examples.
2.1. Defect Rate:
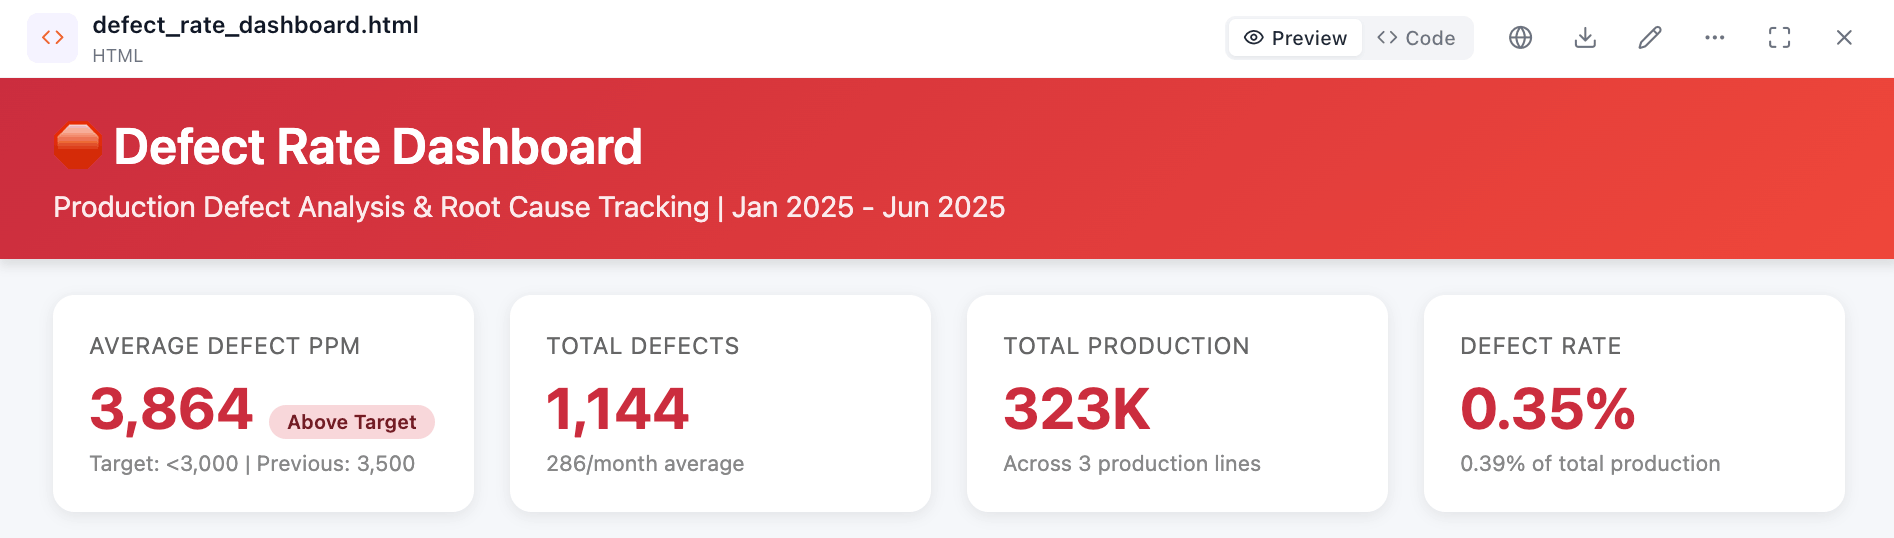
Defect Rate measures the percentage of units within a batch or over a specific period that fail to meet predefined quality standards. It acts as a harsh but honest mirror, reflecting the effectiveness of your quality control measures and production processes.
Defect Rate = (Total Defective Units / Total Produced Units) x 100%
Example: If 10 out of 1000 smartphones have screen defects, Defect Rate = (10 / 1000) x 100% = 1% (strive towards zero).
While any defect is undesirable, strive for a defect rate as close to zero as possible. Every industry has its benchmarks, but remember, even small improvements make a significant difference. A lower Defect Rate signifies consistent quality, satisfied customers, and reduced costs.
2.2. Customer Return Rate (CRR):
CRR measures the percentage of products customers return within a specific period, reflecting their satisfaction with the quality, functionality, or condition of your offerings. It acts as a barometer of customer experience, highlighting areas where your products may fall short.
CRR = (Total Returned Units / Total Sold Units) x 100%
Example: If an online clothing store receives 20 returns out of 1000 orders, CRR = (20 / 1000) x 100% = 2% (aim for a low CRR).
While some returns are expected, strive for a CRR well below industry benchmarks. Remember, every return costs you money in processing, shipping, and potential restocking fees. More importantly, high CRR indicates dissatisfied customers, impacting brand reputation and future sales.
2.3. On-Time Delivery (OTD):
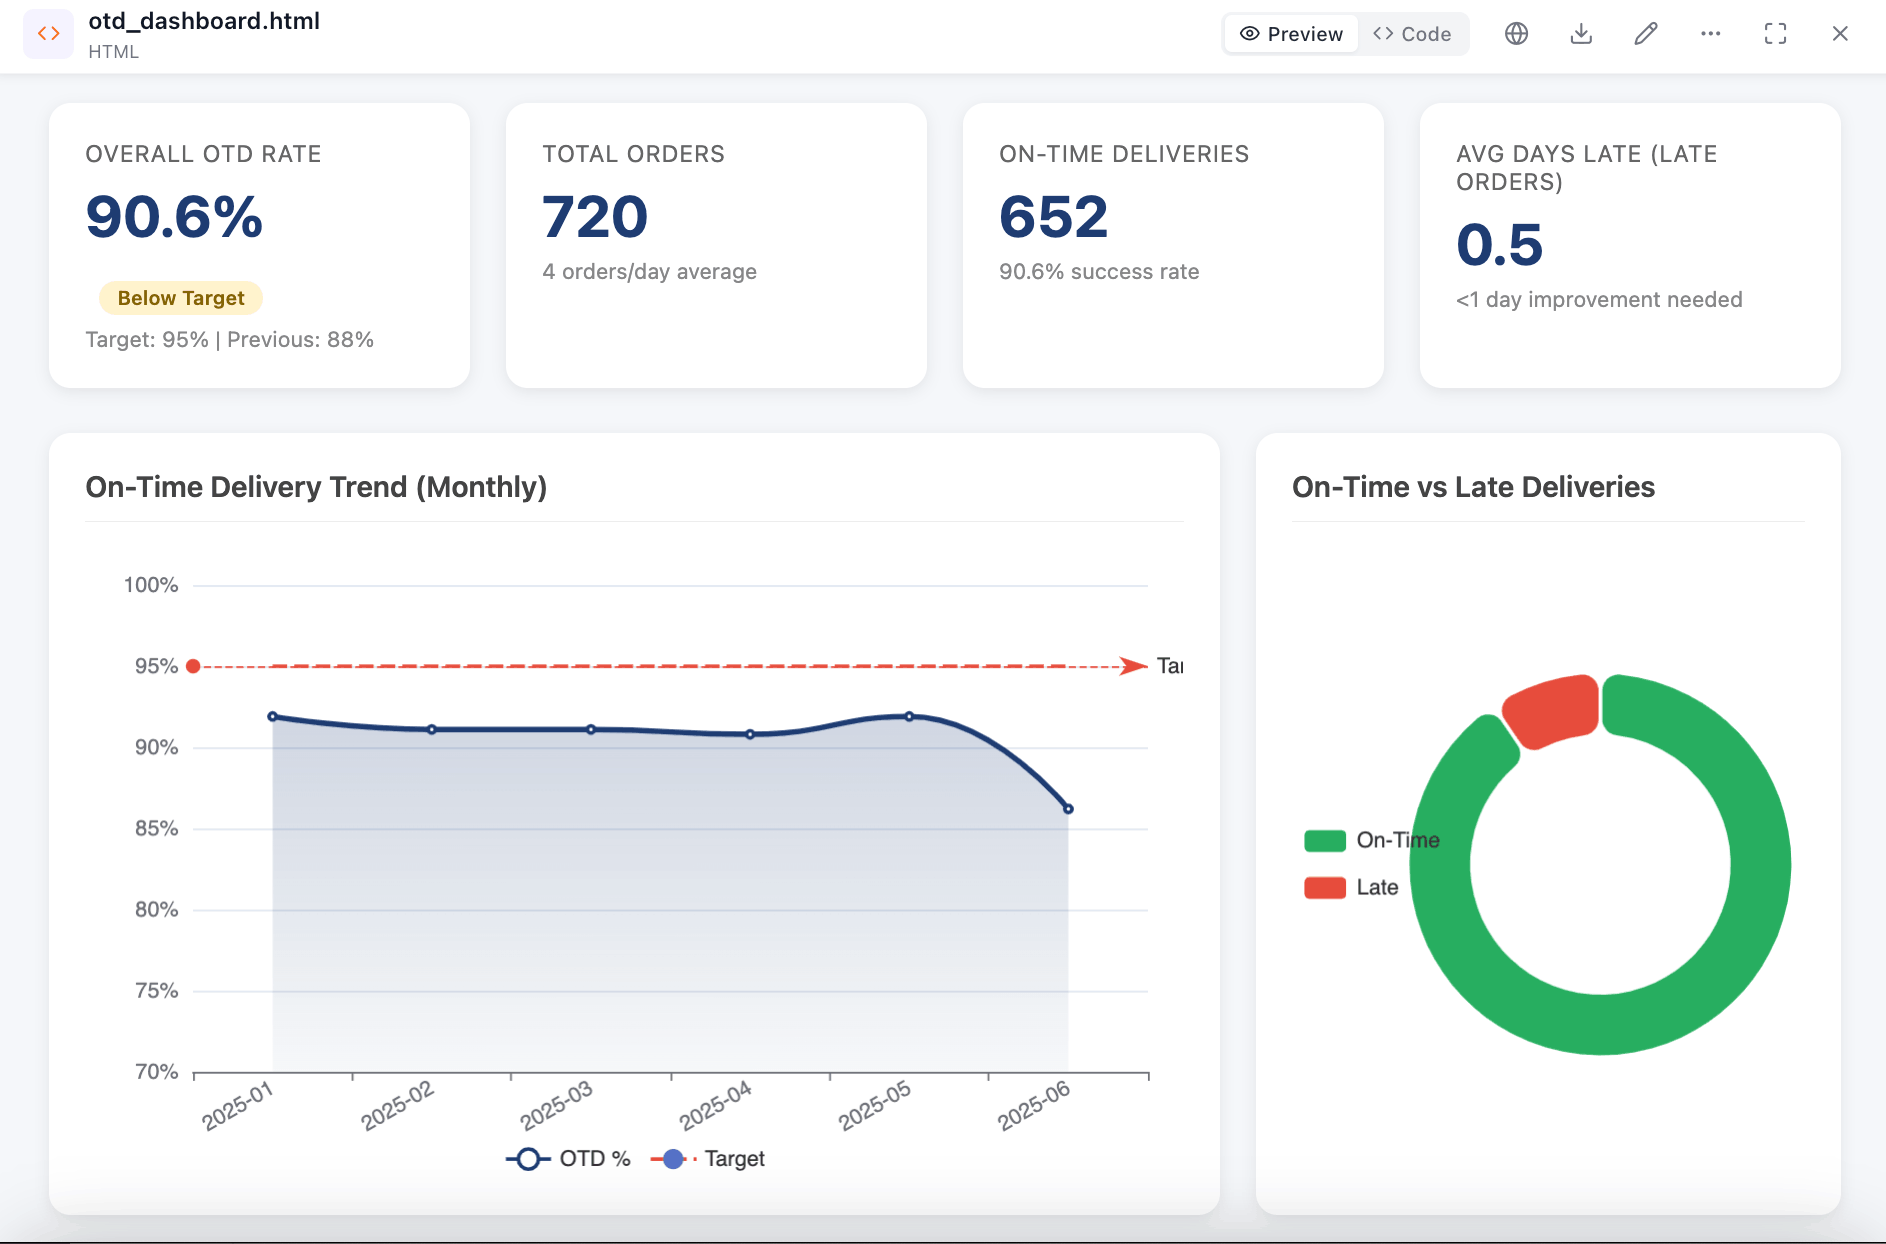
OTD measures the percentage of orders delivered to customers within the promised timeframe. It acts as a yardstick for your delivery performance, reflecting your ability to meet customer expectations and efficiently manage your supply chain.
OTD = (Orders delivered on time / Total orders shipped) x 100%
Example: If a pizza delivery service fulfills 98 out of 100 orders on time, OTD = (98 / 100) x 100% = 98% (aim for 98% or above).
While any on-time delivery is commendable, strive for an OTD of 98% or above. This signifies exceptional delivery performance, exceeding customer expectations, and solidifying your brand reputation as reliable and trustworthy.
View other KPIs’ quality metrics in this article.
3. Delivery Metrics
In today’s fast-paced world, customers crave instant gratification. They expect their orders to arrive swiftly, accurately, and without a hitch. That’s where the delivery KPIs come in – a fleet of KPIs designed to supercharge your delivery process and keep your customers happy.
By tracking and optimizing these metrics, you can transform your operation into a well-oiled delivery machine, ensuring orders zip through your system with speed and precision. This subchapter equips you with the know-how to:
- eliminate bottlenecks that slow down your delivery process
- learn how to optimize inventory levels to ensure you have the right products in the right place at the right time
- avoid stockouts and delays
- discover strategies to streamline order fulfillment
- minimize errors
- hit those all-important on-time delivery targets.
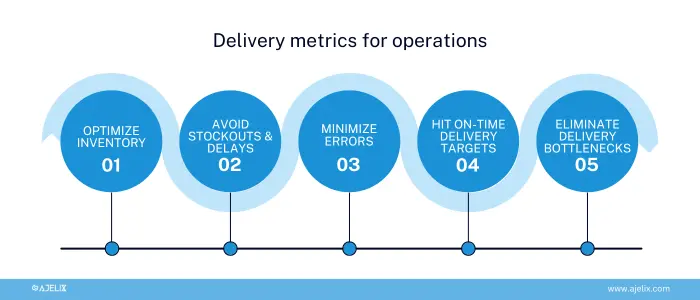
5 ways how delivery metrics can improve operation process, infographic by author
Get ready to unleash the delivery metrics and witness the magic of happy, loyal customers who keep coming back for more. Buckle up, because we’re starting with Lead Time – the key to understanding and optimizing your order fulfillment journey.
3.1. Lead Time:
Lead Time measures the total time it takes to complete a customer order, encompassing everything from receiving the order to delivering the finished product. It’s essentially the wait time your customer endures, impacting their perception of your service and brand.
Lead Time = Order fulfillment time – Order receipt time
Example: If it takes 5 days to process and deliver an order, Lead Time = 5 days (reduce this for faster customer service).
While a shorter lead time is generally preferable, consider industry benchmarks and customer expectations. Striking a balance between efficiency and cost is key. Remember, faster isn’t always better if it compromises quality or significantly increases costs.
3.2. Inventory Turnover:
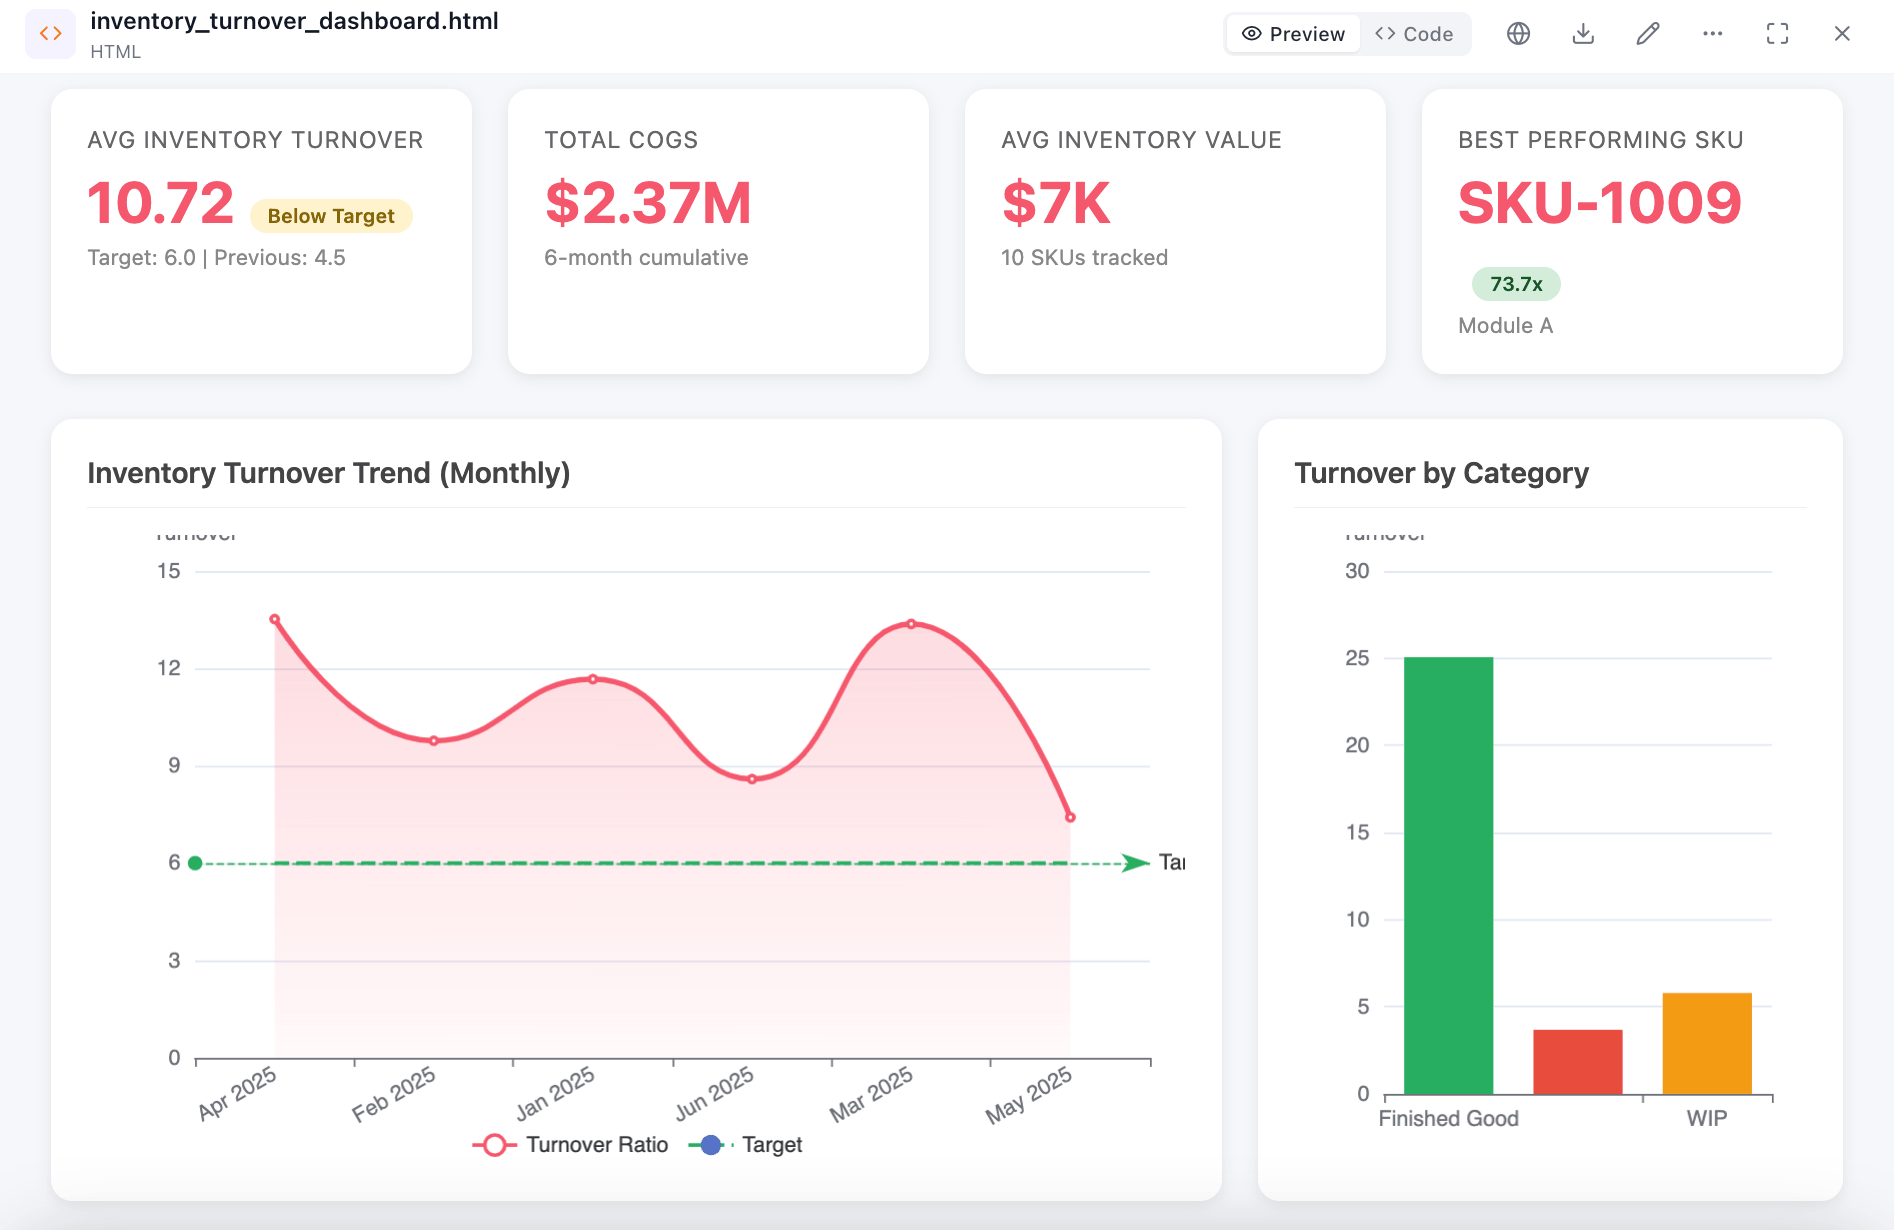
Inventory Turnover measures the number of times your inventory is sold and replaced within a specific period, typically a year. It reflects how well you manage your stock levels, balancing the need to have enough products to meet demand without overstocking and incurring unnecessary costs.
Inventory Turnover = Cost of goods sold (COGS) / Average Inventory Value
Example: If a clothing store sells $100,000 worth of goods with an average inventory value of $20,000, Inventory Turnover = $100,000 / $20,000 = 5 (higher turnover indicates efficient inventory management).
While the ideal turnover ratio varies by industry, strive for a balance between efficiency and availability. A ratio too high might indicate stockouts, while too low could tie up capital and increase storage costs.
3.4. Order Fulfillment Rate:
OFR measures the percentage of customer orders you successfully fulfill and ship on time and in full. It acts as a report card for your order management process, reflecting your ability to meet customer expectations and deliver a seamless buying experience.
OFR = (Orders fulfilled on time and in full / Total orders received) x 100%
Example: If an e-commerce store fulfills 95% of orders complete, on-time, and without errors, Perfect Order Fulfillment Rate = 95% (strive for 100%).
While any fulfilled order is commendable, strive for an OFR as close to 100% as possible. This signifies exceptional order management, exceeding customer expectations, and solidifying your brand reputation as reliable and trustworthy.
4. Cost KPIs
Every penny counts in business. In today’s competitive landscape, controlling costs and maximizing efficiency are essential for long-term success.
By wielding these metrics like a financial warrior’s sword, you can uncover hidden expenses, streamline processes, and make informed decisions that fuel profitability. This subchapter equips you with the tools to:
- discover strategies to optimize production processes
- minimize downtime
- leverage economies of scale to reduce costs
- invest in growth, not waste
- make data-driven decisions about resource allocation, ensuring your spending fuels strategic initiatives and future success.
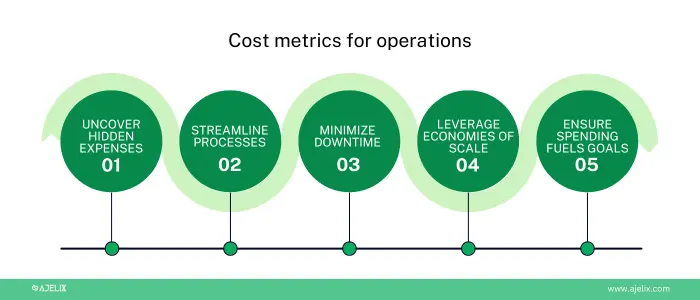
5 ways how cost metrics can improve operation process, infographic by author
4.1. Cost per Unit:
CPU measures the total cost associated with producing and delivering a single unit of your product or service. It’s essentially the price tag hidden behind every item you sell, encompassing all the expenses involved in its journey from raw materials to your customer’s hands.
Cost Per Unit = (Total Costs) / (Total Units Produced)
Example: If it costs $5 to produce a t-shirt and you make 1000, Cost per Unit = $5 / 1000 = $0.005 (continuously seek cost reduction).
While the ideal CPU varies by industry and product, strive to continuously identify and eliminate inefficiencies, ultimately aiming for a competitive and profitable cost per unit.
4.2. Overhead Cost Ratio:
The OCR measures the percentage of your total revenue consumed by indirect, or overhead, costs. These costs don’t directly contribute to producing your goods or services, but are essential for your business to function, like rent, utilities, salaries for administrative staff, marketing expenses, and depreciation.
OCR = (Total Overhead Costs / Total Revenue) x 100%
Example: If a manufacturing company has $10,000 in overhead costs and $50,000 in total operating expenses, Overhead Cost Ratio = $10,000 / $50,00
While the ideal OCR varies, strive to continuously reduce your overhead costs without compromising essential functions. A well-managed OCR signifies efficient operations and contributes to improved profitability.
Download the Operational KPI Template

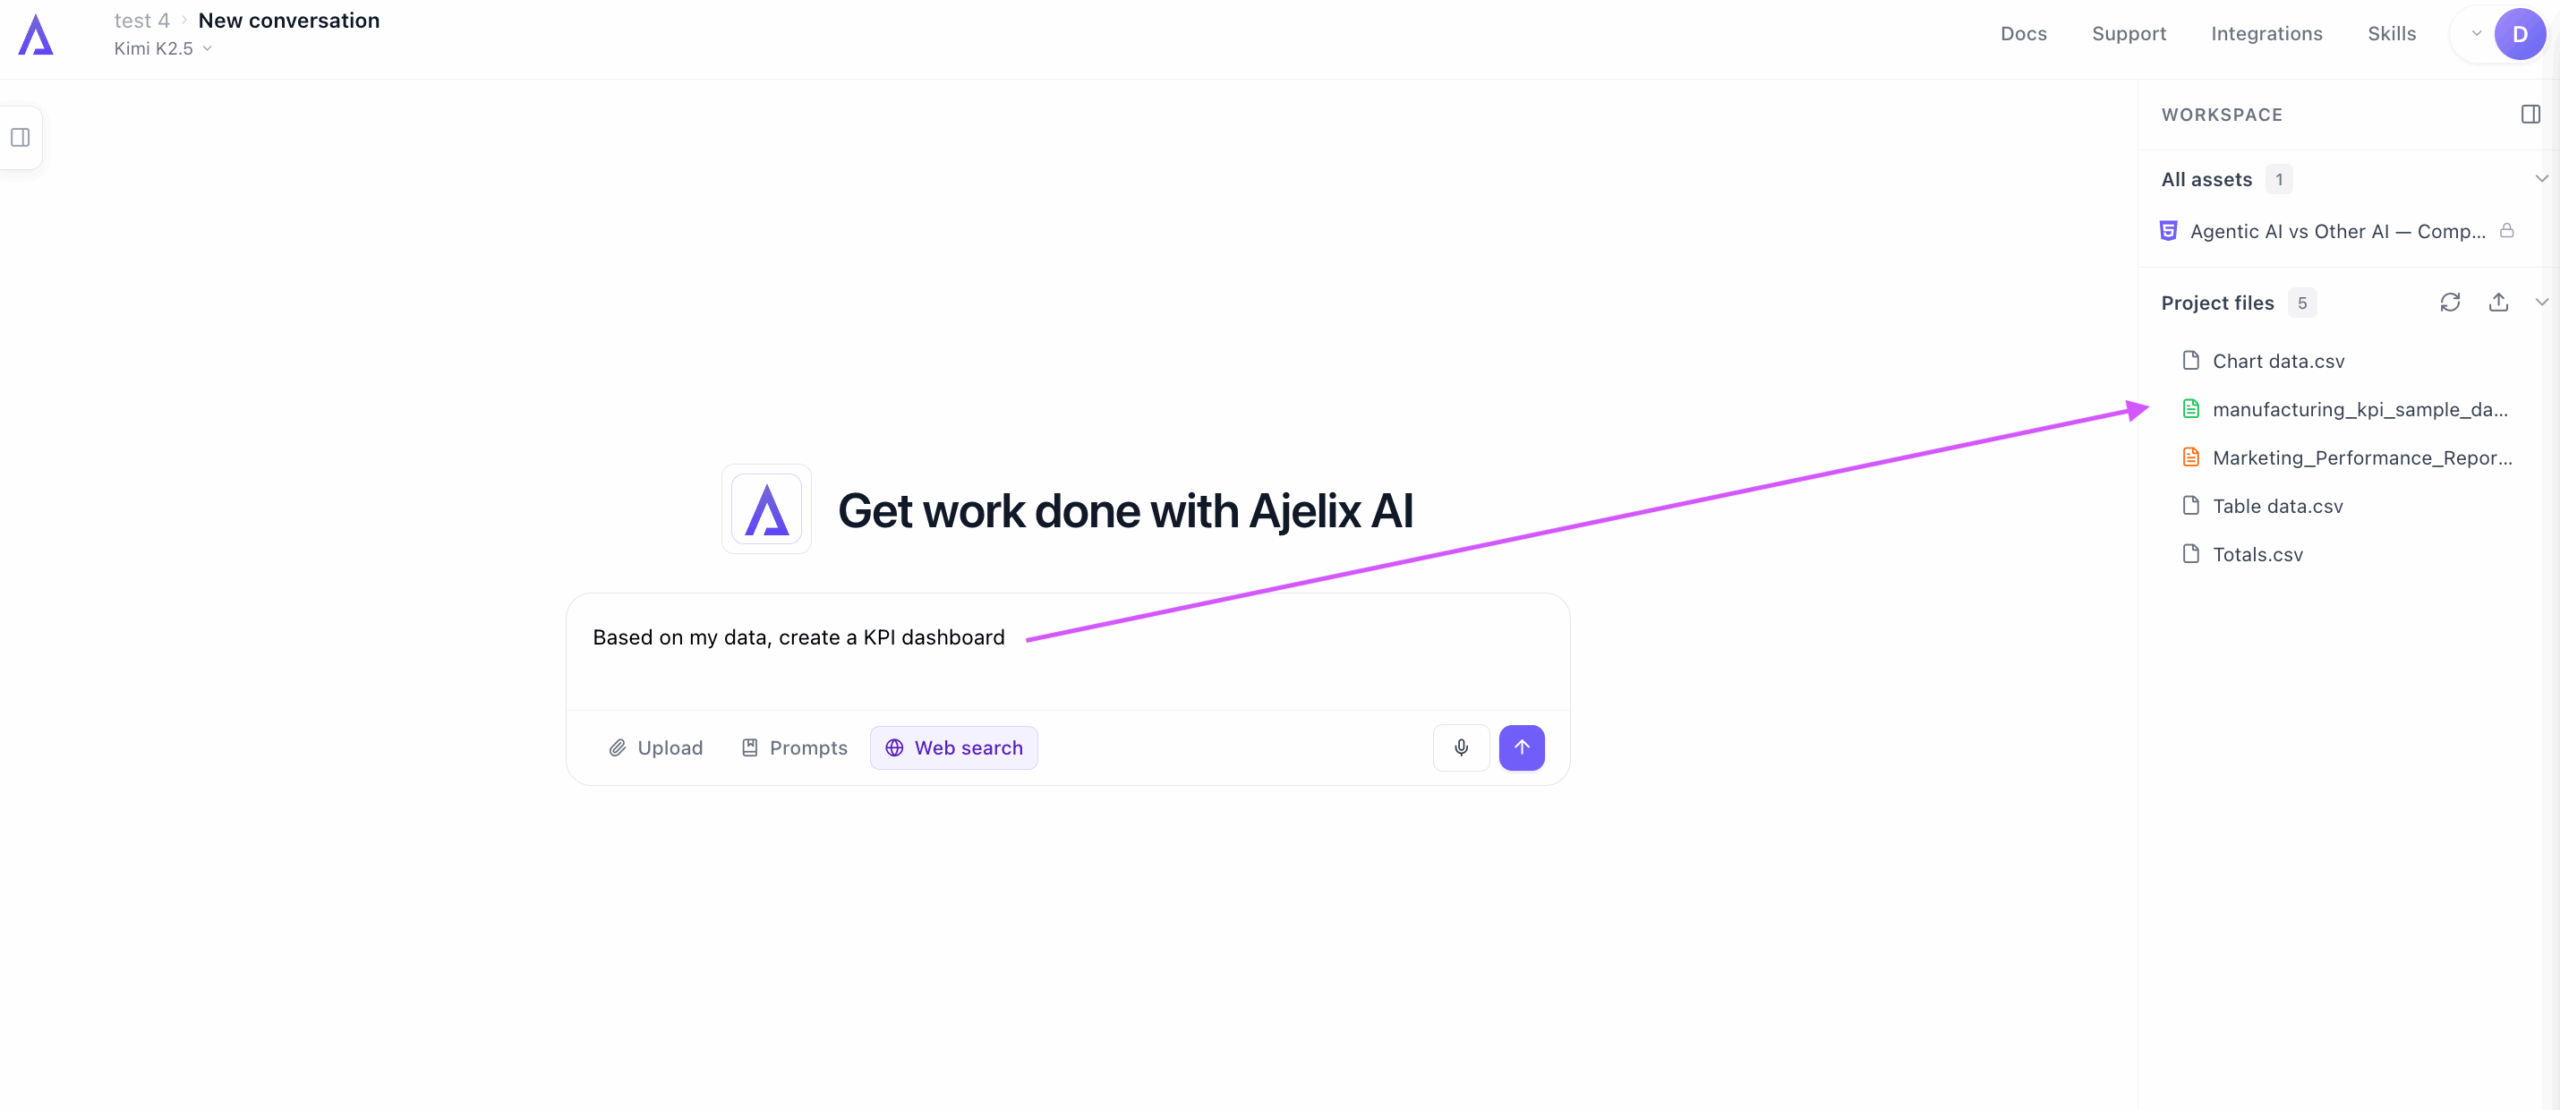
How To Create a KPI Dashboard?
This guide will walk you through creating a KPI (Key Performance Indicator) dashboard using an Ajelix AI agent. While specific steps may vary depending on the agent you use, the general process remains similar.
- Add the prompt and connect your data
Here you can simply upload your Excel, CSV, or Google Sheets file. Write the prompt depending on what you need.
- Accept the work plan
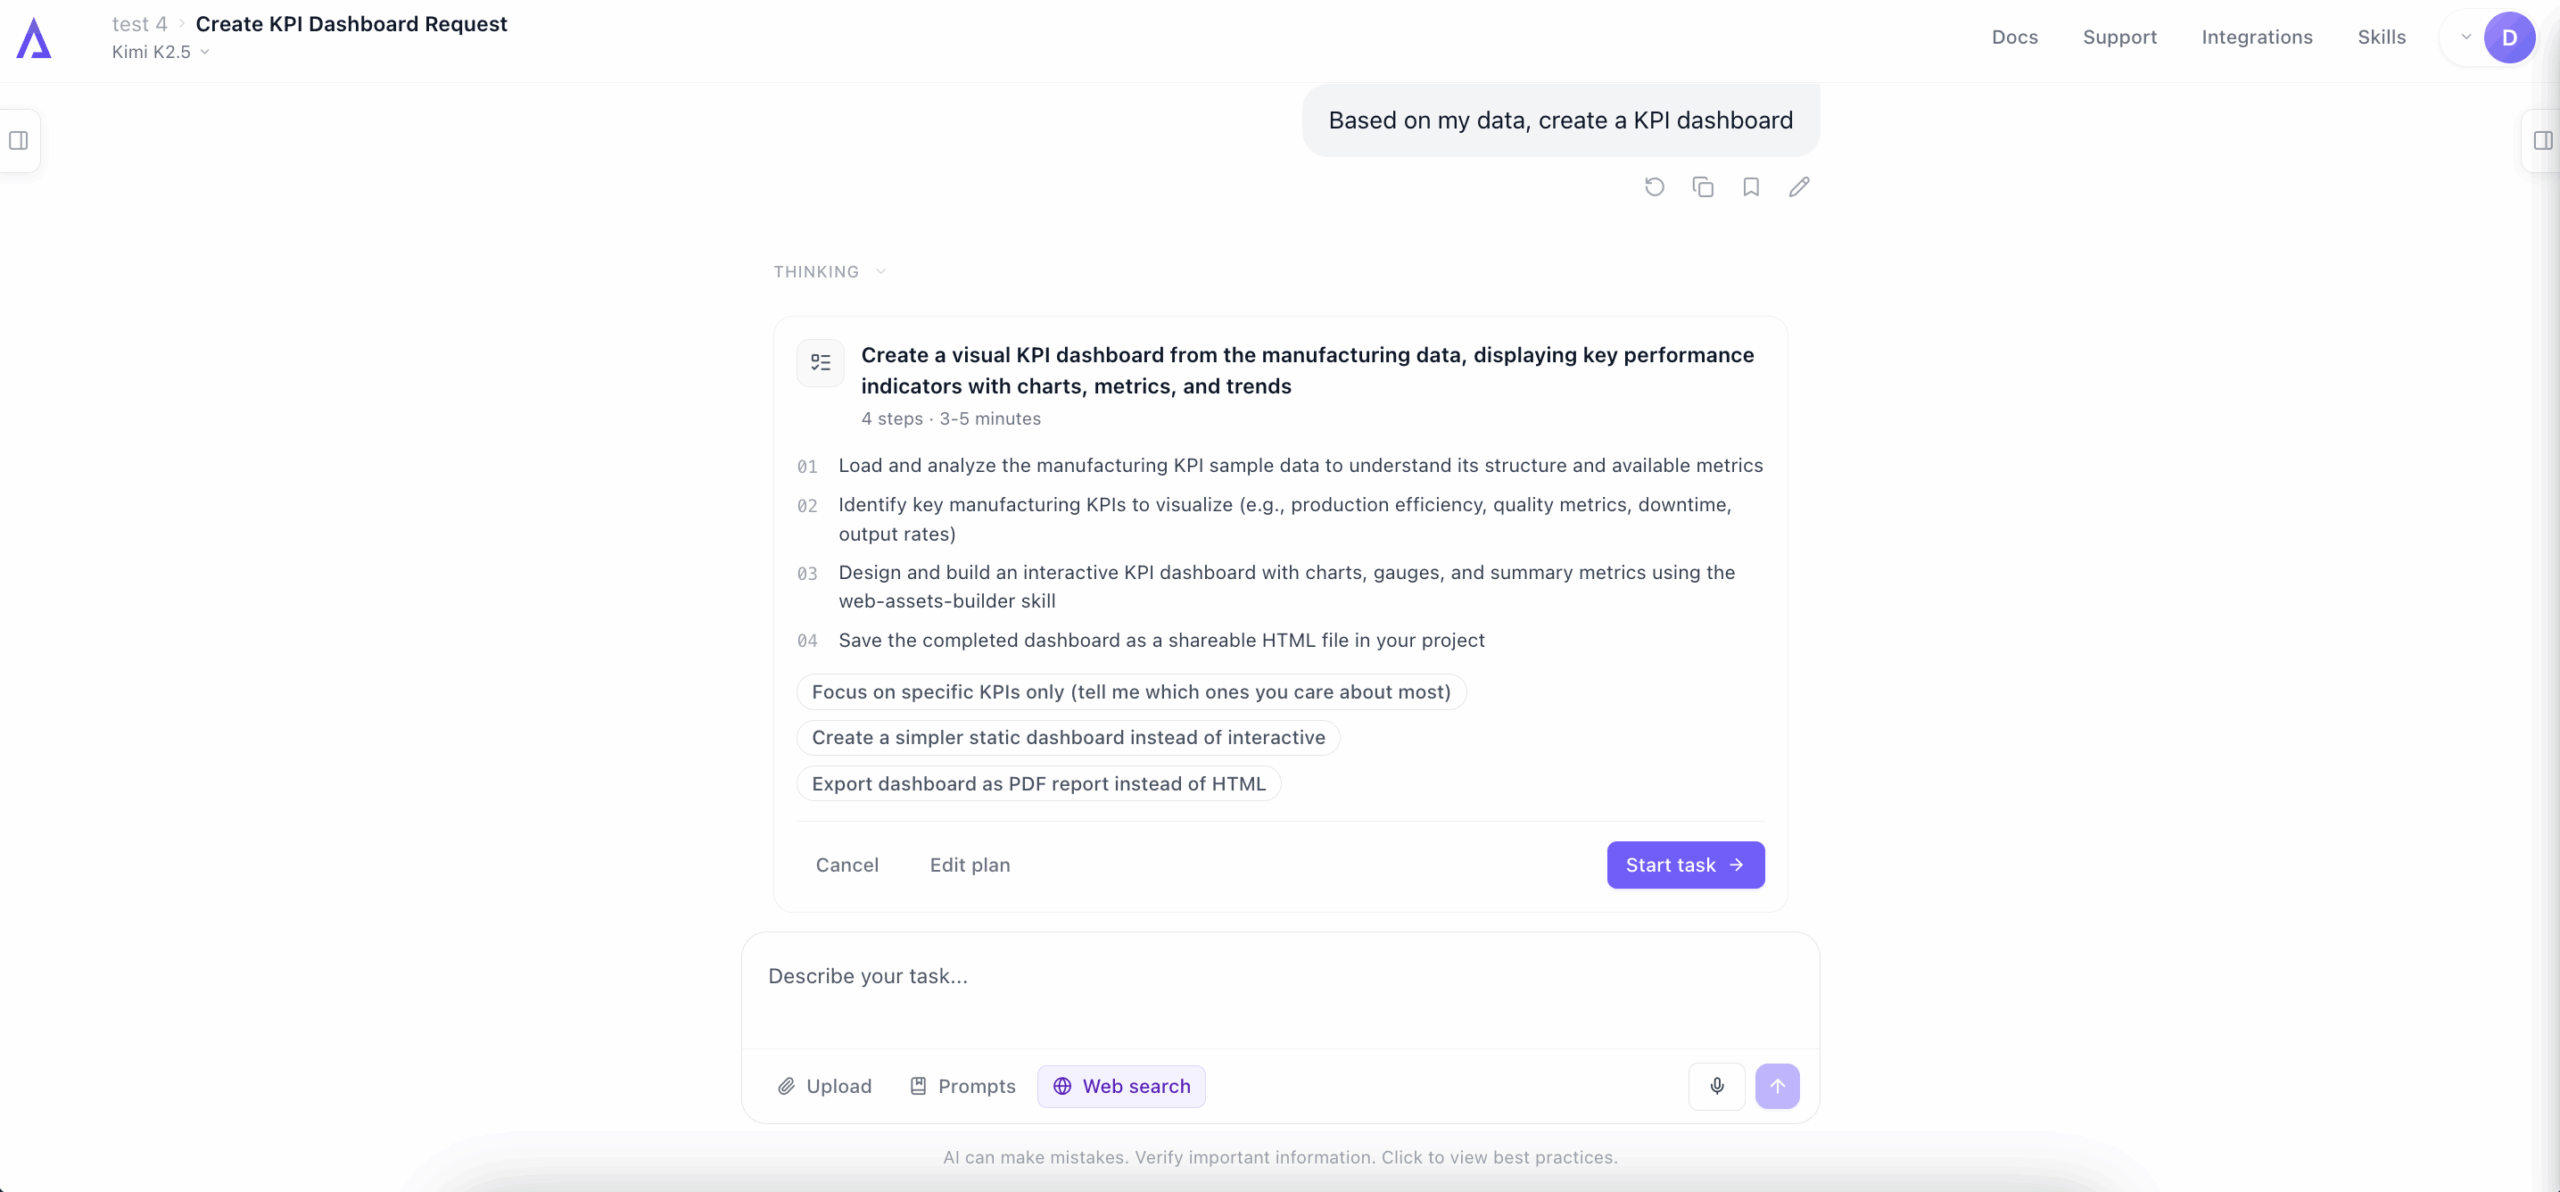
- Wait for the dashboard to generate
This is when you can send follow-up prompts if you aren’t happy with formatting or anything else.
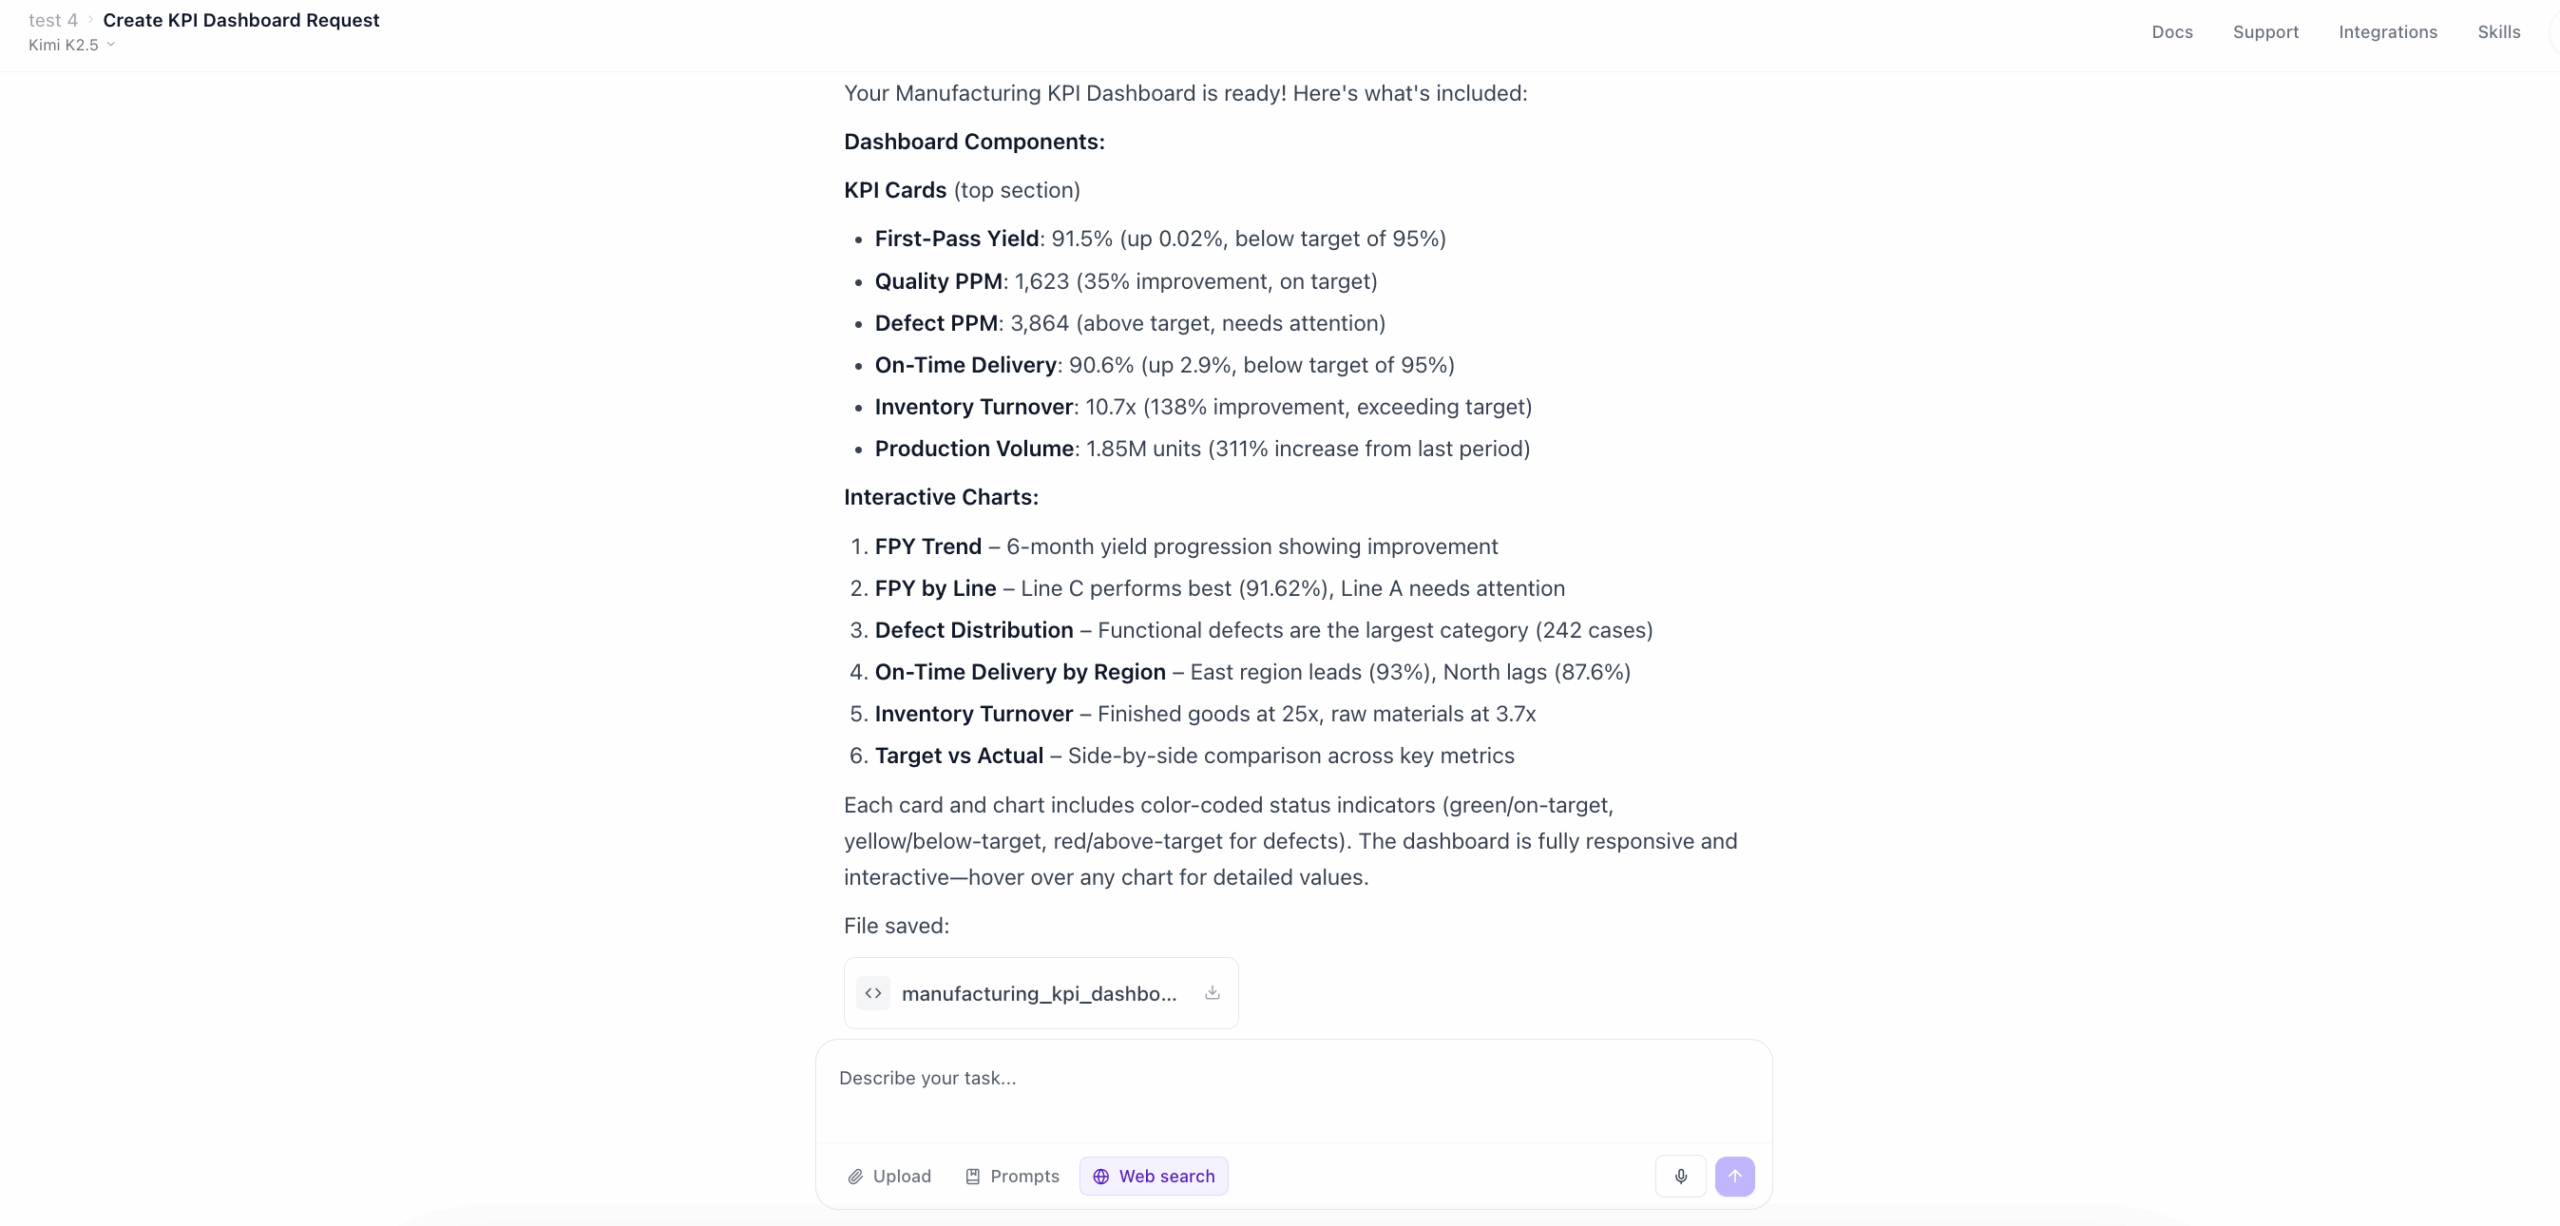
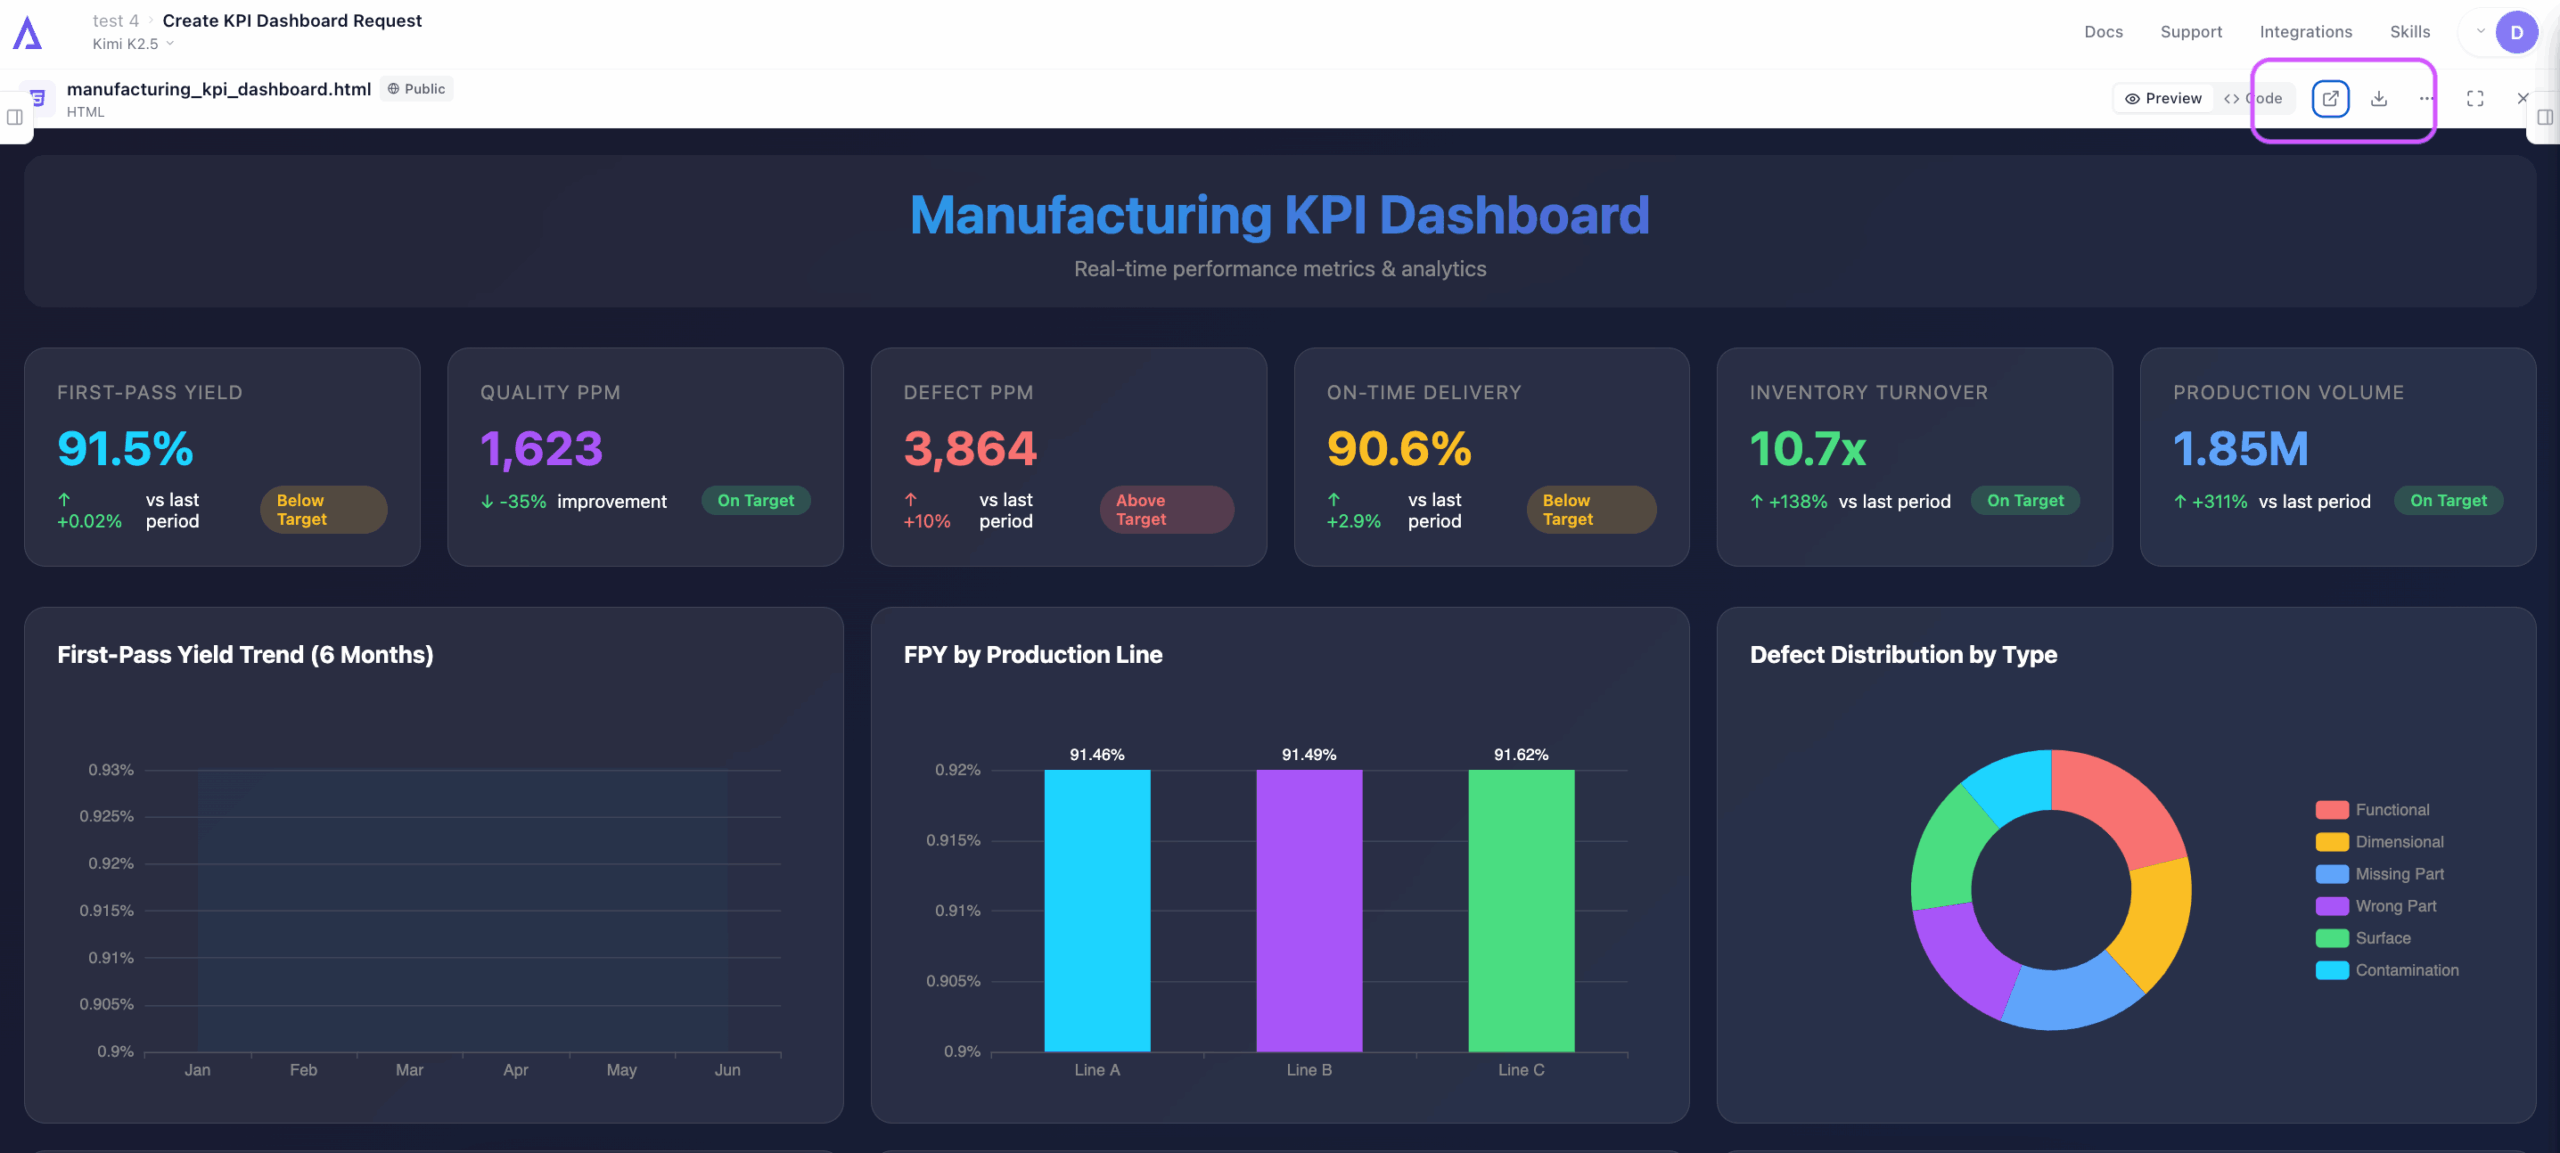
- Share or download your dashboard
Once happy, publish your dashboard and share it OR download it.
Before you begin answer to these questions:
- Identify your KPIs: Decide on the key metrics you want to track. Focus on a handful that are most important to your goals.
- Gather your data: Ensure your data is accurate and organized. This might involve connecting to databases, spreadsheets, or cloud storage.
- Choose your tool: You can use Ajelix AI agent or any other agent of your choice. Some offer free trials or tiers.
Tips:
- Keep your dashboard focused and easy to understand. Learn more about data visualization principles.
- Use clear labels and concise text. Check dashboard formatting and customization.
- Color-code elements for easy comparison.
- Allow users to filter data for deeper analysis (optional, depending on the tool).
Conclusion
Operational KPIs provide objective insights into various aspects of operations. KPIs help identify areas for improvement, measure progress and success, make data-driven decisions, and boost team accountability.
The 11 most important operational KPIs for operations managers include Overall Equipment Effectiveness, First-Pass Yield, Throughput, Defect Rate, Customer Return Rate, On-Time Delivery, Inventory Turnover, and Order Fulfillment Rate. Productivity Metrics are a group of key performance indicators (KPIs) designed to supercharge production output and optimize resources.
By tracking and analyzing productivity metrics, you can identify bottlenecks, eliminate waste, maximize the performance of equipment, workforce, and processes.
FAQ
The ideal tracking frequency for KPIs depends on the KPI itself. Fast-changing metrics (e.g., production line speed) might need daily checks while slower-moving ones (e.g., annual turnover) can be tracked quarterly or even yearly.
The most popular efficiency KPIs are production cycle time, machine downtime, labor utilization, inventory turnover, and throughputs.
To assess quality, operations managers can track several key metrics. These include defect rates (percentage of faulty products), rework rates (products needing fixes), customer complaints (dissatisfaction with quality), yield rate (usable products from raw materials), and first-time quality (products completed correctly on the first attempt).
Absolutely. Tracking too many KPIs can lead to information overload, making it difficult to focus on what truly matters. Aim for a manageable number that reflects your most critical operational goals.
From data to report in one minute or less with Ajelix AI Agents


