Collaborative Business Intelligence (BI) & Analytics

Imagine a world where everyone in your organization, from sales reps to executives, can easily access, analyze, and discuss data together. Collaborative business intelligence (BI) & Analytics breaks down barriers and empowers teams to work together, transforming data into actionable insights.
TL;DR
Collaborative BI lets everyone in an organization access, analyze, and discuss data together, breaking silos and speeding up data-driven decisions. It improves communication, democratizes data, reduces bias, and boosts adoption of analytics. Teams use it for shared dashboards in sales/marketing, product development, supply chain, HR, and finance. To build a collaborative analytics culture, organizations should promote data literacy, adopt self-service BI tools, integrate collaboration platforms, break down data silos, and establish clear governance. Popular tools include Ajelix, Tableau, Power BI, Looker, Domo, and Zoho Analytics.
Change the way you work with agentic AI
One-click dashboards,KPI tracking, and AI-powered insights—for work that actually gets done.

What is Collaborative BI & Analytics?
Collaborative BI is when everyone in your organization, from sales representatives to marketing managers to executives, can easily access, analyze, and discuss data.
Collaborative BI & Analytics goes beyond traditional BI, which focuses on generating reports and dashboards for specific audiences. Instead, collaborative analytics integrates with collaboration platforms or offers easy report sharing across departments to work together on the entire data analysis process.
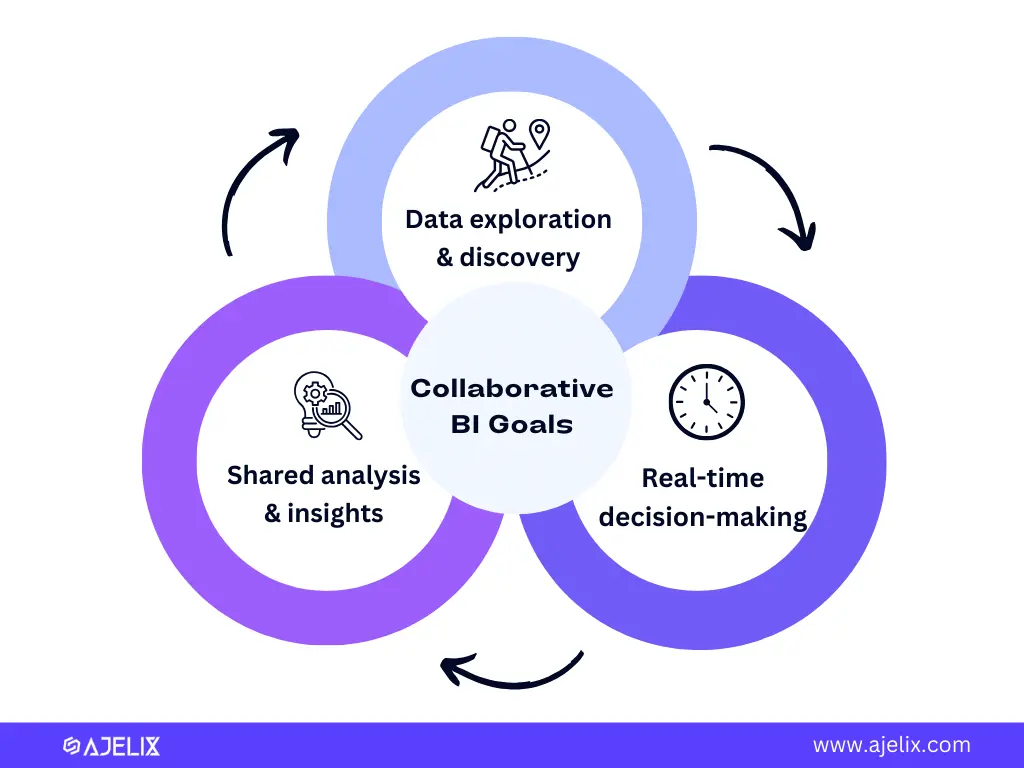
Main goals:
- Data exploration and discovery: Teams can work together to uncover hidden patterns, trends, and correlations within large datasets.
- Shared analysis and insights: Users can collaborate on building reports, visualizations, and dashboards, ensuring everyone has a unified understanding of the data.
- Real-time discussion and decision-making: Collaborative features allow teams to discuss findings, ask questions, and make data-driven decisions quickly and efficiently.
Benefits of Collaborative BI
Traditional BI tools, while valuable, can sometimes create a one-way street for data insights. Collaborative BI flips the script by transforming data analysis into a team sport. This shift towards collaboration offers several benefits to organizations, propelling them toward data-driven success.
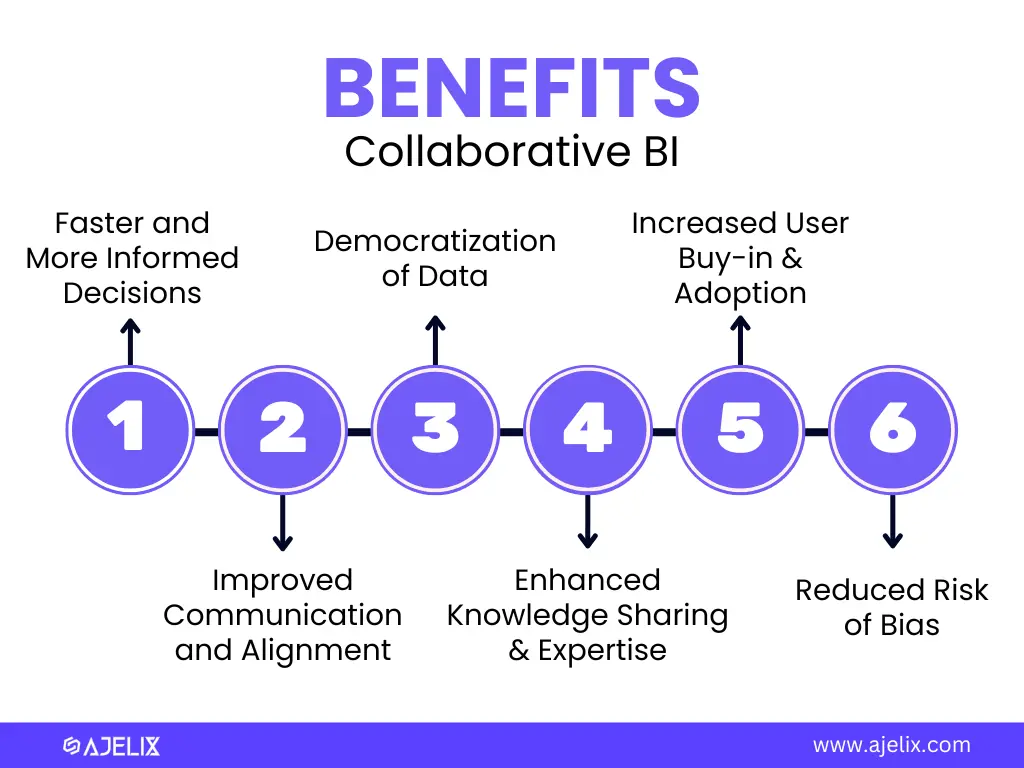
- Faster and More Informed Decisions: Collaborative BI fosters a culture of shared insights. Teams can discuss findings, ask questions, and challenge assumptions in real-time.
- Improved Communication and Alignment: By working together on data analysis, the accounting department can collaborate with the marketing department to break down information silos and gain a unified understanding of the business landscape.
- Democratization of Data: Collaborative BI empowers everyone, not just data analysts, to leverage the power of data.
- Enhanced Knowledge Sharing and Expertise: Collaboration platforms facilitate knowledge and expertise exchange between team members.
- Increased User Buy-in and Adoption: When users are actively involved in the data analysis process, they are more likely to trust and adopt the resulting insights.
- Reduced Risk of Bias: Individual biases can skew data interpretation. Collaborative analysis allows diverse perspectives, leading to a more well-rounded and objective view.
As highlighted, the shift toward collaborative business intelligence improves decision-making and communication, with the marketing director of Time Tailor noting, “Democratizing data access and enabling teams to analyze trends together accelerates decision-making and ensures campaigns are more data-driven and relevant.” This approach has helped break down silos and foster a culture of continuous learning and agility.
5 Ways Businesses Use Collaborative Analytics
We’ve explored the what and the why of Collaborative BI, but now let’s dive into the practical: how do businesses actually use it? Here are some real-world scenarios where teams can work together and unlock the power of data.
#1 Sales and Marketing Dashboard
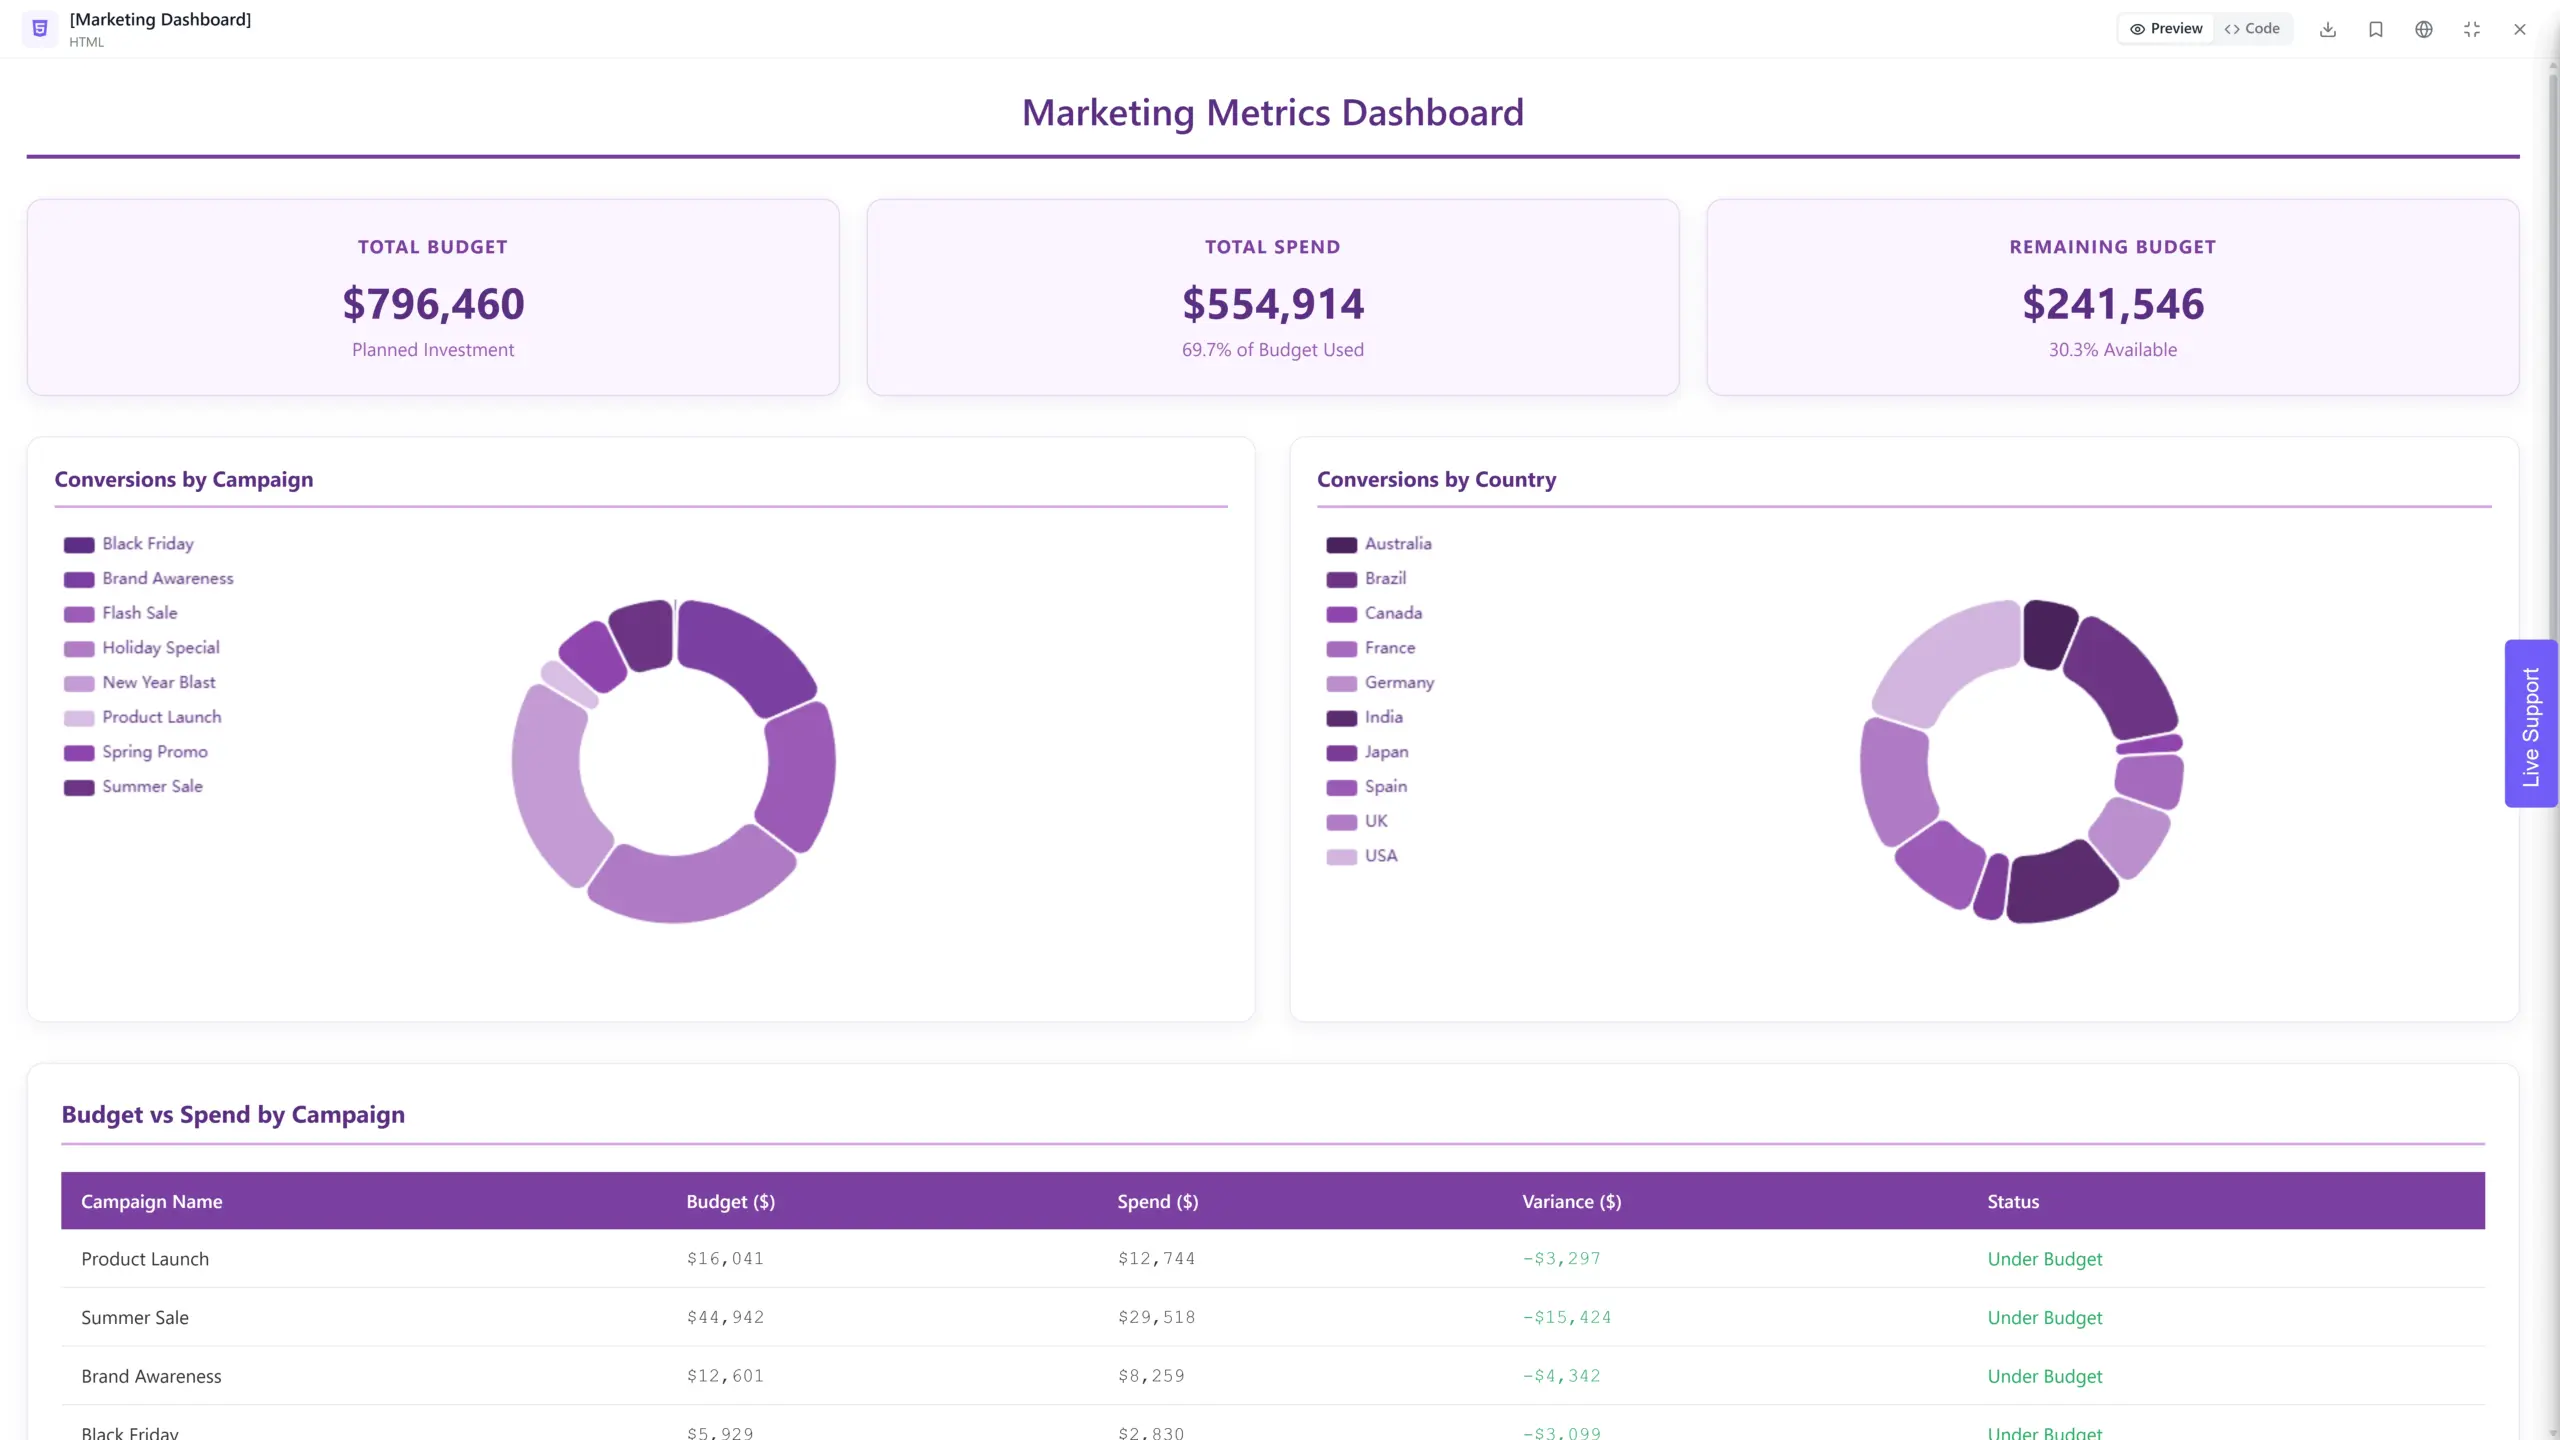
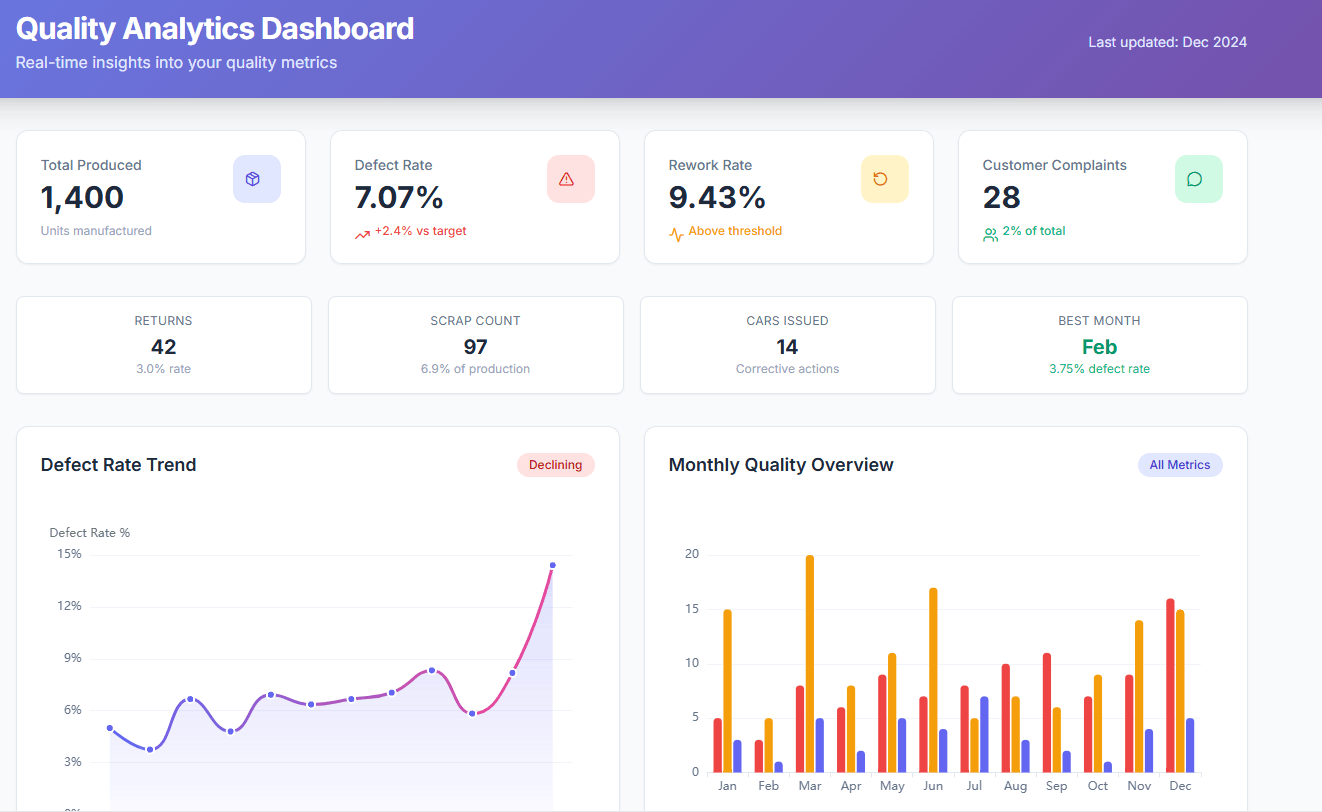
Imagine sales and marketing teams working on a collaborative dashboard. They can analyze customer data together, identify trends in buying behavior, and develop targeted marketing campaigns that resonate with their audience. Check the CMO dashboard example and metrics for marketing departments.
#2 Product Development with Customer Feedback
A product development team can use BI platform to analyze customer reviews and social media sentiment. This helps them collaborate with marketing and customer service to identify areas for improvement and develop data-driven product enhancements.
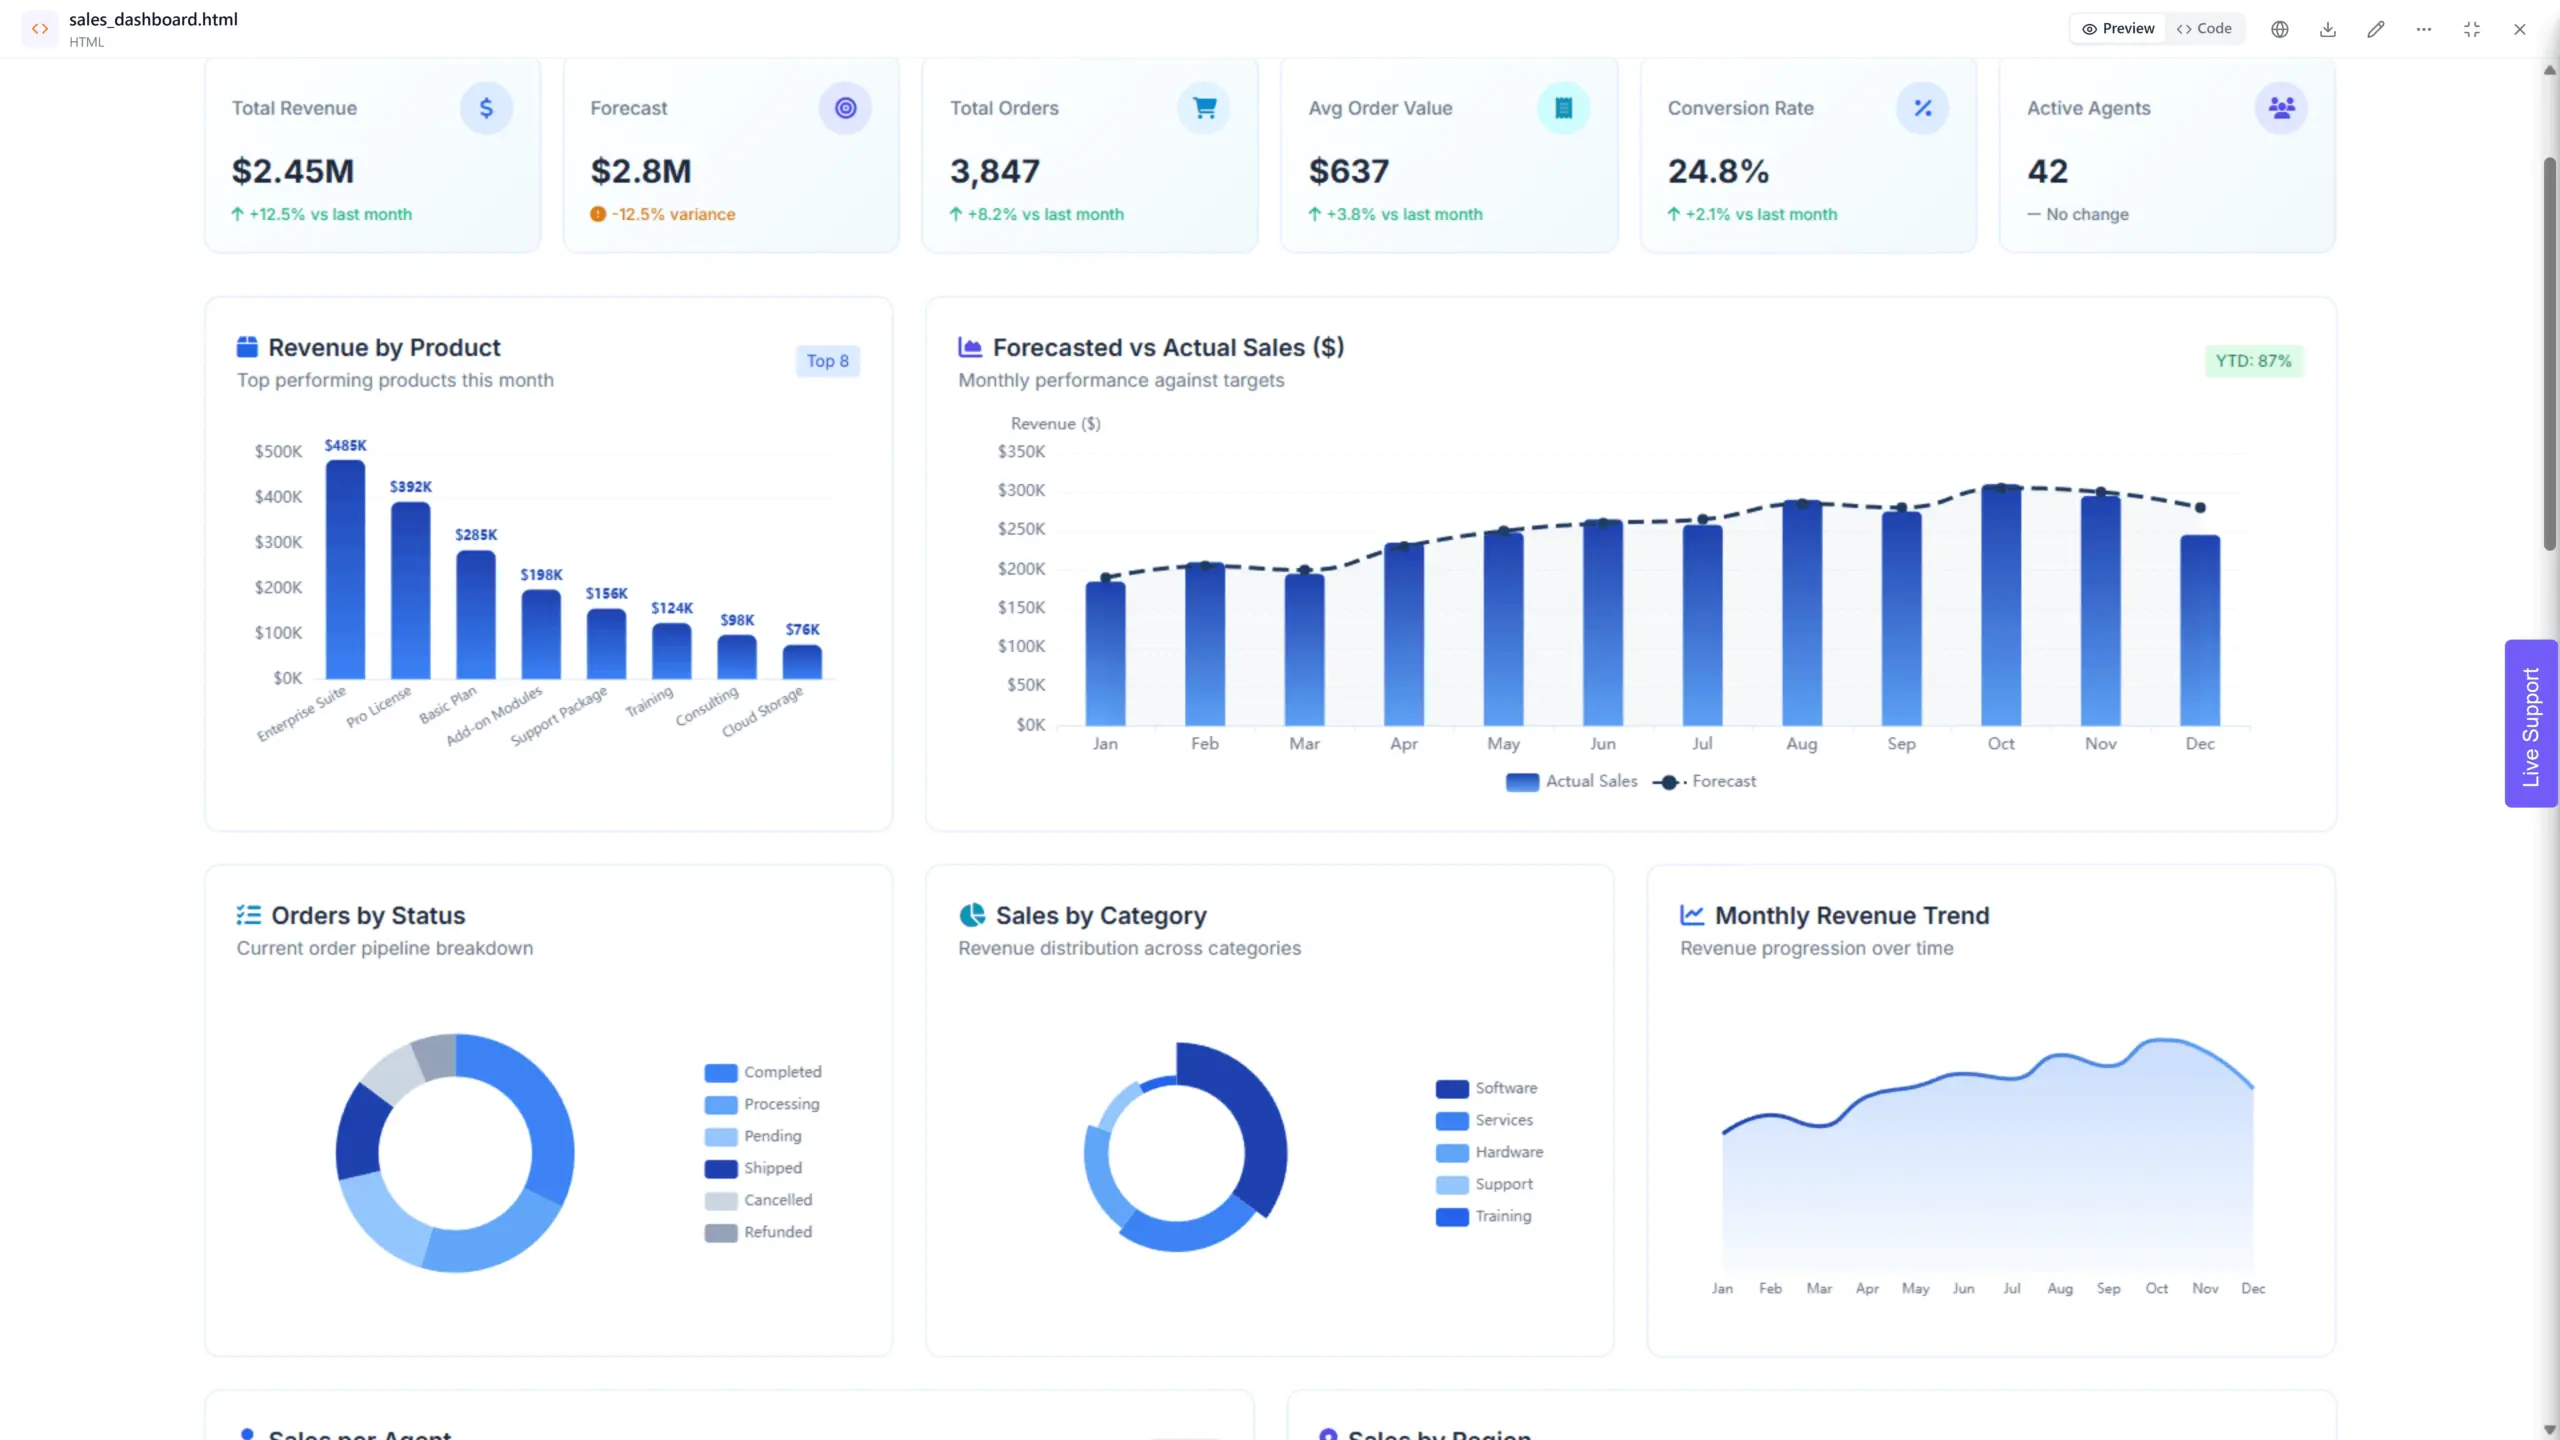
#3 Real-Time Supply Chain Optimization
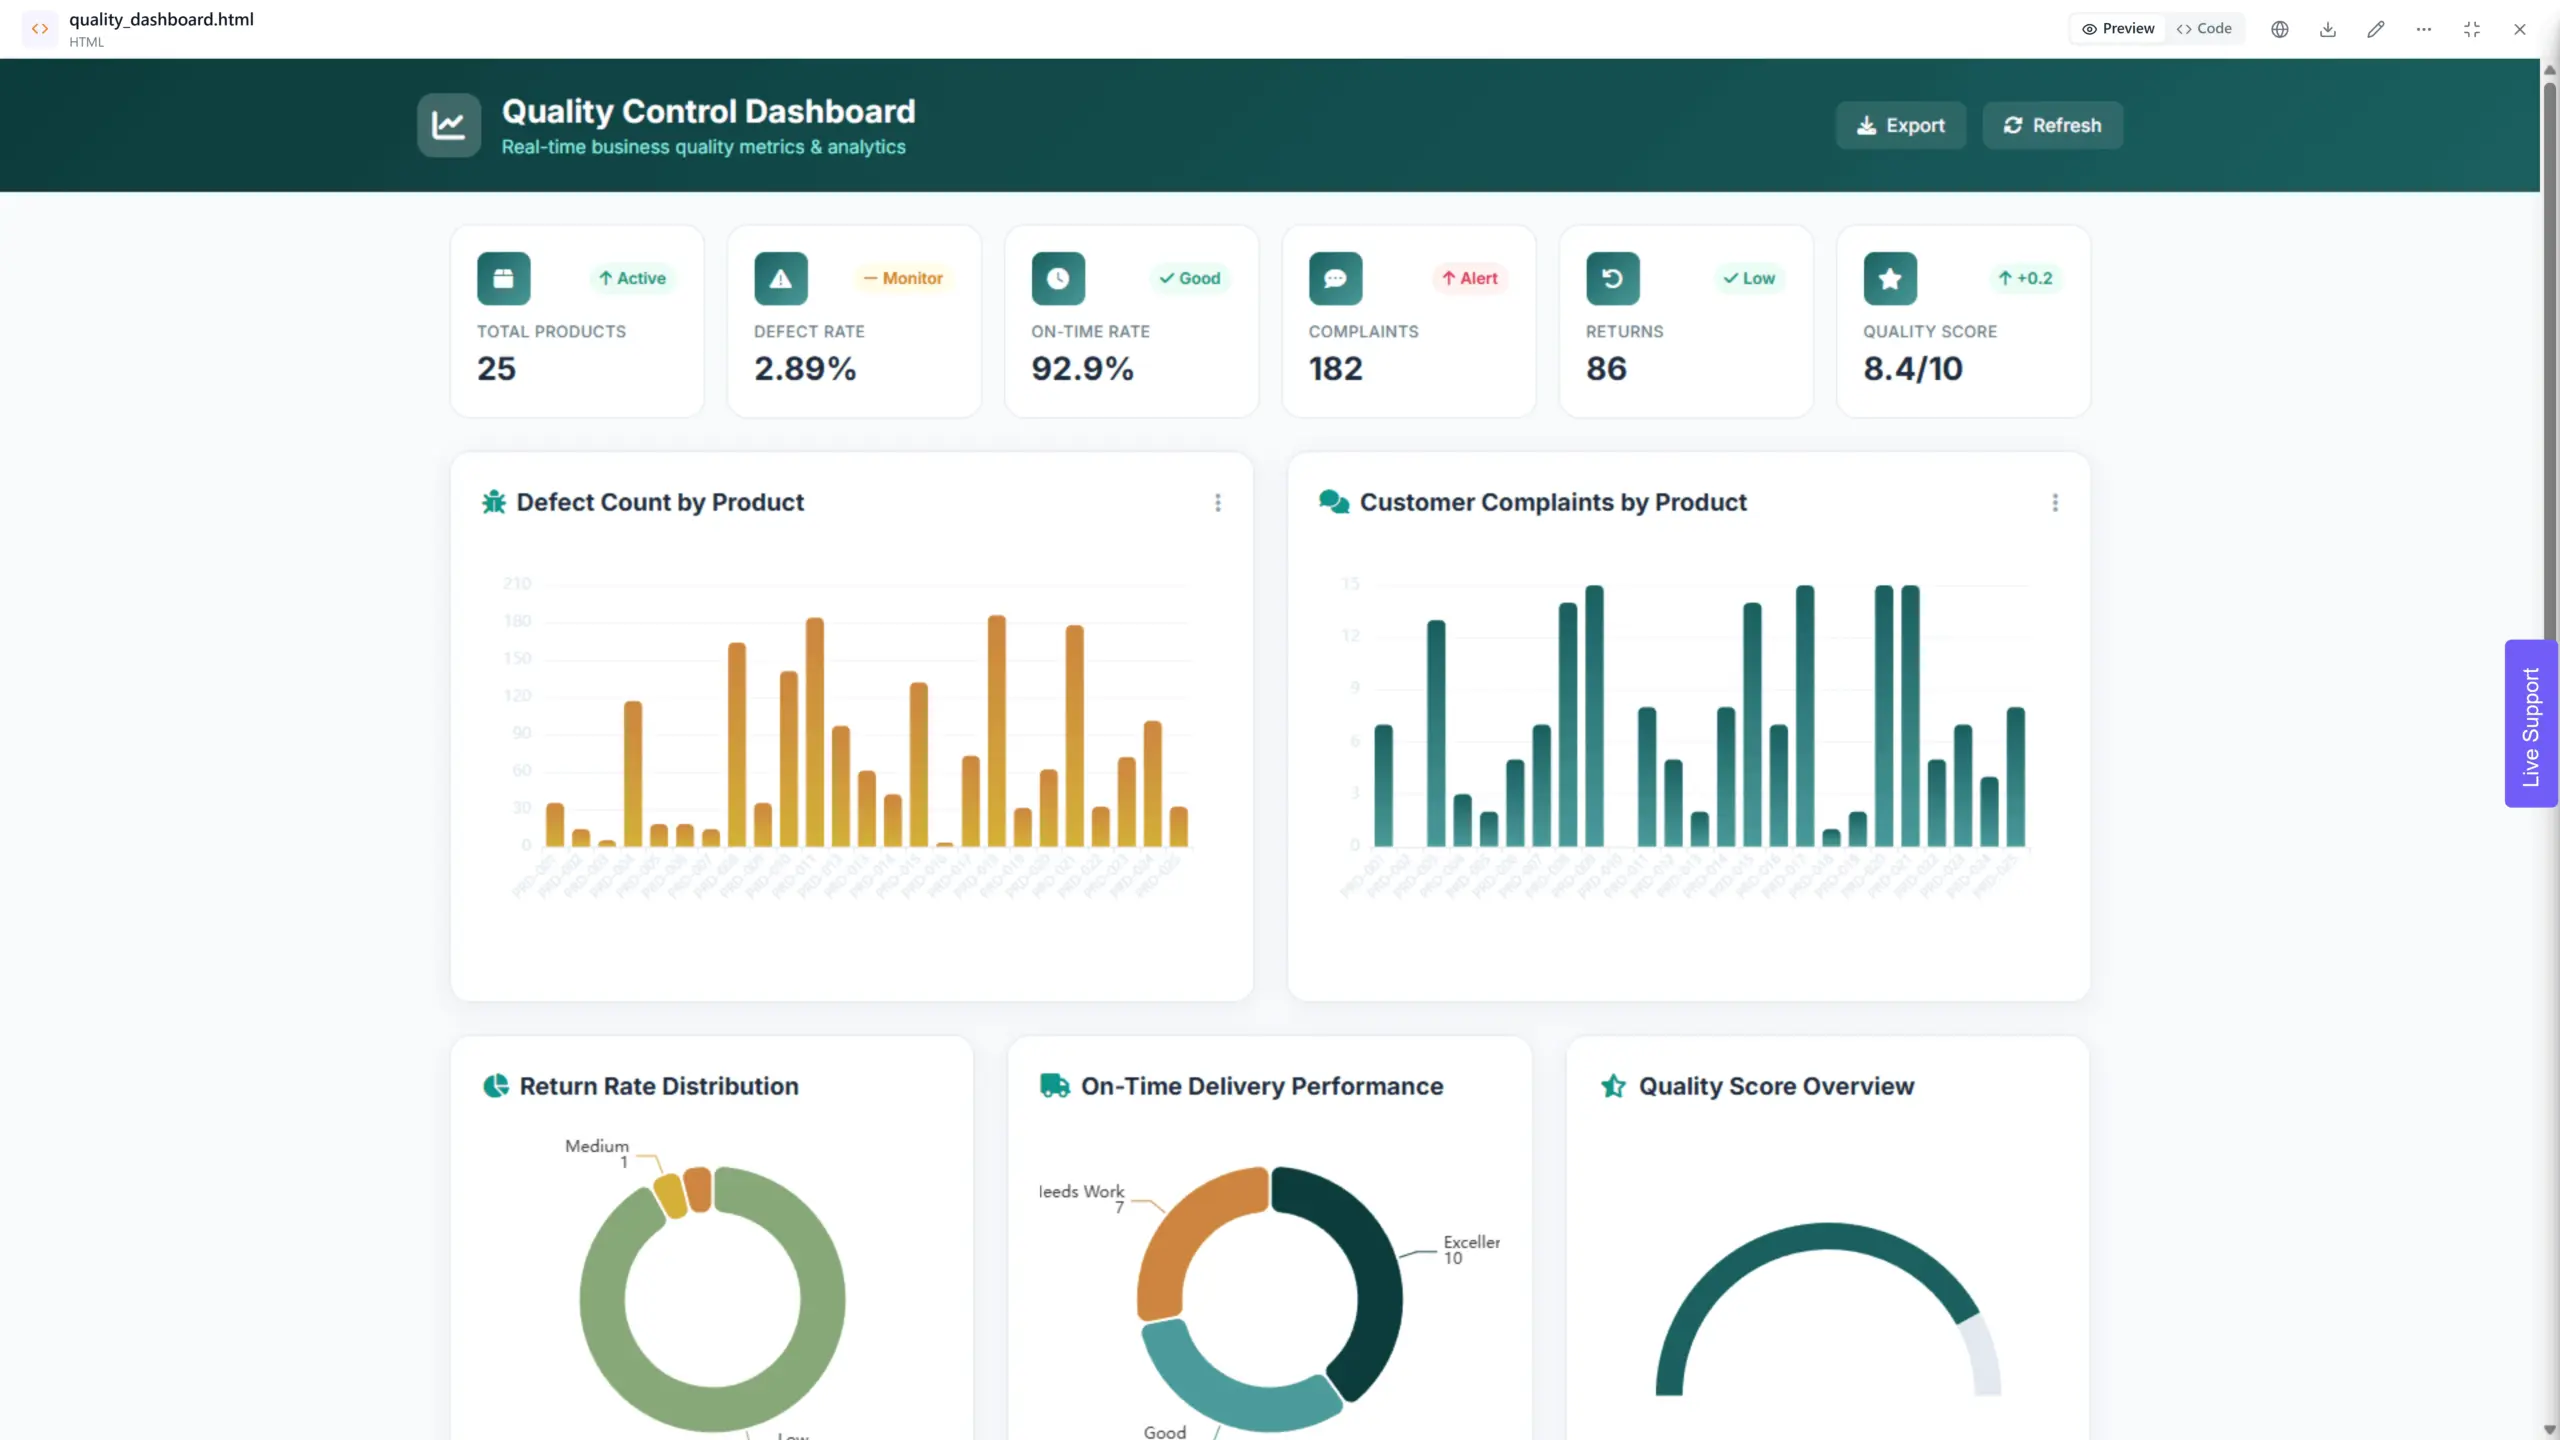
A collaborative platform monitors inventory levels and tracks shipments, and potential disruptions in real time. With the operational dashboard, logistics teams can work together and make informed decisions to optimize the supply chain.
#4 Data-Driven HR Decisions
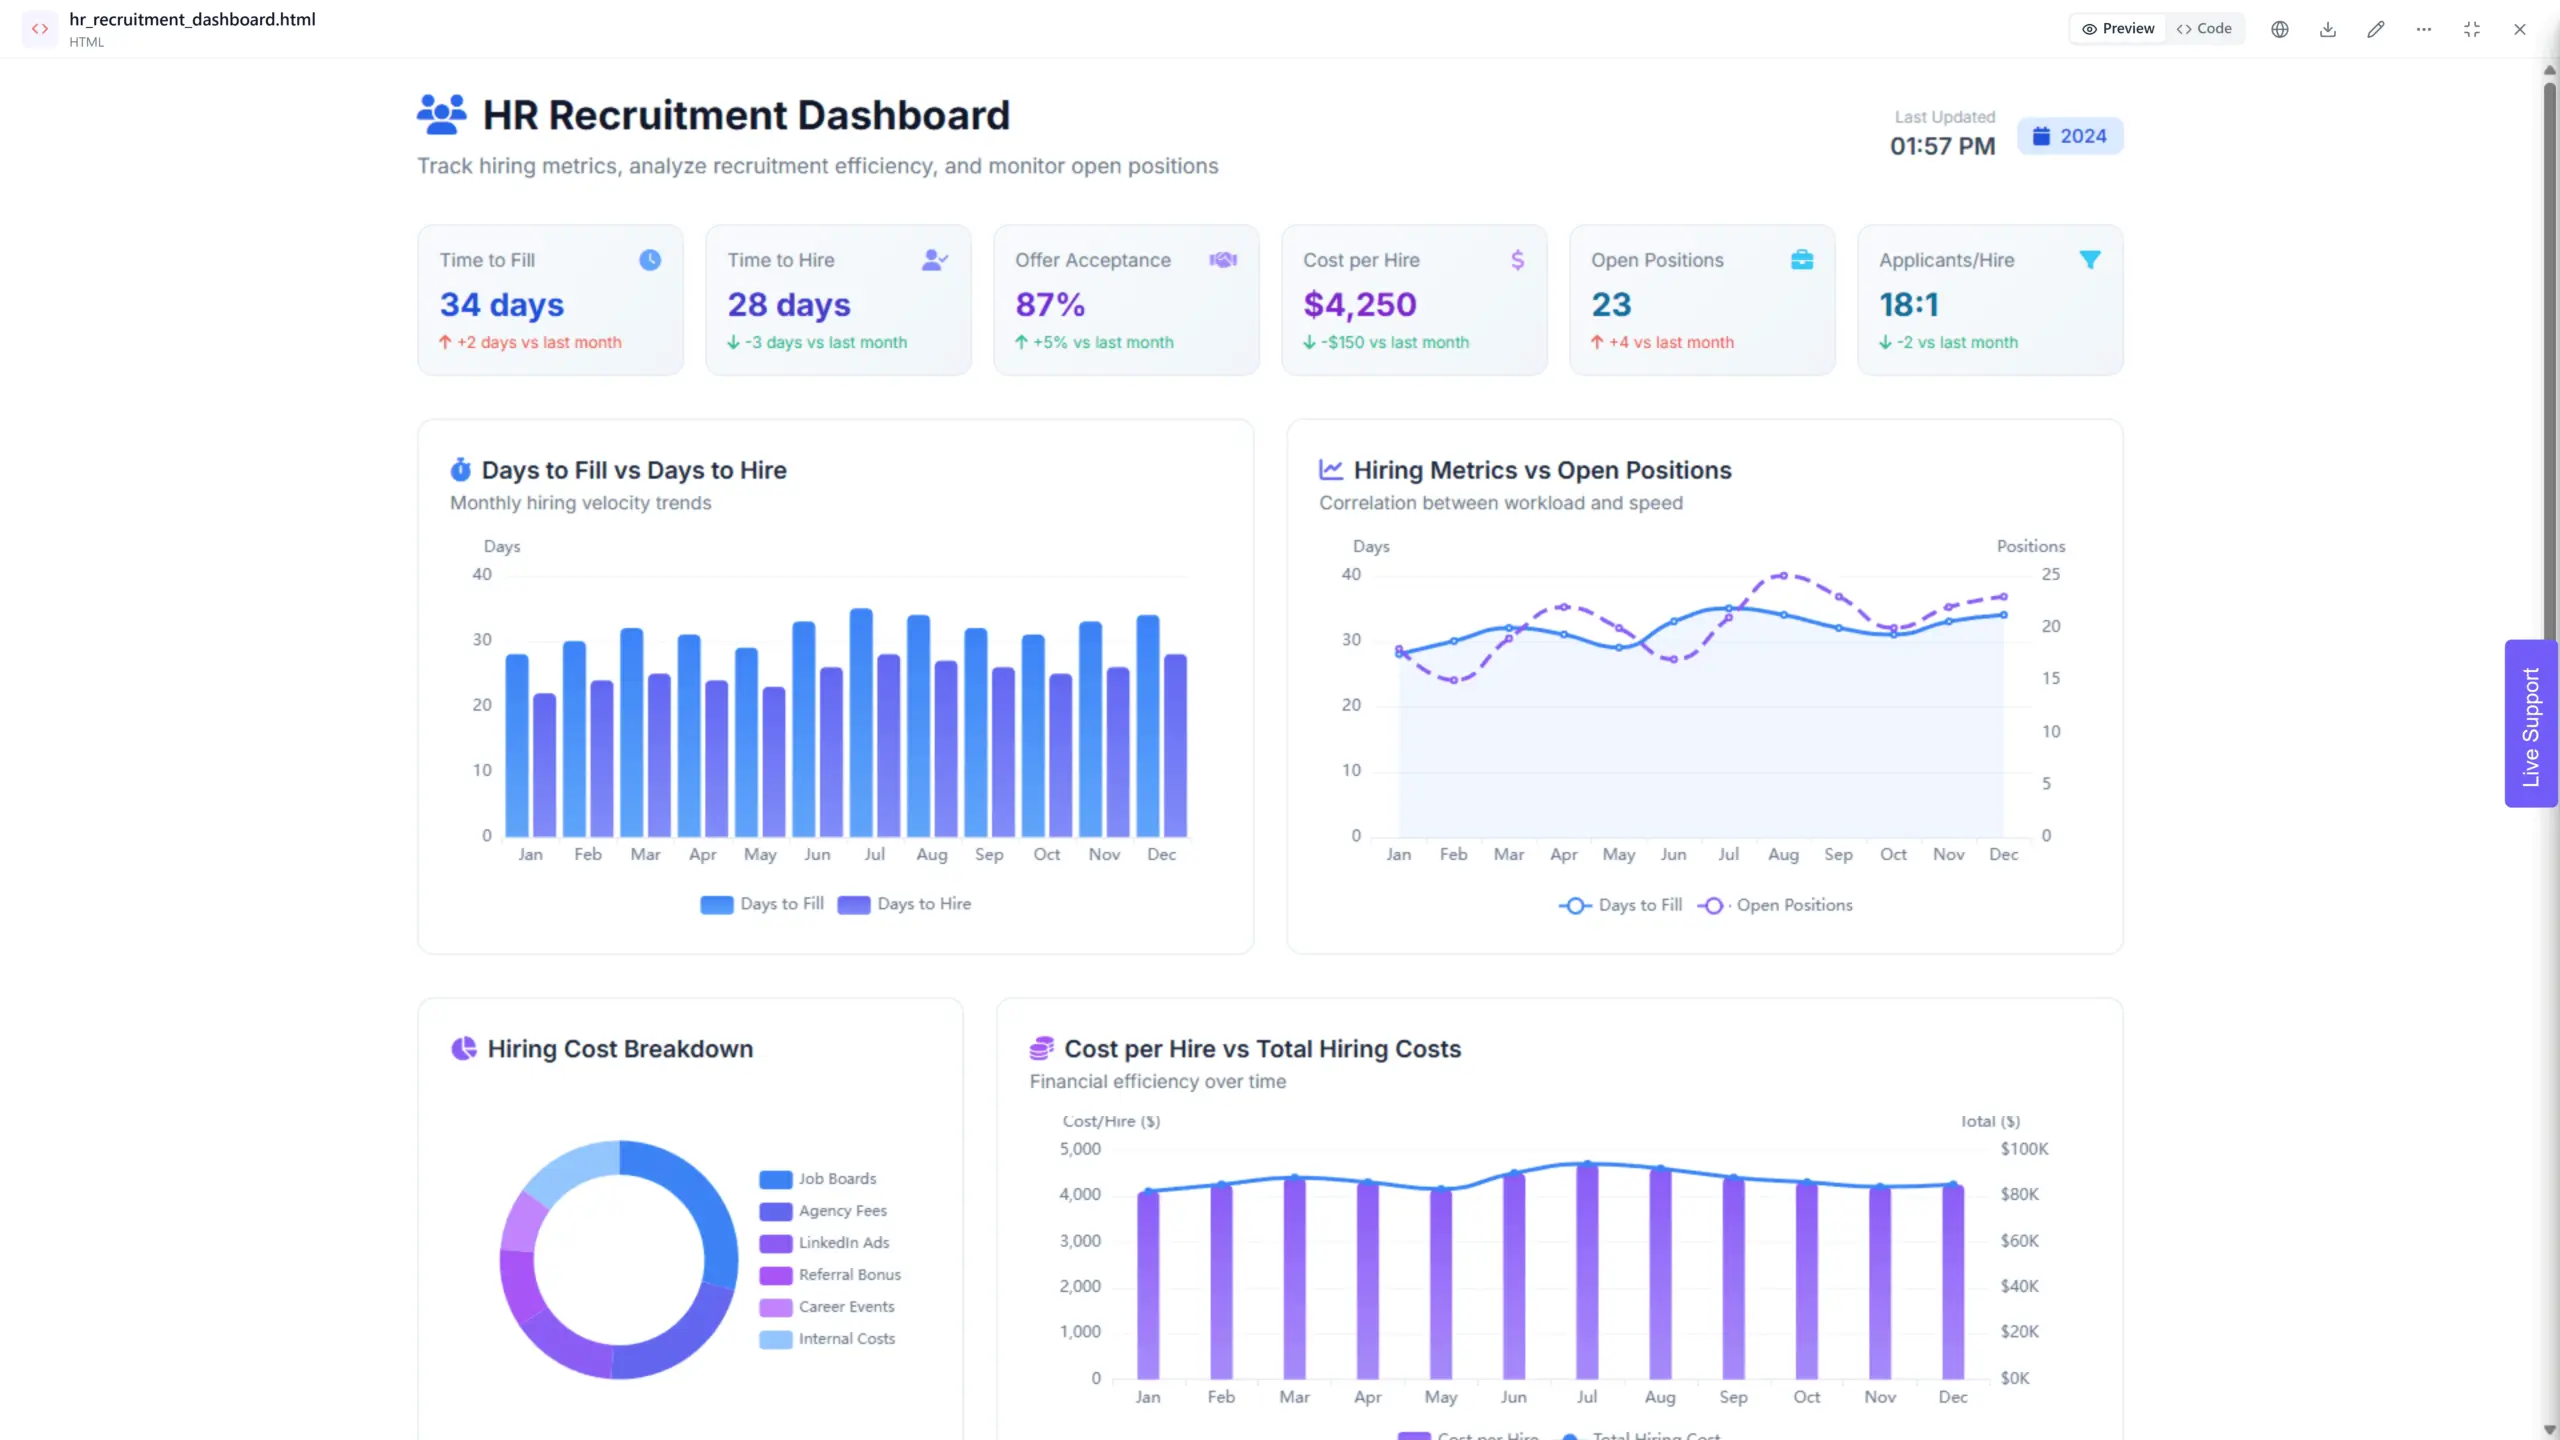
HR teams analyze employee performance data and HR KPIs to identify skills gaps and develop targeted training programs. This can ensure everyone is on the same page when it comes to talent management.
#5 Financial Performance Analysis
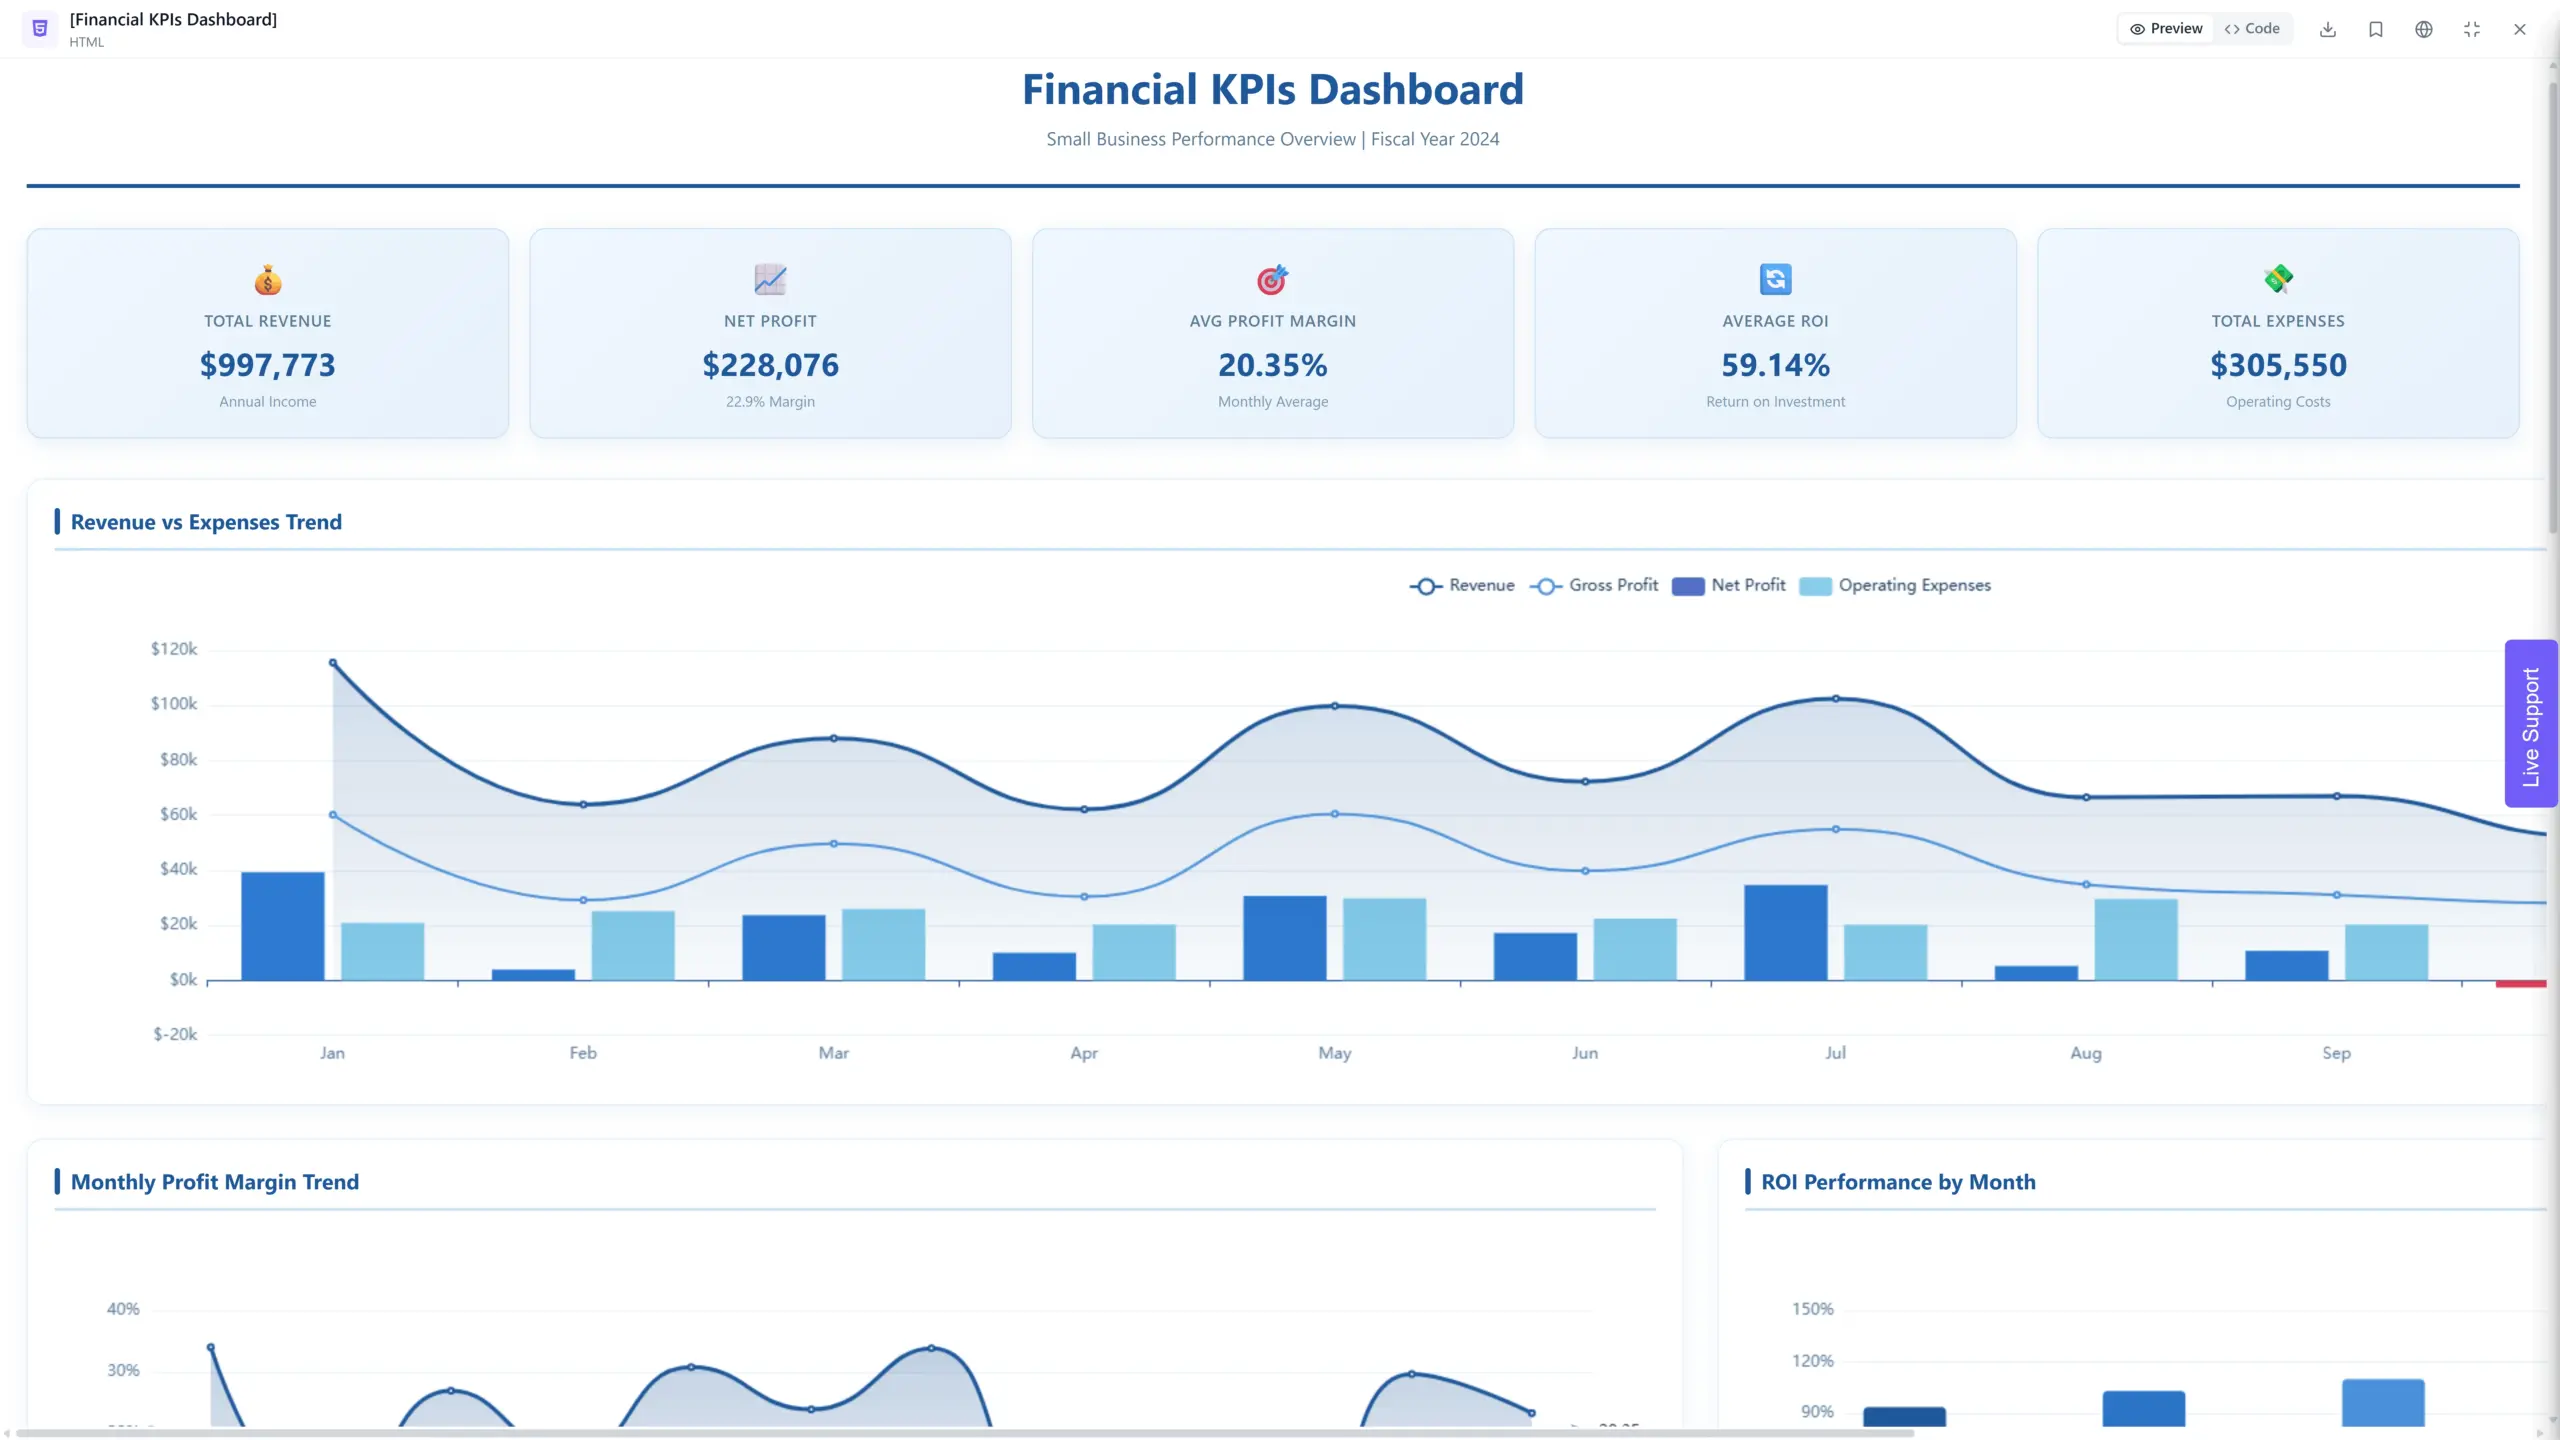
Finance teams can use financial BI to share financial reports, track financial KPIs, analyze trends, and collaborate with department heads to identify cost-saving opportunities and areas for investment.
11 Strategies to Cultivate a Collaborative Data Analytics Environment
There are many benefits for cultivating a collaborative business intelligence analytics environment in the company, here are 11 strategies that can help you do that:
- Break Down Silos: Identify and address data silos hindering information flow. Invest in tools that integrate data sources across departments.
- Promote Data Literacy: Offer training programs to equip all employees with basic data analysis skills. This fosters a culture of understanding and appreciation for data.
- Embrace Self-Service Analytics: Implement user-friendly BI tools with drag-and-drop functionalities, allowing everyone to explore data independently.
- Champion Collaboration Platforms: Utilize communication platforms that integrate with BI or pick the BI tools that offer collaboration options. Encourage discussions, questions, and brainstorming around data visualizations and reports.
- Foster a Culture of Openness: Encourage data sharing and transparency. Refrain from data ownership by specific departments and promote a shared resource mindset.
- Recognize Collaboration Efforts: Publicly acknowledge and reward teams that successfully collaborate on data-driven projects. Celebrate success stories to incentivize collaboration.
- Establish Data Governance Framework: Create clear guidelines for data access, ownership, and security.
- Invest in Champions: Identify enthusiastic individuals from different departments who can champion collaborative data initiatives. They can drive adoption and inspire others.
- Develop Collaborative Workflows: Create standardized workflows for data analysis projects that encourage team interaction at every stage, from data gathering to interpretation.
- Embrace Diverse Perspectives: Encourage teams with varied expertise to collaborate on data analysis. This diversity of thought leads to a richer understanding and prevents bias.
- Track and Measure Success: Monitor key metrics like IT KPIs, Admin metrics, real estate performance, accounting KPIs, collaborative analysis projects, and data-driven decision-making outcomes.
6 Collaborative BI Tools For Analytics
Here are 6 collaborative business intelligence tools that can help businesses implement a data-driven culture:
1. Ajelix
Type your request in chat. Ajelix handles everything else.
Describe the dashboard, report, or analysis you need in plain language – metrics you want to track, data sources to connect, or questions you need answered. AI agent interprets your intent, selects optimal visualizations, queries your data, and generates a complete, interactive dashboard. Refine through conversation: add filters, change chart types, update styling, or drill deeper with follow-up questions. No coding, no complex configuration – just chat, review, and deploy.
Reporting gives you a headache?
Upload your data and create professional reports with agentic AI

Start free
Try free and upgrade whenever
2. Tableau

Dashboard example from Tableau platform, image by author
Tableau is a popular choice for collaborative business intelligence due to its user-friendly interface and strong visual design capabilities. It allows teams to create interactive dashboards and reports for sharing and discussion. Tableau also offers collaboration features to annotate dashboards and leave comments for other users. Also read Tableau pros and cons.
3. Microsoft Power BI
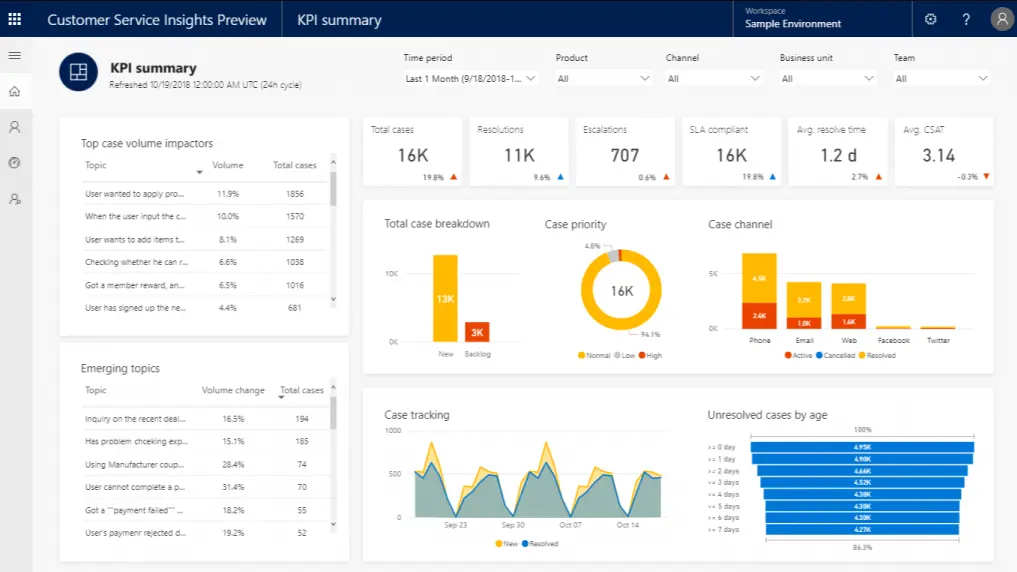
Dashboard example from Power BI platform, image by author
Power BI is a suite of business analytics tools from Microsoft. It integrates seamlessly with other Microsoft products, such as Excel and SharePoint, making it a good choice for organizations already invested in the Microsoft ecosystem.
Power BI offers a variety of collaboration features, including the ability to share dashboards and reports with colleagues, collaborate on data models, and work together on ad-hoc analysis. Read also Power BI cons and pros.
4. Looker
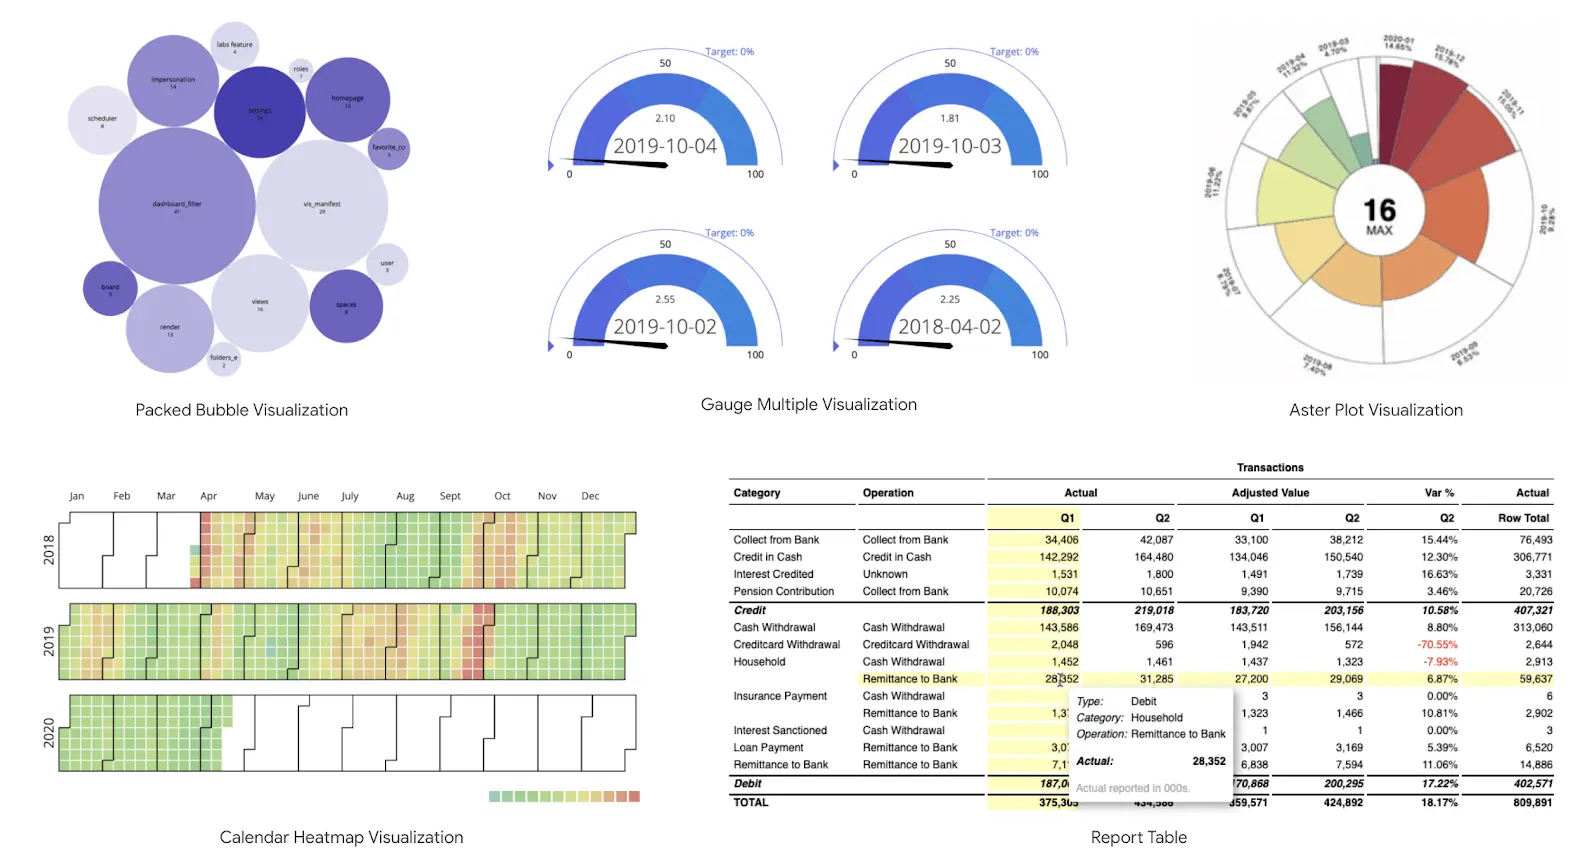
Dashboard example from Looker platform, image by author
Looker is a business intelligence and data visualization platform that is now part of Google Cloud. This paltform is known for its strong data governance capabilities and ability to connect with variety of data sources. Looker also offers a number of collaboration features, such as the ability to share dashboards and reports with colleagues, collaborate on data models, and leave comments on data visualizations.
5. Domo
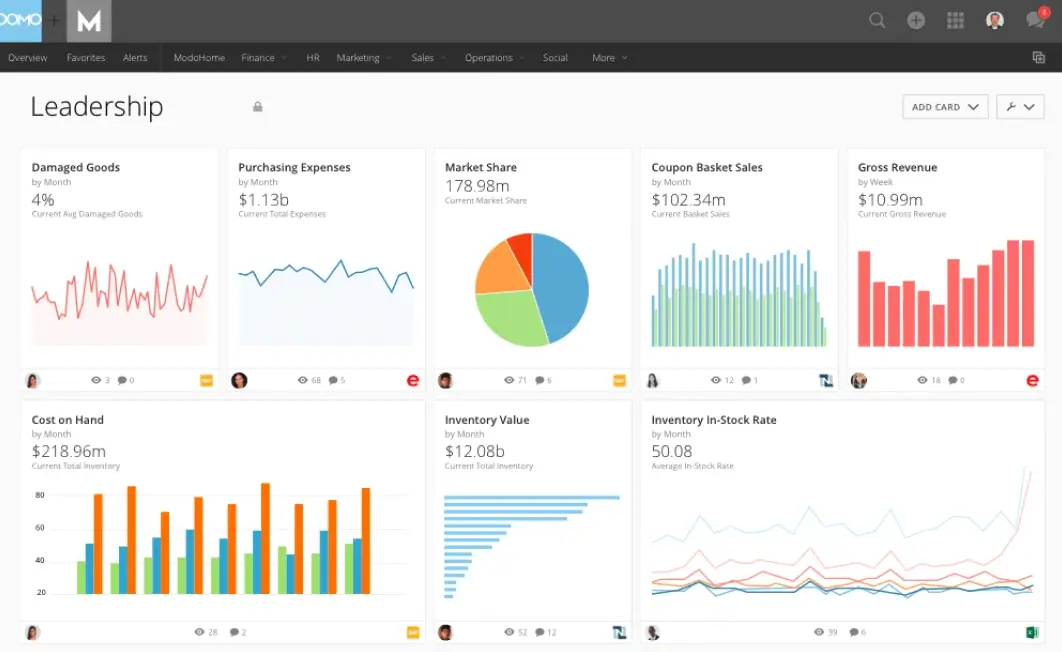
Domo is a cloud-based business intelligence platform that is designed to be easy to use for both technical and non-technical users. Domo offers a variety of collaboration features, such as the ability to share dashboards and reports with colleagues, collaborate on data models, and have real-time conversations about data.
6. Zoho Analytics
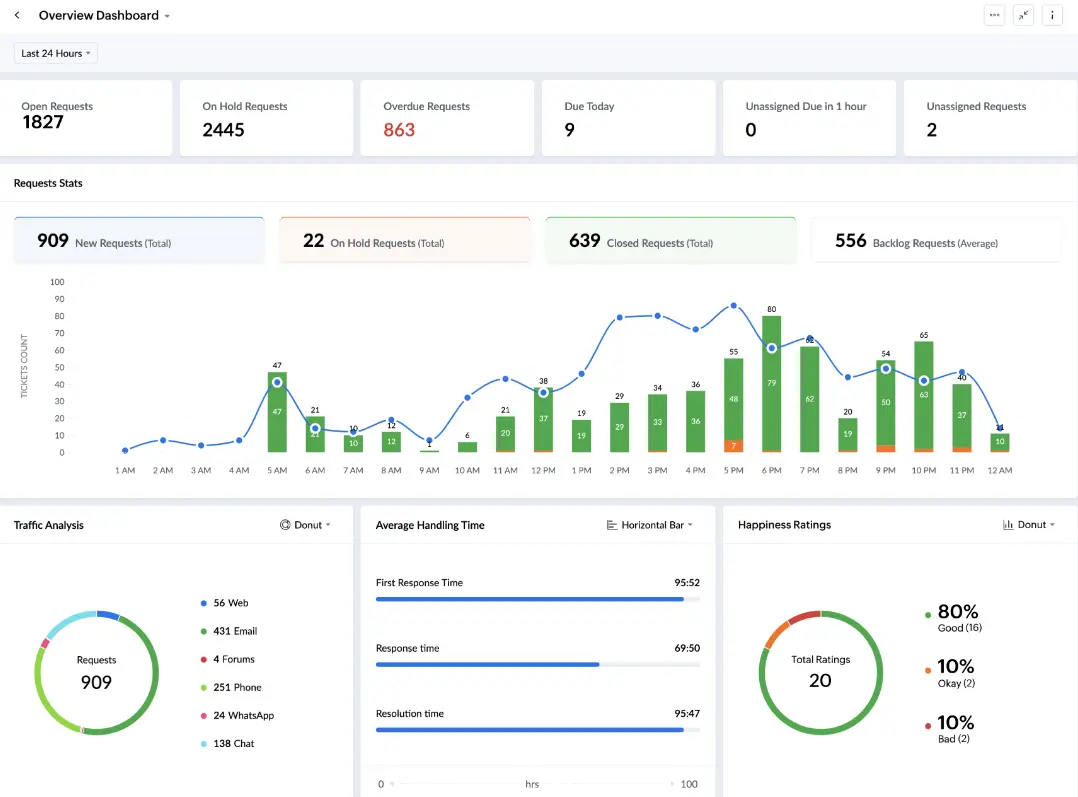
Zoho Analytics business intelligence platform is part of the Zoho suite of business applications. This platform is a good choice for organizations that are already using other Zoho applications. Zoho offers a variety of collaboration features, such as the ability to share dashboards and reports with colleagues, collaborate on data models, and leave comments on data visualizations.
These are just a few of the many collaborative BI tools available on the market. The best tool for your organization will depend on your specific needs and budget. You can check our blog, as we have many software comparisons to help you pick the right software.
Summary
Collaborative BI is a vital part of any business that understands the importance of a data-driven environment. Collaborative analytics can help non-technical users access and share data easily with teammates to create more efficient workflows and act on data.
The most popular tools for collaborative analytics are Ajelix, Tableau, Power BI, and others. Any organization wanting to implement this solution should compare and test the tools to find the right fit.
FAQ
Here are the most popular collaborative business intelligence tools: Ajelix, Power BI, Tableau, Zoho Analytics, Domo, and Looker.
Collaborative analytics is the process of working together with colleagues to analyze data, share insights, and make data-driven decisions.
From data to report in one minute or less with Ajelix AI Agents


