12 KPIs For HR Department Manager
HR managers require a data-driven approach and this is where HR manager KPIs are vital. KPIs for HR illuminate the effectiveness of HR initiatives, providing insights to optimize strategies, demonstrate value, and propel the organization forward.
Every HR professional plays a vital role in fostering a thriving workforce, driving organizational success, and safeguarding the company’s most valuable asset: its people. ✨
This article explores 15 crucial KPIs that empower HR managers to measure department impact across various dimensions, from talent acquisition and development to employee engagement and retention. Let’s dig in!
Change the way you work with agentic AI
One-click dashboards,KPI tracking, and AI-powered insights—for work that actually gets done.

Why do HR KPIs matter and how can they help manage processes?
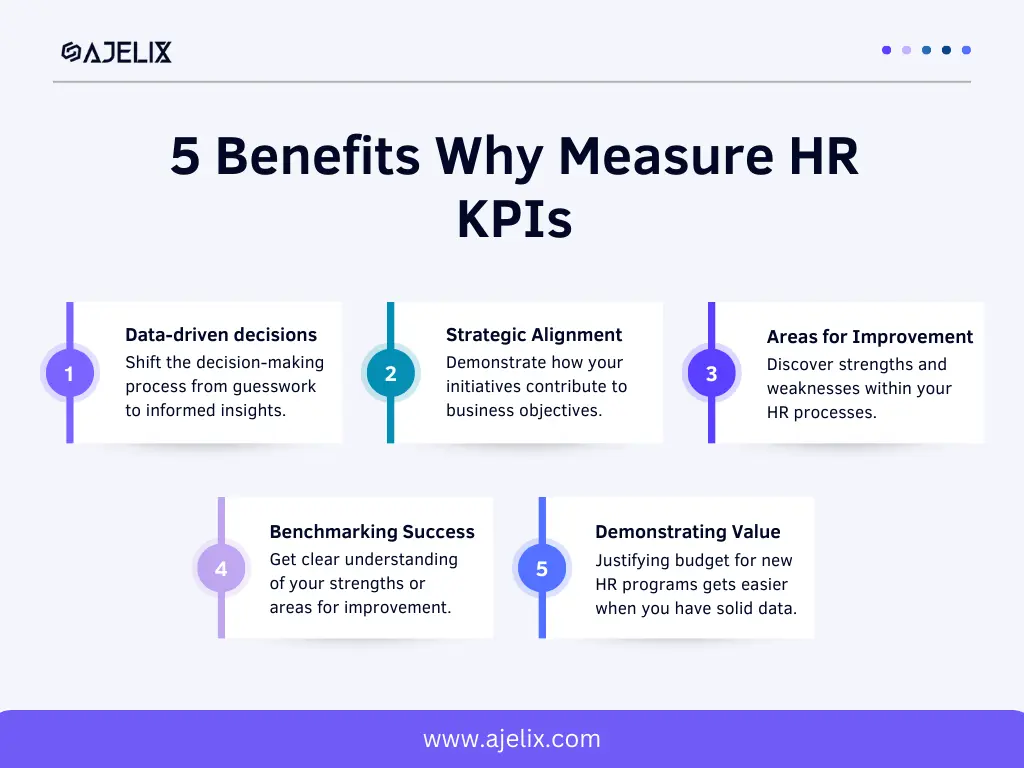
Think of HR KPIs as a navigation, they can help you measure, analyze, and optimize HR strategies to measure the success of the department and overall organization. Here are 5 benefits of how KPIs can help HR performance:
- Data-driven decisions: Without tracking specific metrics you can’t optimize processes. HR KPIs can provide concrete data, that can help you shift the decision-making process from guesswork to informed insights.
- Strategic Alignment: Demonstrate how your initiatives directly contribute to business objectives. For example, improving employee retention can significantly reduce costs, and enhance the company’s bottom line.
- Identify Areas for Improvement: Discover strengths and weaknesses within your HR processes. For instance, a consistently high turnover rate might signal issues with onboarding, training, or company culture.
- Benchmarking Success: Comparing your HR KPIs with industry benchmarks can establish a clearer understanding of your strengths or find areas for improvement.
- Demonstrating Value: Justifying budget requests or advocating for new HR programs gets a whole lot easier when you have solid data backing your claims.
Begin by focusing on a few essential metrics aligned with your most pressing HR goals. Gradually, you’ll gain the confidence to find the best BI tool and transform your HR department into a data-driven department. Taking this approach further, understanding how workforce management principles integrate with HR KPIs can help bridge data insights with real operational improvements.
List with 15 KPIs for HR Department
- Time to hire
- Offer Acceptance Rate
- Cost-per-Hire
- New Hire Success Rate
- Employee Satisfaction Index
- Employee Net Promoter Score
- Training Completion Rate
- Learning & Development Investment per Employee
- Absenteeism Rate
- Turnover Rate
- Performance Management Completion Rate
- Internal Promotion Rate
Recruitment & Onboarding KPIs
Recruiting and onboarding top talent is the cornerstone of any successful organization. With the right human resources software, these processes can become much easier to manage. That’s why it’s important to measure the success of this process. HR KPIs can show the strengths and weaknesses of your talent acquisition and integration processes.
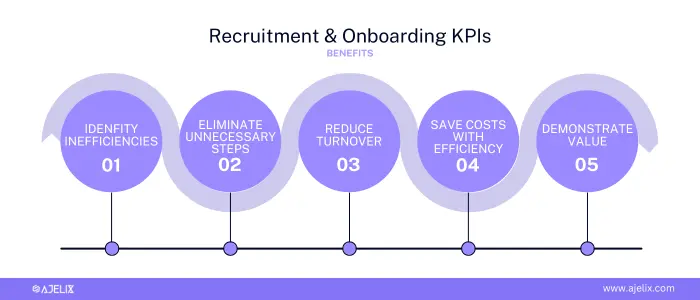
5 benefits for measuring recruitment KPIs:
- identify and address inefficiencies in your recruitment process
- eliminate unnecessary steps in the recruitment and onboarding process, and allocate resources efficiently
- identify gaps and reduce turnover within your onboarding program
- save costs through an efficient recruitment process
- demonstrate the strategic value HR brings to the organization with metrics.
1. Time-to-Hire (TTH)
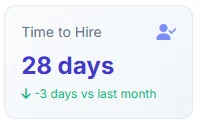
TTH helps you gauge the efficiency of your hiring process, focusing on the crucial time it takes to fill open positions.
TTH = (Total Days to Fill Open Position) / (Number of Positions Filled)Example: if it takes an average of 45 days to fill 10 open positions within a specific timeframe, your TTH is:
TTH = (45 days / 10 positions) = 4.5 days per positionBenchmark: Average Time-to-Hire can vary significantly depending on several factors. However, in most companies the faster you employ someone the better. LinkedIn’s Suvrey (2021) states an average global TTH of 41 days. The same metric in 2017 was an average of 30 days based on Linkedin.
Searching for the easiest way to calculate and follow-up on metrics? Take a look at the self-service BI tools that can handle this job for you.
2. Offer Acceptance Rate (OAR)

Measuring OAR shows how attractive your offers are, allowing you to refine your approach and attract top talent. This metric can identify potential issues with your offer package or recruitment process.
OAR = (Number of Offers Accepted) / (Number of Offers Extended) x 100%Example: if you extend 20 job offers and receive 18 acceptances, your OAR is:
OAR = (18 offers accepted / 20 offers extended) x 100% = 90%Benchmark: While a “high” OAR is generally considered desirable, focus on tracking your own OAR trends over time and comparing them to relevant industry benchmarks. Based on SHRM’s Talent Acquisition Benchmarking a high OAR in recruiting is generally considered to be around 90% or higher. However, the average rate is 69%.
3. Cost-per-Hire
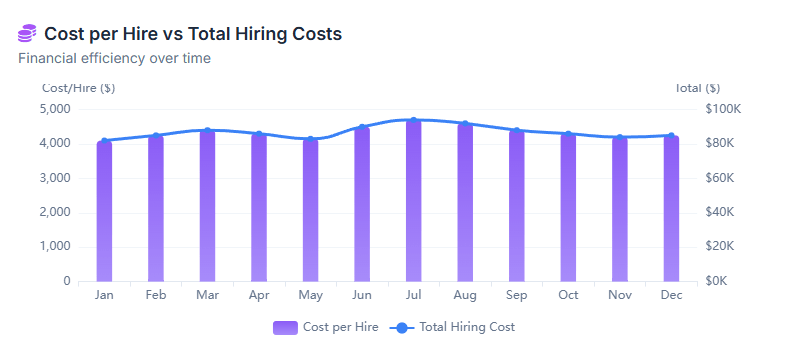
This KPI calculates the total cost of filling a position, including advertising, recruitment fees, and onboarding expenses.
CPH = (Total Costs Associated with Hiring) / (Number of Positions Filled)Calculating total costs make sure to include all expenses:
- Advertising and recruitment fees
- Agency fees (if applicable)
- Background checks and drug testing
- Travel and relocation costs
- Onboarding and training expenses
Example: if it costs your company an average of $5,000 to fill a position, and you fill 10 positions within a specific timeframe, your CPH is:
CPH = ($5,000 per position / 10 positions filled) = $500 per positionBenchmark: Focusing solely on achieving the lowest CPH might not be the most effective approach. Instead, consider the quality of hires, ROI associated with new hires, and long-term impact on company culture.
Any data-driven manager needs the tools to handle data job for him. Calculate cost per hire metric with one of these data visualization tools and gather all data in one place.
4. New Hire Success Rate
Measures the percentage of new hires who complete their probationary period, reflecting the effectiveness of onboarding programs.
NHSR = (Number of New Hires Retained After Probationary Period) / (Number of New Hires Onboarded) x 100%Example: if you onboard 20 new hires and 18 remain with the company after their probationary period, your NHSR is:
NHSR = (18 retained new hires / 20 new hires onboarded) x 100% = 90%Benchmark: The higher the percentage the better the rate. In the end, all HR managers would want all new hires to finish the probation period successfully.
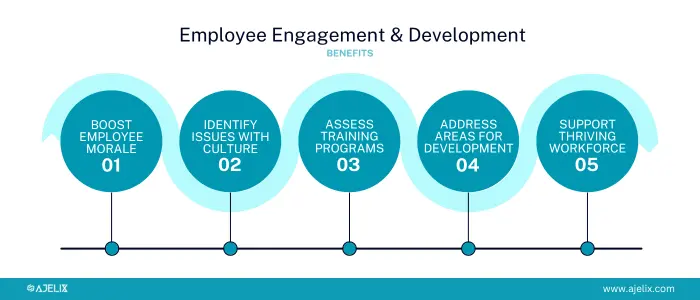
Employee Engagement & Development
Engaged employees are the engine that drives organizational success. Employee engagement & development metrics can help you measure the pulse of your workforce and ensure they feel valued, motivated, and equipped to reach their full potential.
Benefits for measuring employee engagement KPIs:
- foster a positive work environment and boost employee morale. Celebrating milestones is a simple way to strengthen workplace culture and keep your team feeling connected and appreciated.
- identify potential issues with company culture, communication, or recognition
- assess the effectiveness of your training programs
- identify and address areas for employee development
- measure the return on investment (ROI) of your training and development programs
- make data-driven decisions to support a thriving and productive workforce
5. Employee Satisfaction Index
Understanding your employees’ satisfaction is crucial for creating a thriving work environment. This metric gauges overall satisfaction with the work environment, compensation, and career growth opportunities that your company offers.
There’s no single, universally accepted method for calculating the ESS. However, many organizations use employee surveys that capture feedback on various aspects of the workplace experience, such as:
- Work environment and culture
- Compensation and benefits
- Communication and leadership
- Growth and development opportunities
These surveys typically use a Likert scale (e.g., strongly disagree, disagree, neutral, agree, strongly agree) or similar rating system to gauge employee sentiment. The overall ESS is then calculated by averaging the scores across various survey questions.
ESI = (Sum of all individual survey scores) / (Number of respondents * Number of survey questions) x 100Example: Let’s say you send out an employee survey with 10 questions to 100 employees. The average score across all questions and all employees is 3.8 (on a scale of 1 to 5). Using the formula above, your ESI would be:
ESI = (100 employees * 3.8 average score) / (100 employees * 10 questions) x 100 = 38%Benchmark: The higher the rate the better. Based on the LinkedIn survey data very high ESI is between 80-100, good 70-79, 60-69 acceptable, and lower not so good.
6. Employee Net Promoter Score (eNPS)
Measures employee loyalty and willingness to recommend the company as a workplace, reflecting employee engagement and morale. The eNPS uses a single core question:
On a scale of 0-10, how likely are you to recommend [company name] as a great place to work?
Employees are then categorized into three groups:
- Promoters (9-10): Loyal employees who would enthusiastically recommend your company.
- Passives (7-8): Somewhat satisfied employees who might not actively promote or discourage others from joining.
- Detractors (0-6): Disgruntled employees who could badmouth your company to potential hires.
eNPS = % Promoters - % DetractorsBenchmarks: Again the higher the rate the better, however, based on the Qualtrics a good eNPS is considered between 10-30, and anything above 30 is an excellent score.
P.S. Ajelix has already pre-set this metric for automatic calculation, just make sure to upload your Excel or Google Sheets file and share your digital dashboard with stakeholders.
7. Training Completion Rate
Investing in employee training is crucial for fostering a skilled workforce. However, tracking the completion rate of your programs helps you understand if your efforts are translating into actual learning. This metric tracks the percentage of employees who complete assigned training programs.
Training Completion Rate = (Number of Employees Who Completed Training) / (Number of Employees Enrolled in Training) x 100Example: If you enroll 50 employees in a software training program and 45 successfully complete it, your training completion rate is:
Training Completion Rate = (45 completed training / 50 enrolled) x 100 = 90%Benchmark: And again the higher closer the rate to 100% the better, however, industry benchmarks show different picture. Based on the Research Gate the average online training completion rate is at 3 to 6 percent. The numbers vary from format to topics so just give it a go and watch the metrics for any improvements.
8. Learning & Development Investment per Employee
The Learning & Development Investment per Employee measures the average amount spent on L&D activities per employee within a specific timeframe, typically a year.
L&D Investment/Employee = Total L&D Expenses / Number of EmployeesExample: If your organization spends $1 million on L&D in a year and has 200 employees, your L&D Investment/Employee would be:
L&D Investment/Employee = $1,000,000 / 200 employees = $5,000Benchmark: The numbers varies from company size to industry. Small companies in USA spent 1420$ per employee on training in 2023 but large companies only 481$ based on Statista data.
Struggling with manual calculations & tiring setups?
Let agentic AI do the heavy lifting.
Start free
Fast sign up & easy setup
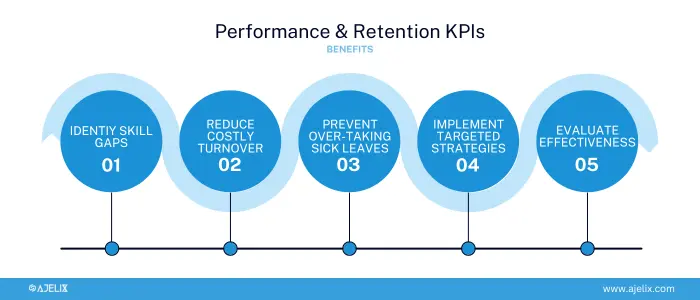
Performance & Retention
Building a successful organization hinges on two key pillars: a high-performing workforce and a strong commitment to retaining top talent. With the help of KPIs you can measure how well your organization is doing.
5 benefits measuring performance and retention:
- prevent over-taking of sick leaves
- invest in wellness programs or implement targeted retention strategies to address specific concerns
- evaluate effectiveness of your talent development strategies
- identify skill gaps and provide targeted training
- reduce costly turnover and build a sustainable, high-performing workforce.
- identify areas for improvement in your talent development and management strategies
9. Absenteeism Rate
Measures the percentage of scheduled workdays employees miss due to illness or other reasons, indicating potential issues with workload, stress, or company culture. A time clock app for field employees can help accurately track employee attendance and absenteeism, providing valuable data for calculating this rate. By automating clock-ins and clock-outs, this tool ensures precise recording, helping HR teams identify trends, flag excessive absenteeism, and take appropriate action. Plus, it can give employees a transparent view of their work hours, promoting accountability and reducing unscheduled absences.
Absenteeism Rate = (Total Number of Absence Days) / (Total Number of Scheduled Workdays x Number of Employees) x 100Example: If your company has 100 employees who work 5 days a week (250 scheduled workdays per month), and there were a total of 150 unscheduled absence days within the month, your Absenteeism Rate would be:
Absenteeism Rate = (150 absence days) / (250 scheduled workdays x 100 employees) x 100 = 0.6%Benchmark: The lower the percentage the better. BrightHR states that anything above 4% is considered as a high rate. Healthy average absenteeism rate is 1.8% but consider if employees “call in sick” when needed or come to work ill.
10. Turnover Rate
Measures the percentage of employees who leave the company within a specific period, indicating potential problems with recruitment, onboarding, or employee engagement.
Turnover Rate = (Number of Employees Separated During Period) / (Average Number of Employees During Period) x 100Example: If your company had 100 employees at the beginning of a year and 110 at the end, with 20 employees leaving during the year, your annual turnover rate would be:
Turnover Rate = (20 employees separated) / (105 average number of employees) x 100 = 19.05%Benchmark: The lower the employee turnover rate, the better. US Mercer survey indicates average turnover rate 17.3% among US businesses in 2022-2023. But this can very differ based on the country, industry and company size. So it’s better to measure your own score and find benchmark in your industry.
Have you tried data visualization tools for HR data representation? You might want to try one of Power BI or Zoho Analytics alternatives.
11. Performance Management Completion Rate
This metric can help HR partners ensure employees are aligned with strategic goals and receiving valuable feedback for improvement. PMCR tracks the percentage of employees who receive regular performance reviews and feedback, reflecting the organization’s commitment to employee development.
PMCR = (Number of Completed Performance Reviews) / (Number of Eligible Employees) x 100Example: If your company has 100 employees who are eligible for performance reviews, and 85 successfully complete their reviews within the designated timeframe, your PMCR would be:
PMCR = (85 completed reviews) / (100 eligible employees) x 100 = 85%Benchmark: The higher the rate the better the percentage, every organization should aim for 100%, but we all know that’s impossible. The industry benchmark for year 2019-2020 based on Lattice is 89% which is still a great result. We encourage HR managers to track and compare these results over year internally.
12. Internal Promotion Rate
Investing in your existing workforce by promoting from within not only boosts employee morale and engagement, but also fosters a sense of career development opportunities within the company. The KPI measures the percentage of open positions filled by internal candidates, indicating the company’s focus on promoting from within and fostering career growth opportunities.
IPR = (Number of Internal Promotions During Period) / (Number of Open Positions During Period) x 100Example: If your company had 20 open positions in a year and filled 15 of them with internal promotions, your IPR would be:
IPR = (15 internal promotions) / (20 open positions) x 100 = 75%Benchmark: SHRM report states that a good average promotion score is 6%. There’s no good or bad result so strive for a healthy result that seems natural.
4 Tools For HR KPI Calculation
Here are 5 tools you can leverage for HR KPI calculation:
- Ajelix: A user-friendly Agentic AI platform designed to simplify HR KPI calculation and reporting. Ajelix offers simple chat interface, AI insights, KPI calculation, data source integration with spreadsheets, affordable pricing, professional visualizations and easy sharing.
- Microsoft Excel: You can build custom formulas and create data visualizations to calculate and track HR KPIs. However, Excel can become complex and cumbersome for managing large datasets and collaborating with multiple users.
- Google Sheets: Similar to Excel, Google Sheets offers a free and accessible platform for HR KPI calculation. However, it may lack the advanced features and functionalities of dedicated HR analytics software.
- HRIS (Human Resource Information System) Software: Many HRIS platforms offer built-in HR KPI dashboards and reporting tools. These integrate seamlessly with your HR data, allowing you to calculate and visualize KPIs in a user-friendly interface. However, HRIS solutions can be costly and may require implementation and training time.
Reporting gives you a headache?
Upload your data and create professional reports with agentic AI

Start free
Try free and upgrade whenever
Conclusions
The 12 KPIs explored in this blog offer a valuable toolkit for HR professionals to measure, analyze, and improve various aspects of their workforce management strategies.
Remember, KPIs are not standalone numbers, but rather indicators of your HR practices’ effectiveness. By combining data analysis with a strategic approach and a deep understanding of your unique organizational context, you can leverage these KPIs to drive positive change and build a truly successful HR strategy.
FAQ
Every HR manager should track Cost per Hire, Absenteeism Rate, Turnover Rate, Internal Promotion Rate and Employee Satisfaction score.
You can use Ajelix, Excel, Google Sheets, Zoho Analytics. and other BI tools.
Ready to calculate HR KPIs with Ajelix?
From data to report in one minute or less with Ajelix AI Agents


