14 Best Data Visualization Tools Comparison 2026

Data visualization is all about transforming raw numbers into compelling visuals that reveal hidden insights and make complex information easy to grasp. But here’s the thing: one size doesn’t fit all. The best data visualization tools is the one that perfectly aligns with your specific data and business goals.
What’s a home run for one team might be a complete strikeout for another. There’s no magic bullet, no single “super tool” that can magically solve every data visualization challenge.
However, finding the right tool for your needs is absolutely possible. This article is your guide to navigating data visualization in 2026, exploring 14 different tools worth considering. We’ll dive into detailed overviews and key features, helping you answer the all-important question: “Which is my best data visualization tool for 2026?”
Table of contents:
Change the way you work with agentic AI
One-click dashboards,KPI tracking, and AI-powered insights—for work that actually gets done.

List of Top Data Visualization Tools 2026
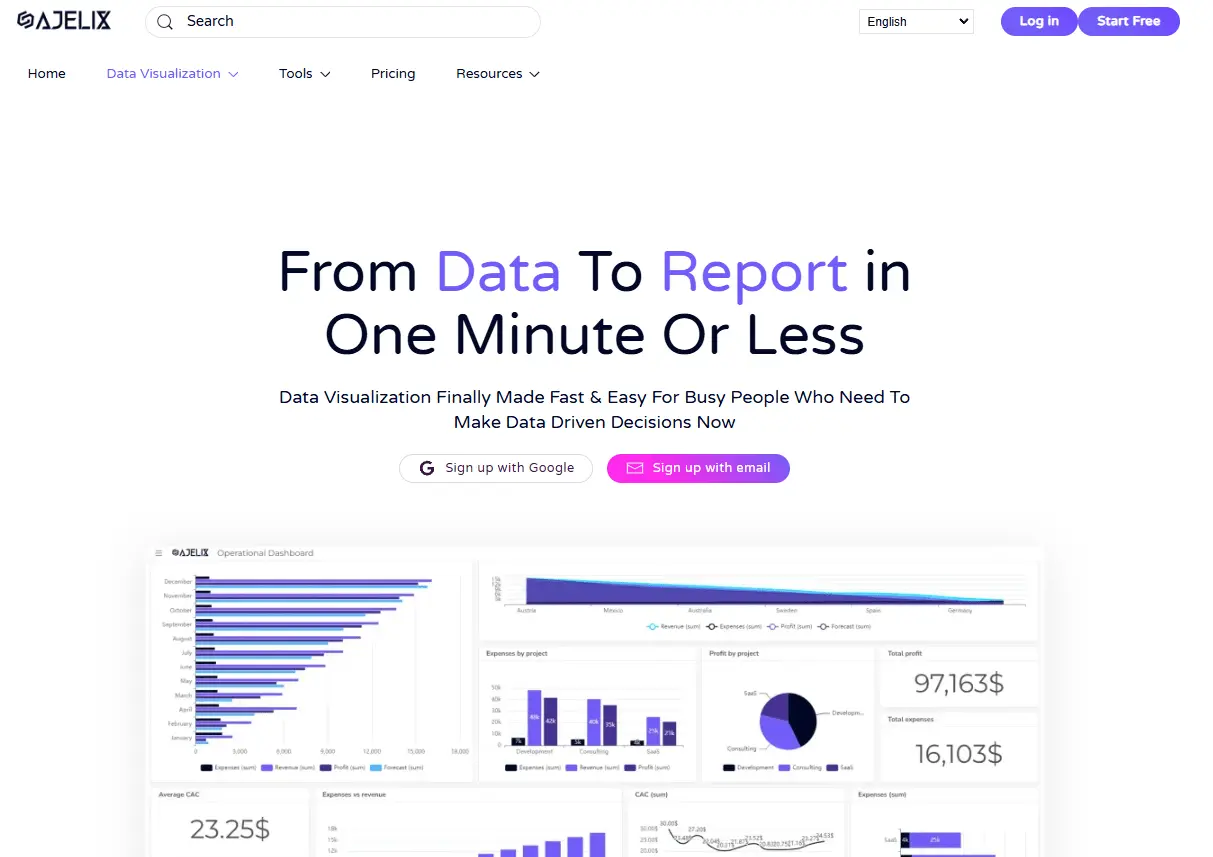
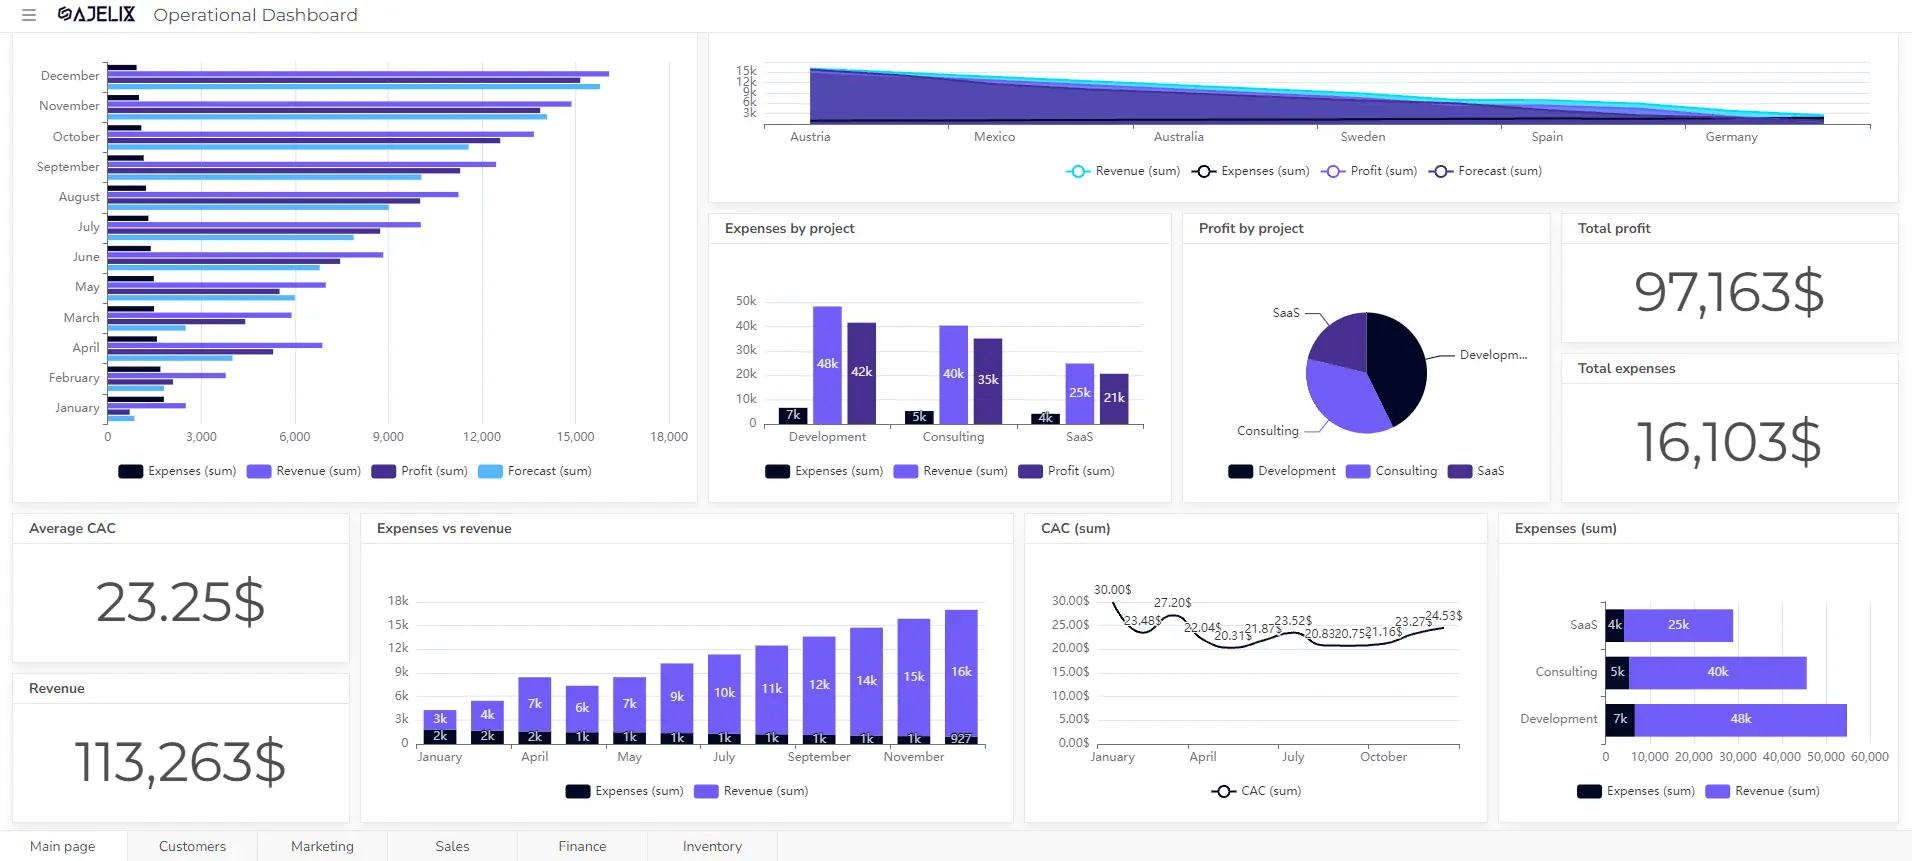
1. Ajelix BI: Best for non-technical teams & small businesses
If you’re a small to medium business owner, an entrepreneur, or just someone who needs to make sense of data, Ajelix BI might just be your new best friend. No surprise really – they’ve focused on making it super user-friendly, which gives them a real edge. This means you’re going to have a much easier time getting your team on board, even if they’re not data whizzes.
Ajelix BI lets you create dashboards and reports without needing a PhD in data science. It’s designed to be easy to set up and use, with a straightforward interface that doesn’t require any special IT or analytics knowledge.
You can whip up visualizations, track key metrics, and get insights from your data without getting bogged down in complicated configurations. Plus, they offer a freemium plan, so you can kick the tires and see if it’s a good fit before committing.
And even if you decide to upgrade for more advanced features, it’s only $40 a month – which is a pretty sweet deal compared to some of the other enterprise-level tools out there. So, if you’re looking for something that’s both easy to use and won’t break the bank, Ajelix BI is definitely worth checking out.
Features
- No-code editor: Anyone can use Ajelix BI, even without technical expertise.
- AI dashboard generator: Create multiple reports with just one click.
- Quick setup: Get your reports up and running in no time, without complex configurations.
- Shareable reports: Share your insights with colleagues or clients using secure links and passwords.
- Collaborative access: Easily add editors or viewers to your reports with a few clicks.
- Connect to Google Sheets: Seamlessly integrate Ajelix BI with your Google Sheets for automatic data updates.
- One-click reports: get reports from your data with just one click.
- Set refresh intervals: Schedule automatic reporting to keep your data fresh and relevant.
- Interactive reports: Create interactive reports with filters for data-driven decision-making.
- Real-time insights: Gain immediate insights from your data, regardless of the data source.
- AI-powered analysis: Analyze your charts with AI-powered insights to uncover hidden patterns.
Pricing
- Freemium plan: created to test the features and functionality of the platform
- Business plan: is 40$ a month
- Business + plan: is 200$ a month.
Pros:
- Ease of use
- Fast reporting
- Easy live data reporting
- No complex setups
- Doesn’t require advanced IT knowledge
Reporting gives you a headache?
Upload your data and create professional reports with agentic AI

Start free
Try free and upgrade whenever
2. Powerdrill AI: Best for user-friendliness and customized datasets
Powerdrill AI is an AI SaaS service centered around personal and enterprise datasets. Designed to unlock the full potential of your data, Powerdrill enables you to use natural language to effortlessly interact with your datasets for tasks ranging from simple Q&As to insightful BI analysis.
By breaking down barriers to knowledge acquisition and data analysis, Powerdrill boosts data processing efficiency exponentially. Key competitive capabilities offered by Powerdrill include precise user intention understanding, hybrid employment of large-scale high-performance Retrieval Augmented Generation (RAG) frameworks, comprehensive dataset comprehension through indexing, multi-modal support for multimedia input and output, and proficient code generation for data analysis.
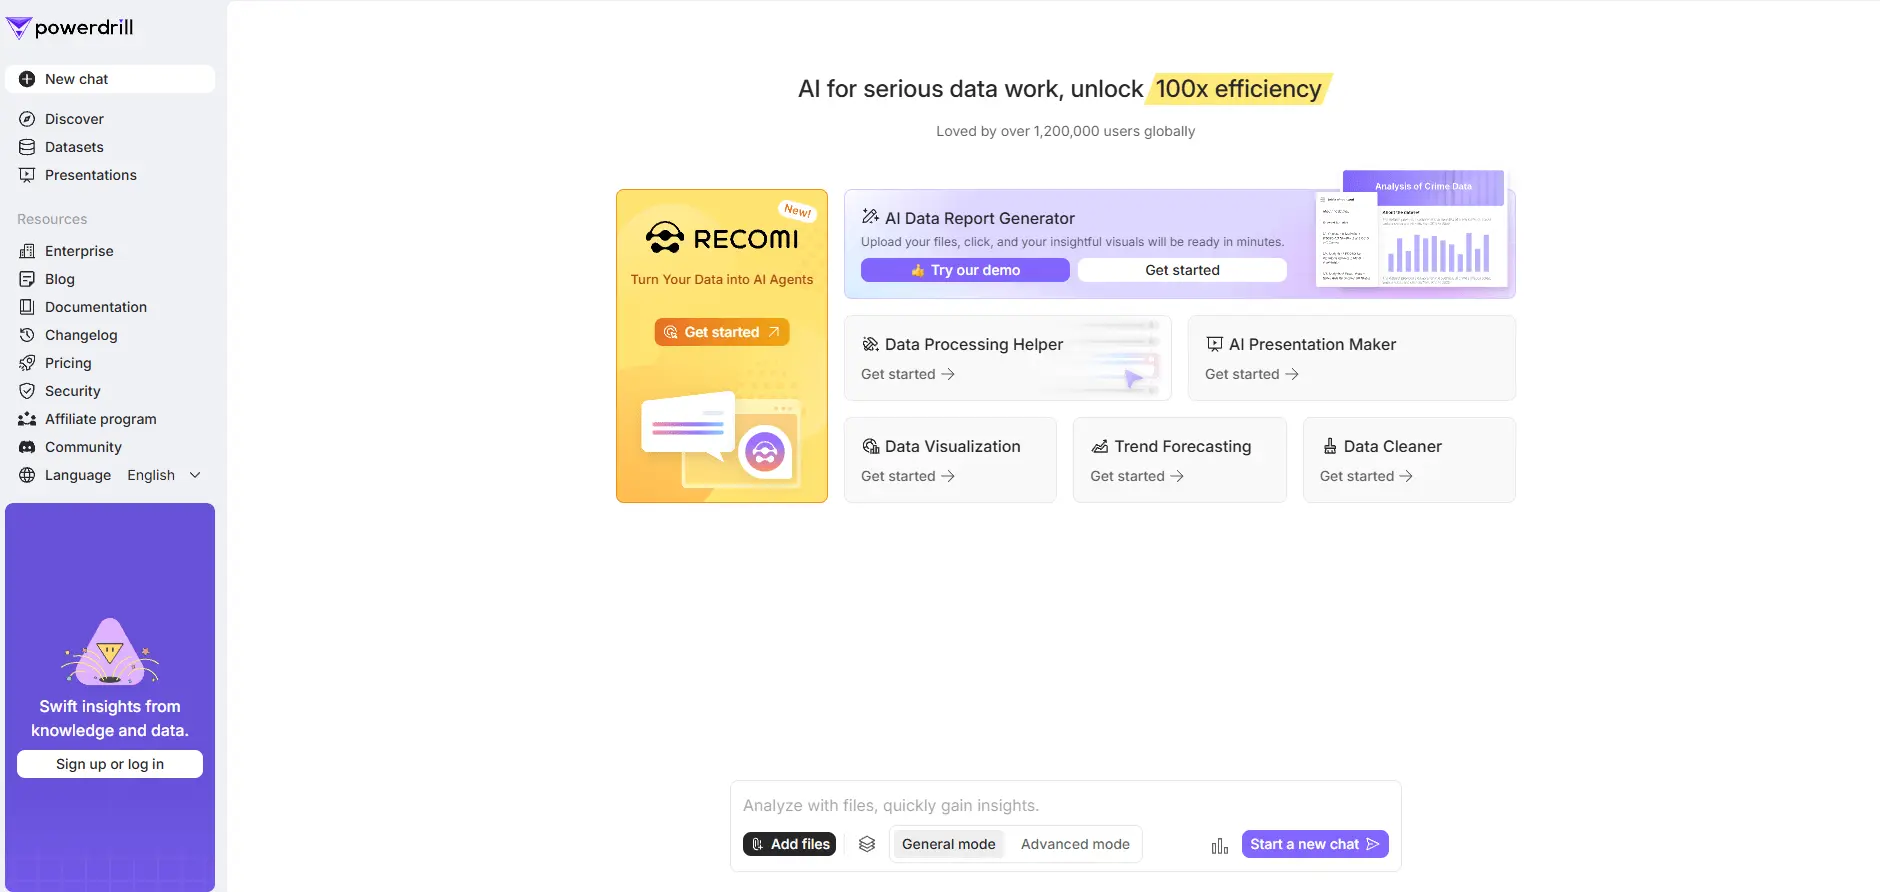
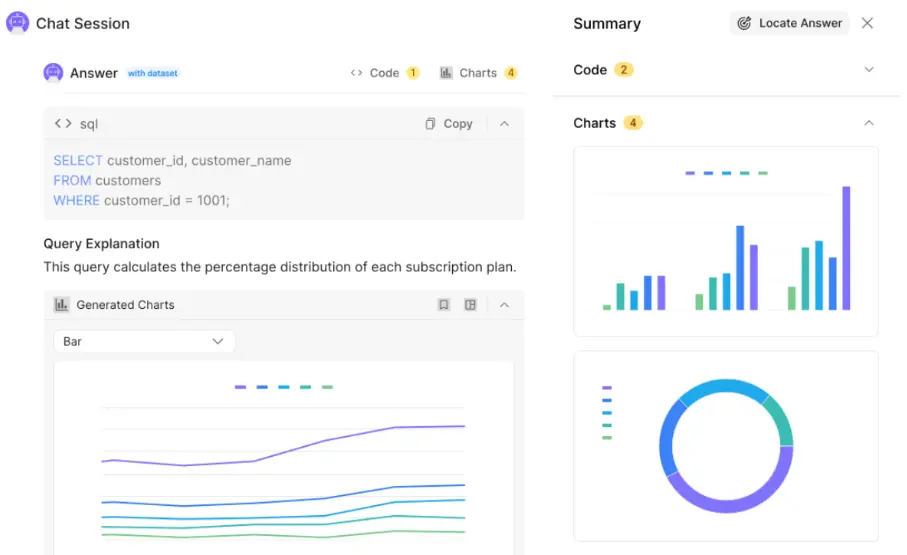
Powerdrill AI excels at automating manual data tasks by combining natural language processing and powerful data extraction capabilities. It turns raw data into clear summaries, charts, and ready-to-use content with just one click.
Powerdrill is currently free for trial. After sign-in, you’ll get some message credits and dataset storage size for free.
Features
- Advanced Analytics: Gives full play to the value of your data.
- AI Presentation Maker: Transforms your files into clear, organized presentations, reducing hours of work to minutes.
- AI Report Generator: Generate high-quality data report in one click.
- Smart DocMap: Well-organized references, curated mind maps, and other info that help you understand your data.
- Chat App over Dataset: Delivers smarter and more accurate answers to questions based on your datasets than ChatGPT.
- No-Code App Builder: Offers a no-code approach to building apps by using natural language.
- Dataset Sharing: Enables you to share your datasets in an easy, governed manner.
- Chat Sharing: Create a shared link to your chat and share it with others.
- Discover: A hub for data, tech, science, and more.
- Multimedia Input/Output: Understands images, generates images based on prompts, converts text to audio, and converts audio to text.
Pricing
- Free: limited AI workspace capacity
- Basic plan: is 3.90$ a month
- Plus plan: is 9.90$ a month
- Pro plan: is 29.90$ a month
Pros
- Zero coding required
- Intuitive, user-friendly interface
- Quick setup
- AI-powered suggestions
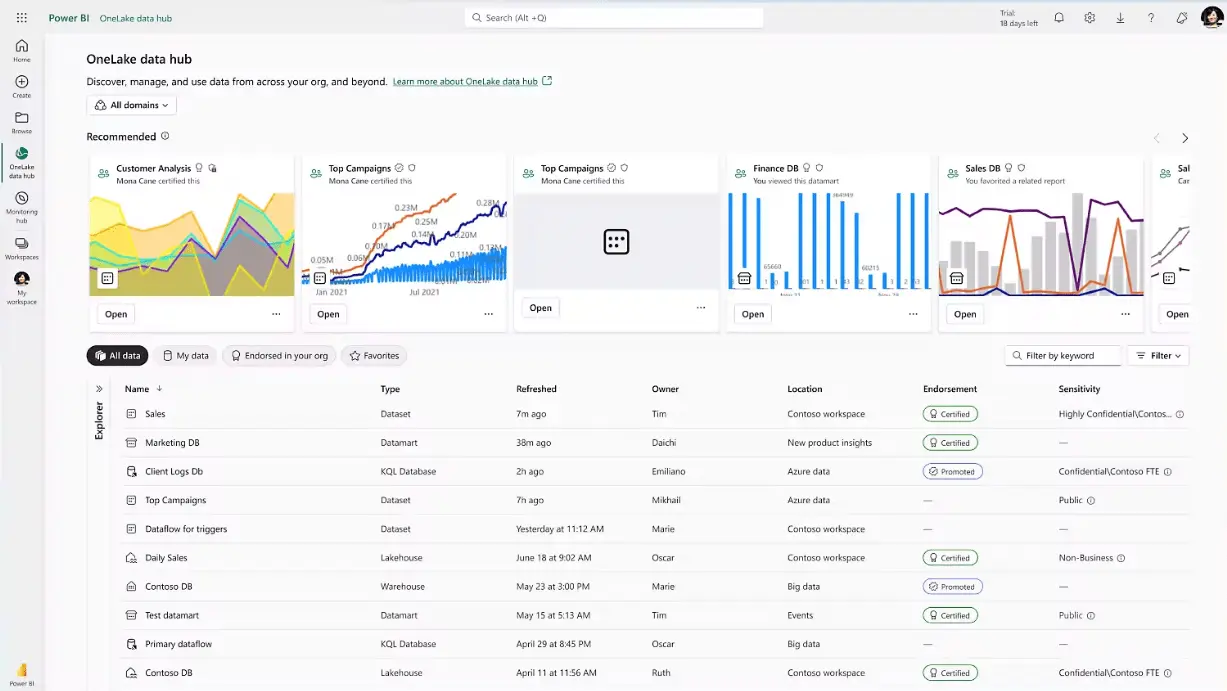
3. Power BI: Best for experienced analysts
Power BI is one of the well-known data visualization platforms, that offers extensive freemium plans and advanced IT or analytics knowledge.
This platform lets you whip up some seriously impressive dashboards and reports, way beyond what you can do with basic spreadsheets. It’s got drag-and-drop interfaces, built-in visualizations (charts, maps, the whole shebang), and even some AI-powered insights to help you spot trends you might otherwise miss.
While you can get started with the free version and build some decent reports without being a data wizard, to really unlock its potential – things like advanced data modeling, sharing dashboards across your organization, and connecting to a wider range of data sources – you’ll either need to upgrade to a paid plan or have someone on your team who knows their way around data analysis and potentially some DAX (Data Analysis Expressions).
But like Excel, there’s a mountain of resources, tutorials, and online communities out there to help you get up to speed.
Features
- Connect to a wide range of data sources, including cloud-based, on-premises, and self-hosted databases.
- Create complex data calculations using DAX formulas.
- Transform your data using Power Query Editor, a visual data transformation tool.
- Seamlessly integrate with other Microsoft products, such as Excel and Dynamics 365.
- Keep your Power BI reports up-to-date with scheduled data refreshes.
- Expand the capabilities of Power BI with your own code and visualizations.
Pricing
- Freemium plan
- Power BI pro for 10$ user per month
- Premium user for 20$ per month
- Microsoft Fabric from 4995$ – 8409$ per month
Pros
- Extensive freemium plan for individual use for users who have advanced analytics knowledge
- Many possibilities using DAX functions and coding
- Budget-friendly solution
Cons
- Requires advanced knowledge in setup and usability
- Hard to navigate the reports, interface is hard to digest
- Customization is very limited if you don’t have a coding skills
- Doesn’t offer report responsivity for mobile and tablet versions
- Read more detailed pros and cons overview on our blog.
Related Article: Explore Best Data Visualization Software for Mac
4. Yellowfin BI: Best for enterprise-grade analytics & data storytelling
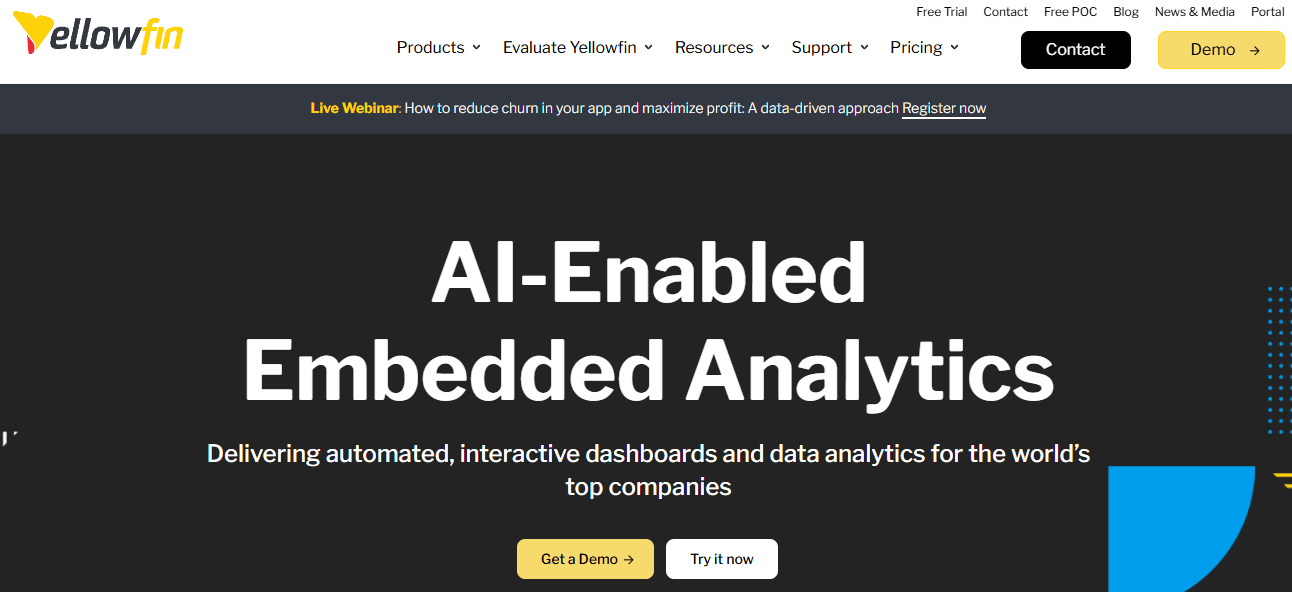
Yellowfin BI is a powerful tool for organizations that need more than basic dashboards. It combines dashboards, automated insights, and data storytelling in one platform. Teams can turn raw data into clear, visual stories, making it easy to see trends and take action quickly.
It’s easy to use but still powerful. Business users can explore data without relying on IT, while analysts can dig deeper with AI-driven insights. This makes it useful for everyone, from those needing quick answers to those doing detailed analysis.
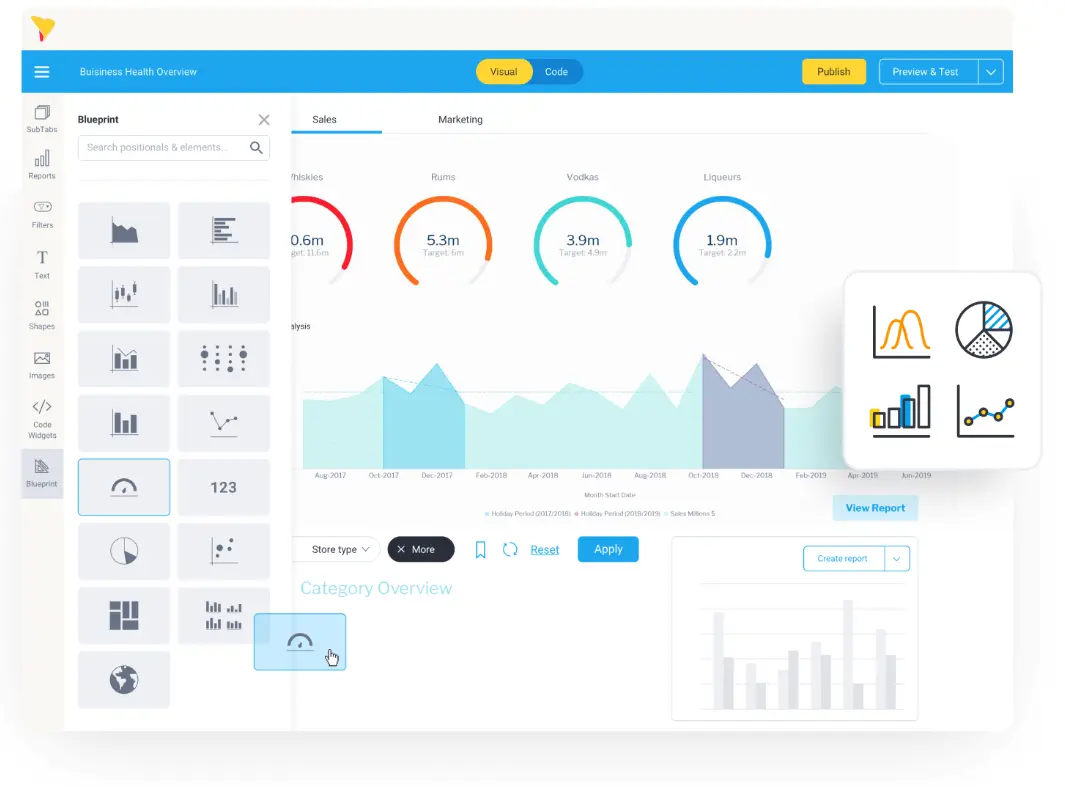
With Yellowfin’s guided analytics, you can explore complex data sets and uncover trends fast. It helps teams not just see numbers but understand what the data really means, supporting smarter and faster decision-making.
Sharing insights is simple too. Dashboards, reports, and interactive stories can be shared securely with teams or clients. Whether tracking operations or understanding customer behavior, everything stays connected, actionable, and easy to access in one platform.
Features
- Action-based dashboards: Interact with data in real time to make decisions faster.
- Automated analysis: AI highlights trends, anomalies, and patterns automatically.
- Data storytelling: Convert charts and dashboards into narrative reports and presentations.
- Embedded analytics: Integrate dashboards and analytics seamlessly into your applications.
- Guided NLQ (Natural Language Query): Ask questions in plain language and get accurate answers from your data.
- Assisted Insights: AI recommends important trends and changes in your datasets.
- Mobile BI: Access dashboards and reports on the go via a responsive mobile interface.
- Self-service BI: Build and share dashboards without needing advanced technical skills.
Pricing
- Free trial: 30-day trial available on sample or your own datasets.
- Enterprise pricing: Quote-based; tailored for large-scale deployment and embedded analytics.
Pros:
- Enterprise-ready with advanced analytics and AI-powered insights
- Strong data storytelling for clear communication
- Embeddable into other software products
- Supports both non-technical users and advanced analysts
- Automated insights reduce manual work
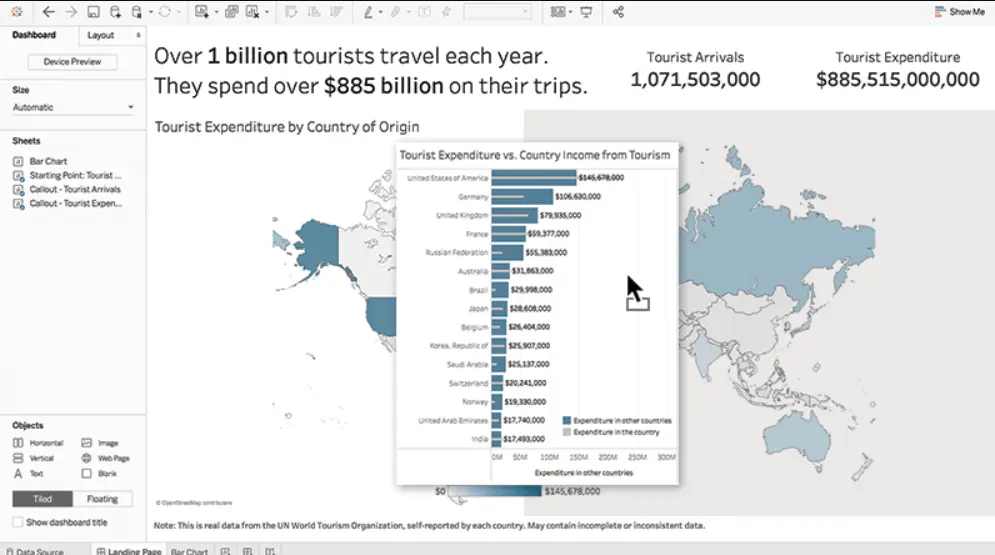
4. Tableau: Best for advanced analysts and enterprises
Another very popular platform, Tableau is great for data analytics, however, it’s hard to master and requires SQL knowledge.
Tableau lets you create interactive dashboards and visualizations that go way beyond simple charts and graphs. It’s got a drag-and-drop interface that makes it relatively intuitive to get started, and it’s great for exploring data and uncovering hidden insights. However, let’s be real – it’s not exactly a walk in the park to master.

While you can create some basic visualizations without being a coding whiz, to truly harness Tableau’s power – things like advanced calculations, complex data blending, and connecting to various databases – you’ll definitely need to know your way around SQL.
And even then, there’s a pretty steep learning curve. But hey, just like with Excel, there’s a ton of resources available online, from official Tableau training to countless community forums and tutorials. So, while it might take some time and effort, there’s plenty of help out there.
Features
- Advanced AI & ML Integration: Tableau seamlessly integrates with artificial intelligence and machine learning (AI/ML) to provide you with insights that you might have missed on your own.
- Performance and Scalability: Tableau is built to handle large volumes of data and perform complex analytics without any issues.
- Mobile Friendly: Tableau is available on both iOS and Android devices, allowing you to view and analyze your data on the go.
Pricing
- Tableau Public freemium plan
- Creator is 75$ user per month
- Explorer is 42$ user per month
- Viewer 15$ user per month
Pros
- Can handle large amounts of data
- Advanced AI modules
- Have an embedded analytics
Cons
- Very limited customization possibilities
- Doesn’t provide live data refreshing
- Doesn’t have a version control
- Requires SQL and VizQL knowledge
- Steep learning curve
- Learn more on Tableau pros and cons overview
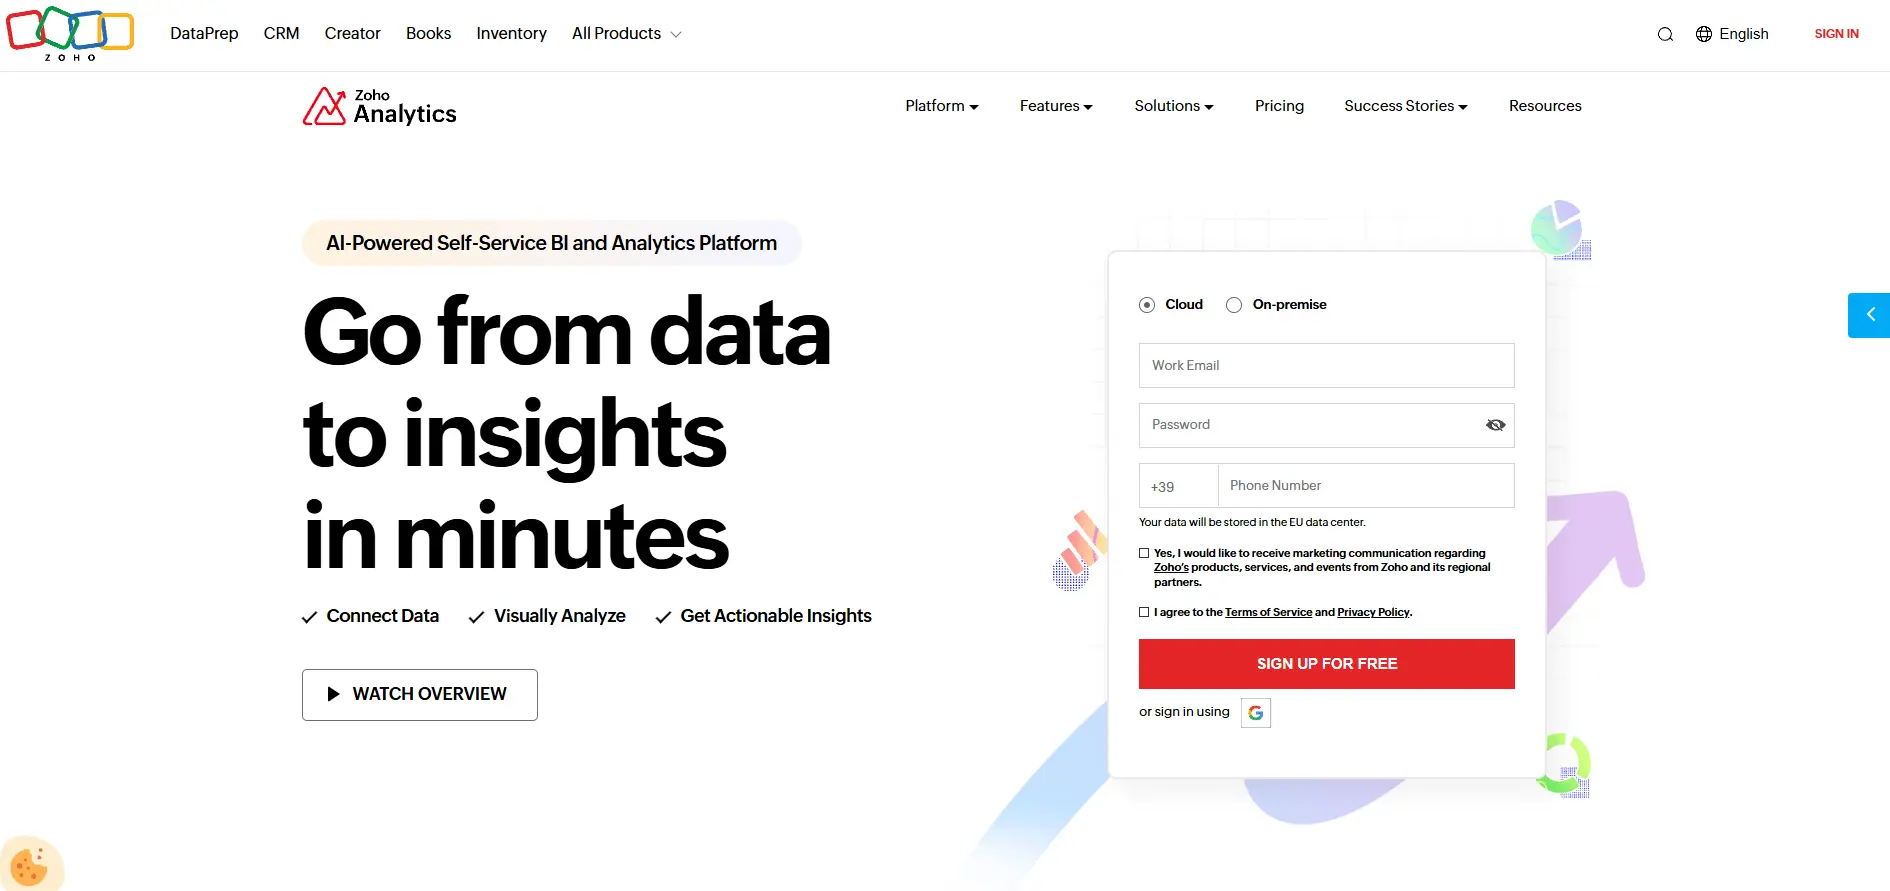
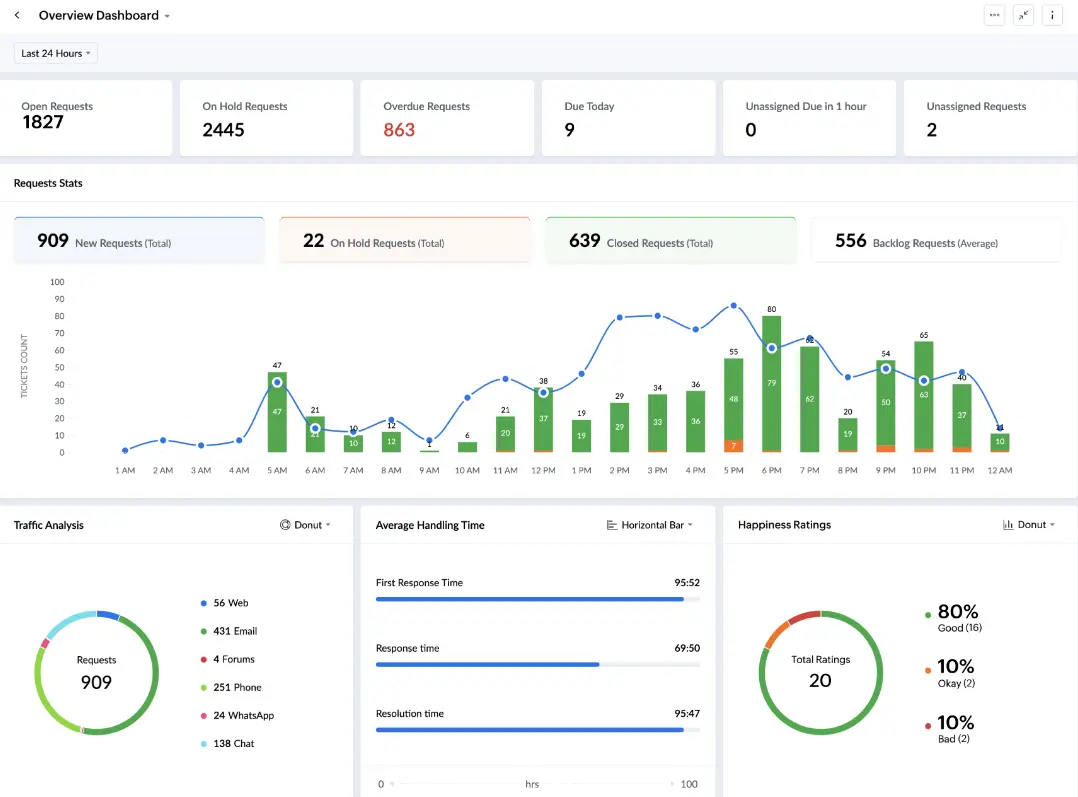
5. Zoho Analytics
Modern data visualization platform that provides different visualization possibilities also great solution for those who already use Zoho tools.
Zoho Analytics lets you create some impressive visuals and reports, and it’s especially powerful when you need to analyze data from multiple sources. It’s got a drag-and-drop interface, so you don’t need to be a coding whiz to get started, and it offers a wide range of chart types, pivot tables, and even some AI-powered features.
However, like most powerful tools, there’s a bit of a learning curve. While it’s generally easier to pick up than something like Tableau, to really unlock its full potential – things like advanced data blending, custom calculations, and embedding analytics into your own applications – you’ll need to invest some time learning the platform.
And while Zoho offers different pricing tiers to cater to various business sizes, it’s worth noting that it can get pricey as your needs grow. But hey, if you’re already using Zoho products, it’s definitely worth checking out, and even if you aren’t, there’s a free plan available to get you started.
Features
- Integrate data from various sources and well-known business applications to create a centralized view of your data.
- Prepare and cleanse your data before creating reports using Zoho Analytics’ powerful data prep tools.
- Leverage AI-powered analytics to make informed business decisions.
- Collaborate with colleagues or clients on reports using Zoho Analytics’ intuitive interface.
- Embed analytics into your applications using Zoho Analytics’ no-code solutions.
- Schedule reports to be automatically generated and sent to designated recipients.
Pricing
- Basic plan 30EUR per month
- Standard plan 60EUR per month
- Premium plan 145 EUR per month
- Enterprise plan 575EUR per month
Pros
- Modern data visualization templates
- Easy to use data preparation and cleansing tools
- AI chat and insights
Cons
- Some documentation & onboarding information are missing
- Steep learning curve
- Embedded charts may encounter speed issues
- Missing intuitiveness
- Report creation still can require IT support
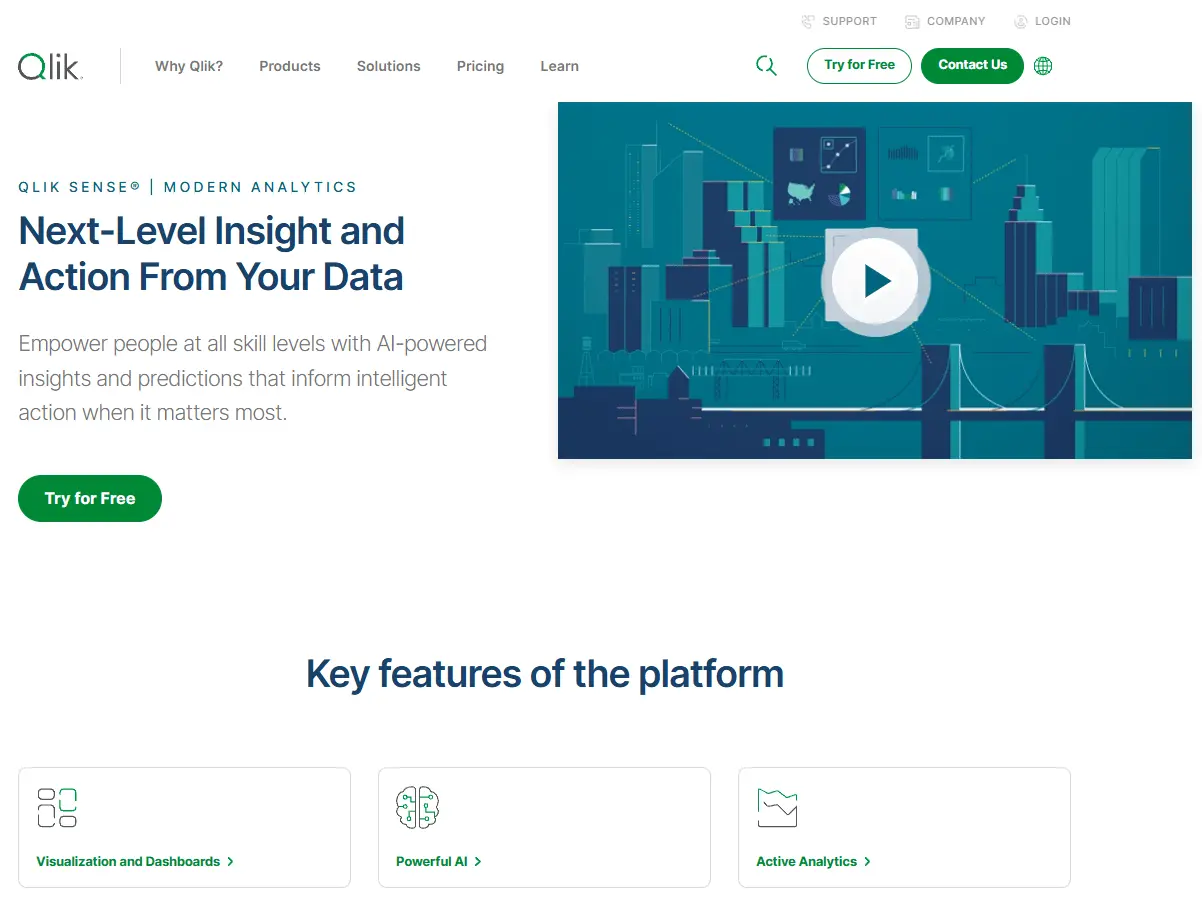
6. Qlik Sense: Best for enterprises and advanced anlaytics
Qlik Sense is a serious contender in the BI world, offering a robust platform that gives the big names like Tableau and Power BI a run for their money. It’s known for its associative data model, which is a fancy way of saying it’s really good at letting you explore data and uncover hidden connections.
Couple that with interactive dashboards, self-service analytics, and some pretty powerful data integration capabilities, and you’ve got a tool that can handle some serious data crunching for businesses of all sizes.
It all comes with a cost though – and we’re not just talking about the learning curve. While Qlik Sense is designed to be more user-friendly than its older sibling QlikView, it still requires a bit of time and effort to fully master its more advanced features.
You’ll likely need some dedicated training or experience with data analysis to get the most out of it. And then there’s the literal cost – Qlik Sense is definitely on the pricier side, especially if you need enterprise-level features or a large number of users. So, while it’s a powerful tool with a lot to offer, be prepared to invest both time and money if you decide to go with Qlik Sense.
Features
- Utilize Qlik Sense’s AI-powered data preparations tools to automate data cleaning, merging, and transformations.
- Use Qlik Sense’s drag-and-drop interface to create visualizations that are tailored to your specific needs.
- Build interactive dashboards that allow you to explore your data in real-time.
- Utilize predictive analytics to forecast future trends and make informed business decisions.
- Take advantage of Qlik Sense’s high-performance cloud platform to analyze large volumes of data in real-time.
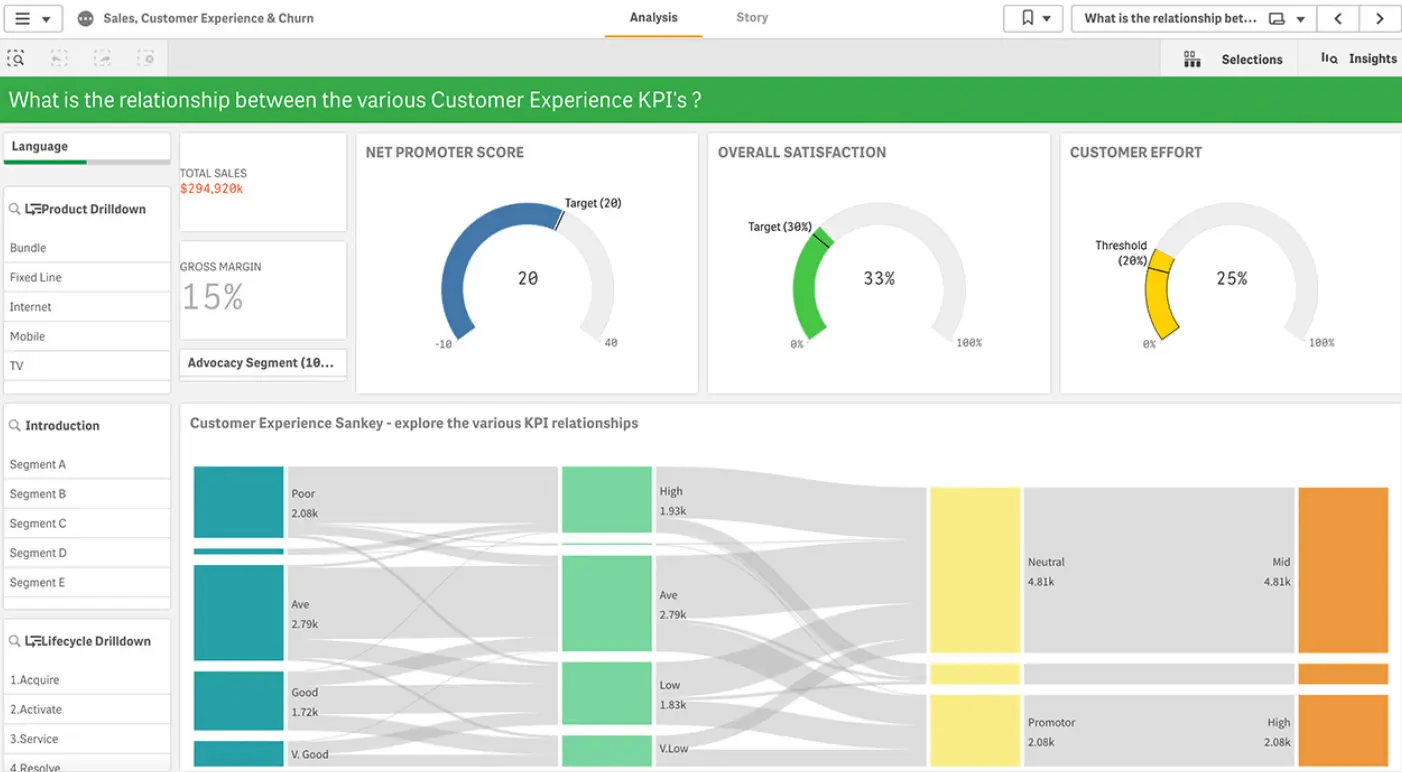
Qlik Sense dashboard screenshot example from their website
Pricing
- Standard plan costs 20$ a user per month (if you add more than 10 users)
- Premium 2700$ per month with 50GB space
- Enterprise level can ask for a quote
Pros
- AI-assisted data preparation
- Advanced and predictive analysis
- Embed functionality
- Cloud platform
Cons
- Data extraction is very limited
- Setup requires help from IT and data analysts
- Live data reporting isn’t supported
- Steep learning curve
- You can experience speed issues when working with large amounts of data
Related Article: Top 10 Best Business Intelligence Tools Comparison
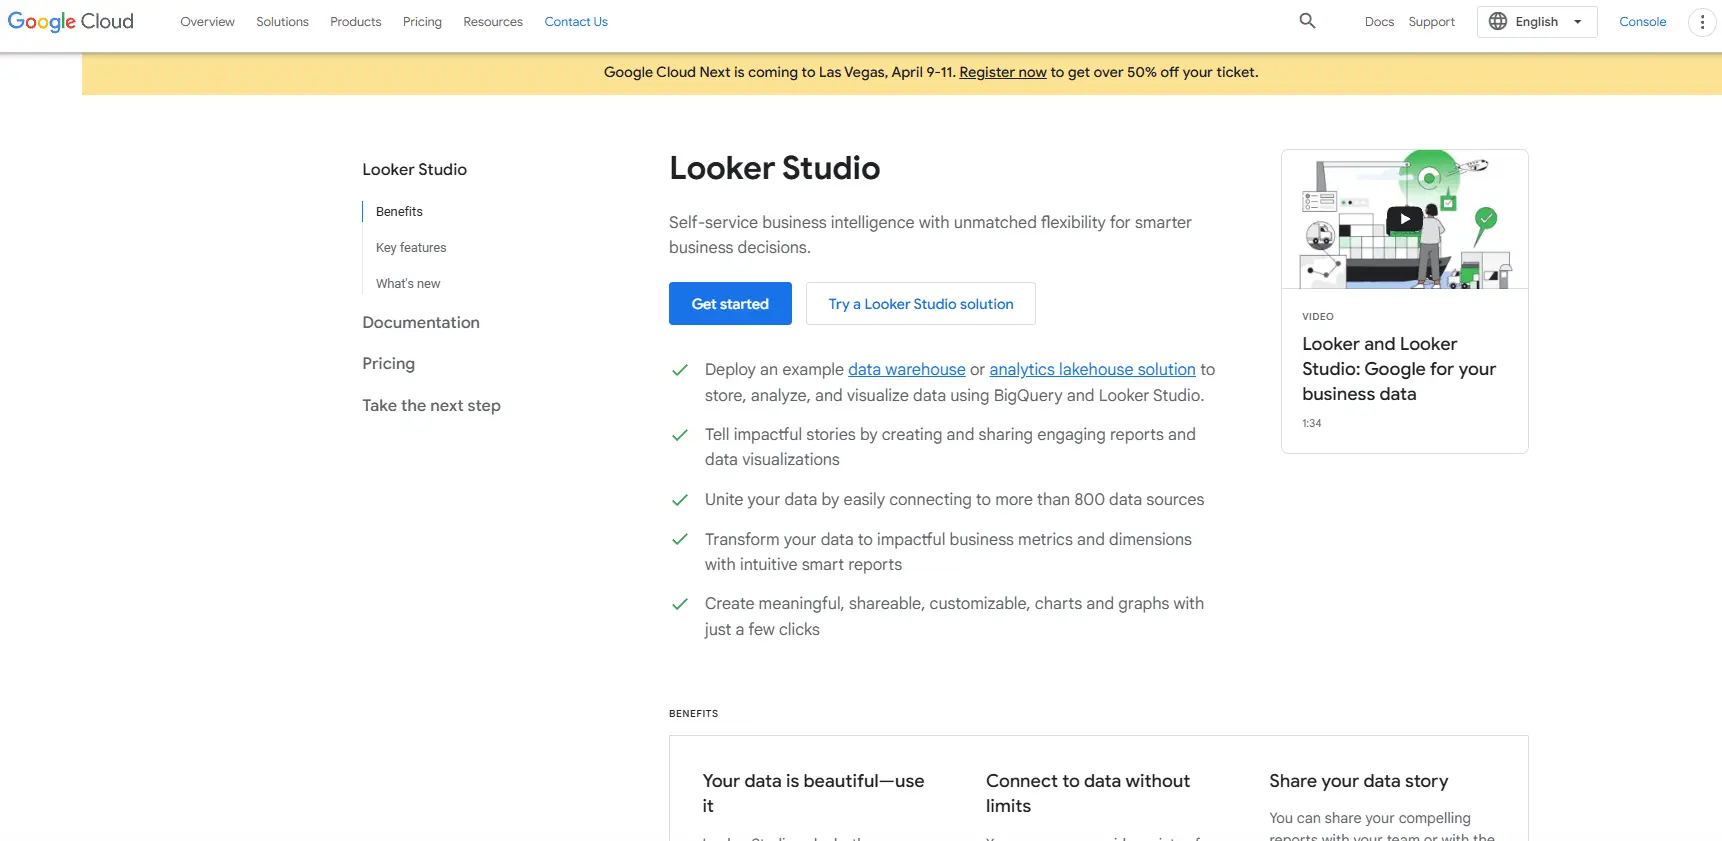
7. Looker: Best for enterprise
Not to be confused with the older Google Data Studio (now Looker Studio), Looker is Google’s powerhouse platform built for serious data analytics. We’re talking sophisticated data modeling and exploration, detailed visualizations, and robust security and governance baked right into the tool.
Think of it as the big leagues of data analysis. These are just some of the many reasons why large organizations gravitate towards Looker.
The easiest way to tell this is an enterprise-grade product? The pricing. We’re talking serious investment here, easily north of $30k per year – and that’s just to get started. It’s definitely not designed for casual users or small teams. It’s also known for having a steeper learning curve, so newbies might find themselves a bit lost without some serious training or dedicated data expertise on their team.
And while Google is a massive company, their customer support for Looker has been known to be… let’s just say, less than stellar, which can make troubleshooting even more challenging. So, while Looker is incredibly powerful and well-suited for complex data analysis and internal reporting within large enterprises dealing with big data, it’s probably overkill (and over budget) for smaller businesses or those just starting out with data visualization.
Features
- Real-Time Insights and Reports: Gather real-time insights and reports from your preferred cloud platform.
- Embedded Analytics: Integrate Looker into your business applications.
- Connectivity with Other BI Platforms: Connect Looker to your existing BI solutions.
- Vast Library of Templates: Leverage Looker’s extensive library of custom templates.
- LookML for Data Modeling: Build semantic data models using LookML, which is built around SQL for data modeling.
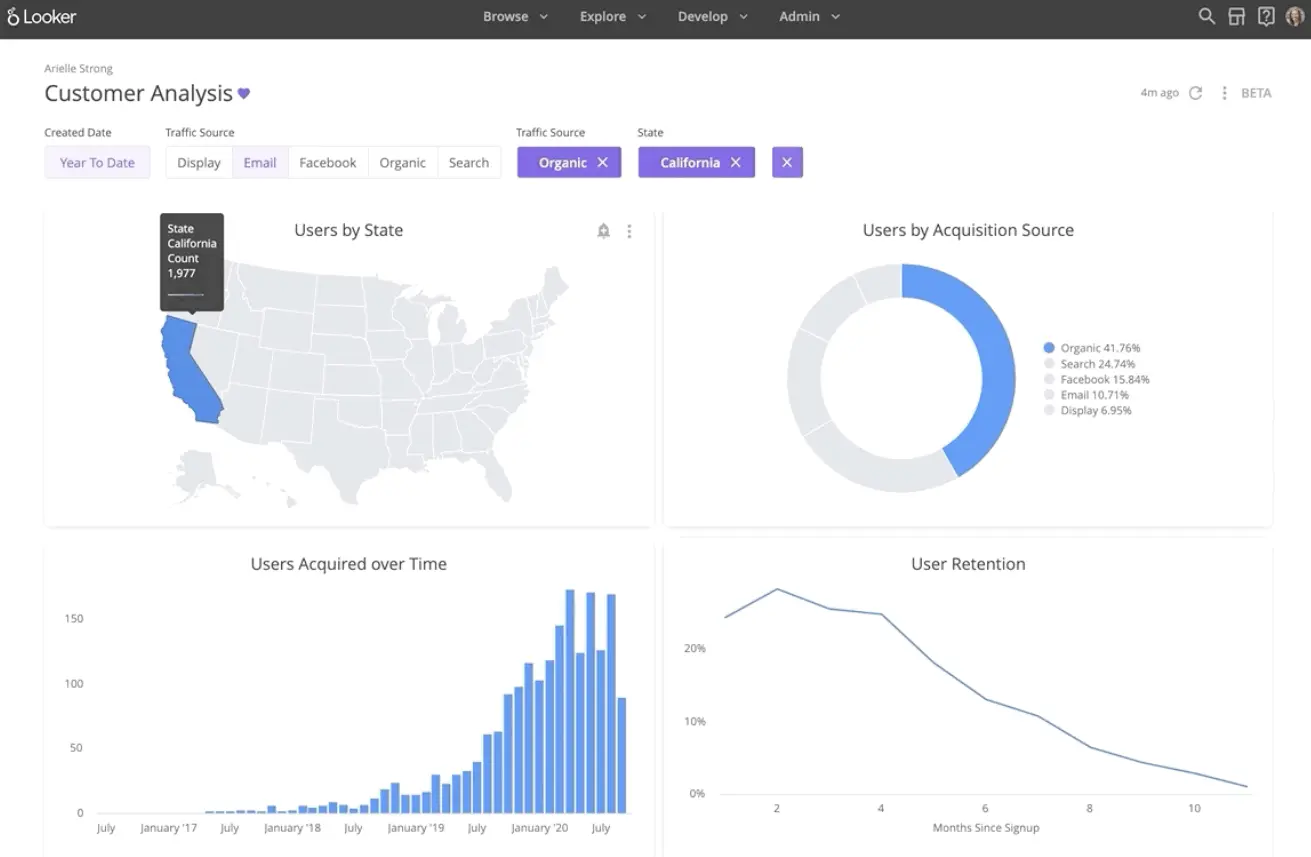
Looker dashboard screenshot from Google Cloud website
Pricing
- Standard plan is 5000$ per month
- Enterprise and Embed plan requires a quote
- Separate licensing:
- Developer costs 125$ user per month
- Standard user costs 60$ per month
- Viewer license 30$ per month
Pros
- Can process big amounts of data
- Offers extensive variation possibilities, the ease of use depends from developer
- Large amount of premade templates
- Real life data analytics from your choice of cloud
Cons
- Steep learning curve
- One of the most expensive platforms
- Limited customer support
- Lack of filtering options
- Complex user management
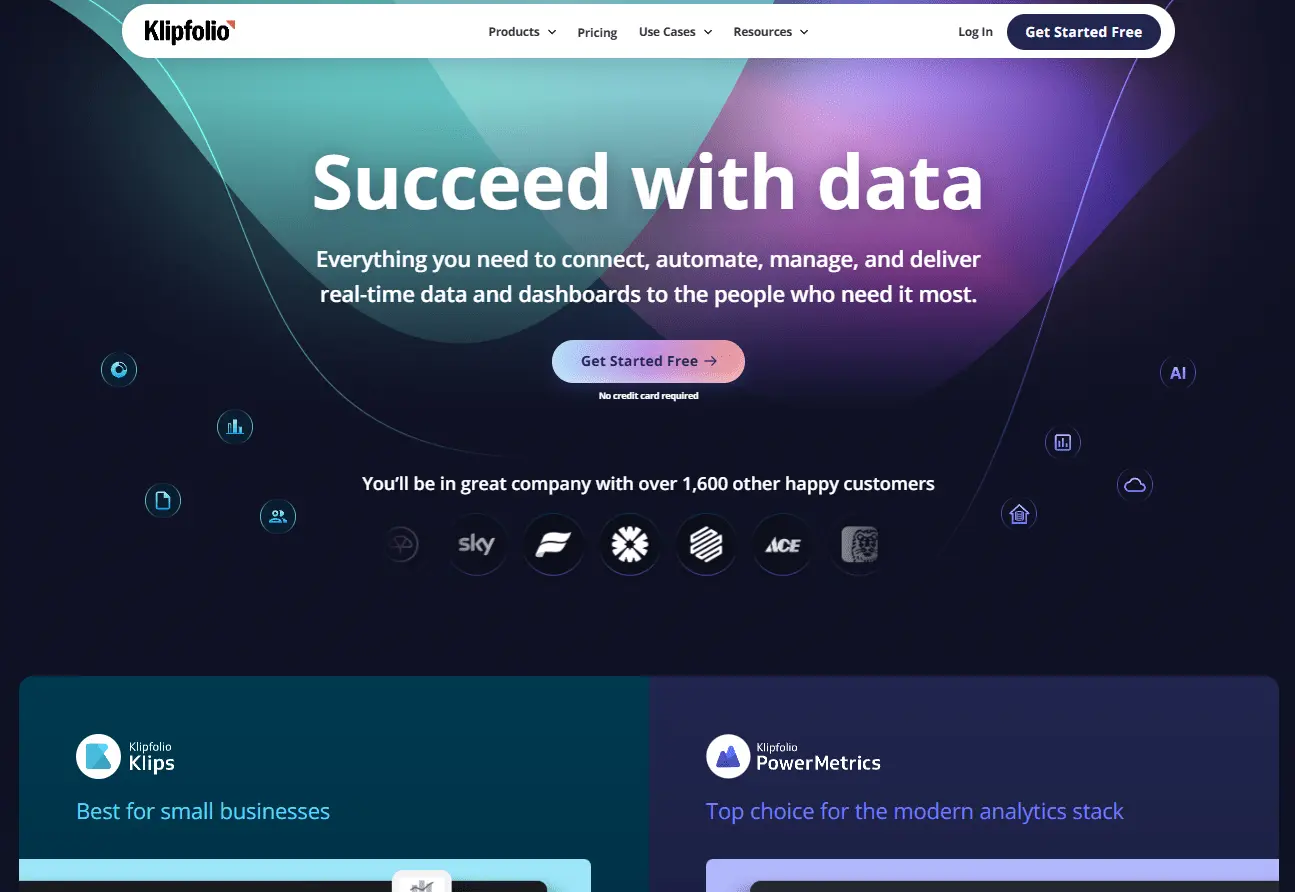
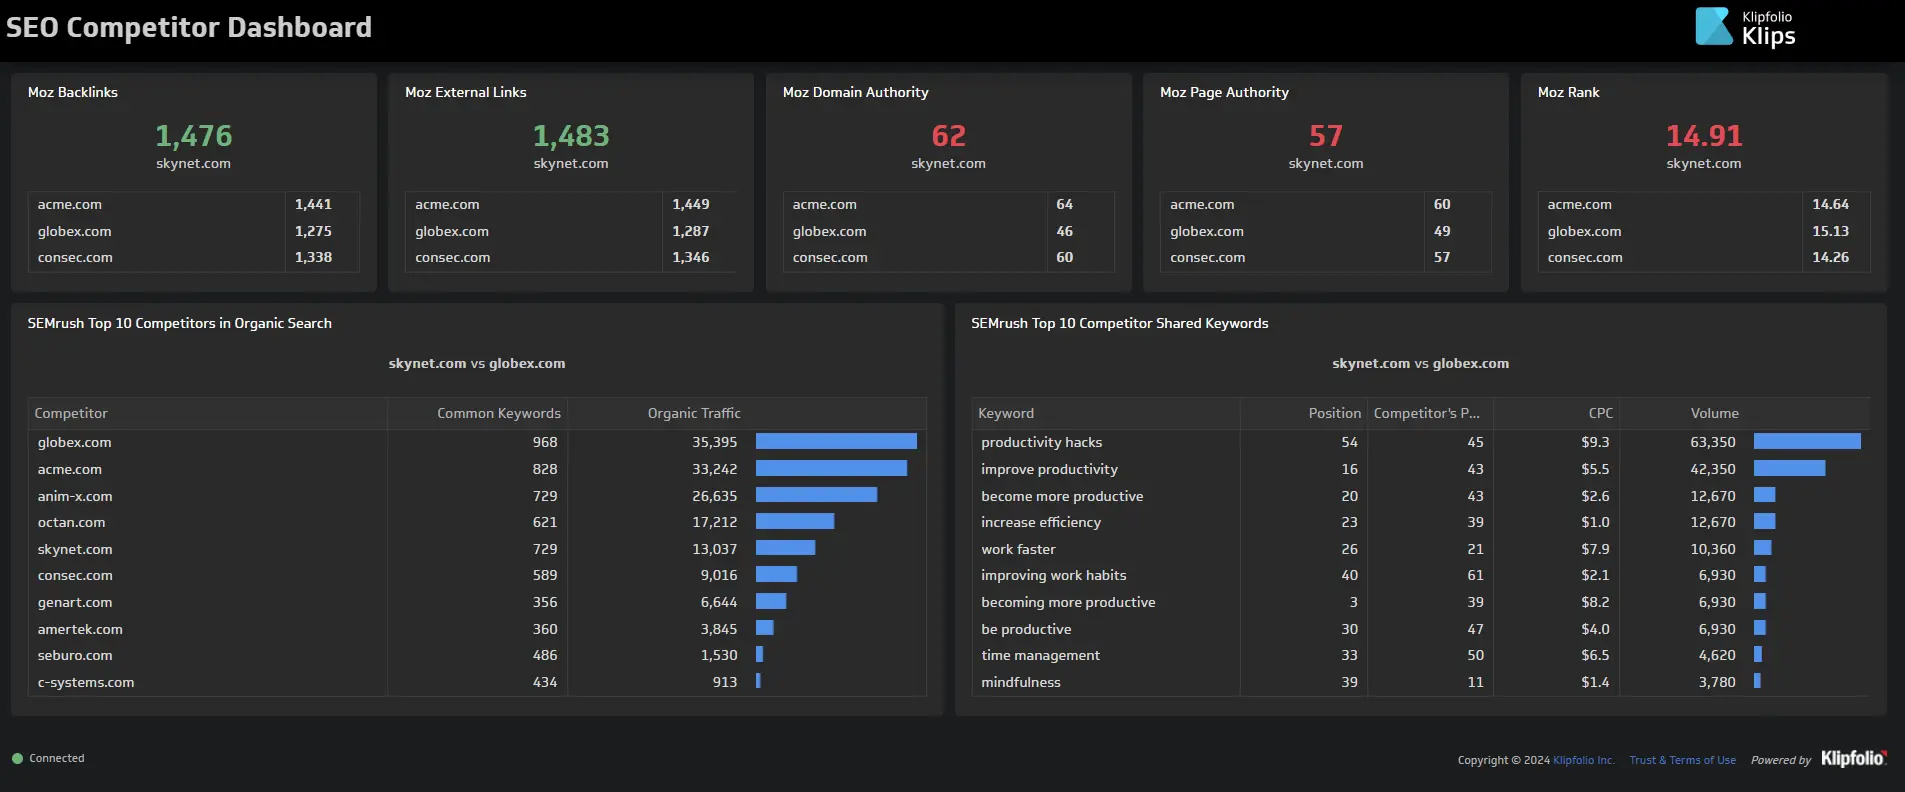
8. Klipfolio: Best for small businesses
If you run a business that’s heavily focused on tracking key performance indicators (KPIs) and needs a central hub for all your reporting, Klipfolio is definitely worth a look. It’s not your typical all-in-one BI platform; it’s more specialized, built around the idea of creating and managing metrics.
Think of it as a dedicated KPI dashboard builder. This means everything in Klipfolio revolves around defining metrics, connecting to data sources, and then visualizing those metrics in dashboards.
You’ll have to get pretty comfortable with the concept of metrics and data connections to get the most out of it. It’s not as intuitive as some other drag-and-drop dashboard tools, so there’s a bit of a learning curve, especially if you’re not already familiar with data integration and metric definitions.
Also, while Klipfolio offers different pricing tiers, it’s not exactly the cheapest option out there, especially if you need to connect to a lot of different data sources or have a large team. So, if your primary need is to build and monitor KPIs across your business and you’re comfortable with the metric-centric approach, Klipfolio could be a good fit. But if you’re looking for a more general-purpose BI tool for broader data exploration and analysis, you might want to explore other options.
Features
- Create Your Own Metrics: Customize and build your own metrics to track key performance indicators (KPIs).
- Integrate Data from Over 100 Data Sources: Connect to over 100 data sources, including cloud-based, on-premises, and self-hosted databases.
- Use Pre-Made Dashboards for Live Data: Leverage Klipfolio’s library of pre-built dashboards to visualize real-time data.
- Generate Data Feeds Using SQL: Create custom data feeds using SQL or other methods for further analysis and customization.
- Prepare Data Before Reporting: Cleanse, transform, and prepare your data using Klipfolio’s data preparation tools before reporting on it.
Pricing
- Freemium plan
- Standard plan that costs 300$ per month
- Custom plan will cost 800$ per month
Pros
- More than 100 data sources
- Live data reporting
- Easy sharing options
- Many pre-made report templates
Cons
- May experience delays and performance issues
- Doesn’t have drag and drop functionality
- Missing some support documents
- Backend report creation setup is complicated
Other Visualization Tools
- Domo – large BI platform for medium to enterprise businesses
- Datapad – easy to use data visualization tool
- Trevor – visualization platform that doesn’t require data analyst
- Databox – user-friendly and offers automated reporting.
- Datapine – requires a profound understanding of analytics and often necessitates IT assistance.
- Datawrapper – more used for data visualization rather than BI tool.
- Infogram – provides only data visualization capabilities.
Summary
The best data visualization tool depends on individual needs and goals. To choose the right tool, consider the goal, data sources, user experience, collaboration, and budget.
Ajelix BI is a great option for small to medium business owners, entrepreneurs, or anyone who needs some data visualization. It offers a no-code editor, quick setup, shareable reports, collaborative access, seamless integration with Google Sheets, one-click reports, interactive reports, real-time insights, and AI-powered analysis.
Power BI is another well-known data visualization platform that offers extensive freemium plans and advanced IT or analytics knowledge. Pricing plans vary from 19$ per user to 5000$ and more per month.
FAQ’s
Data visualization tools are applications that help you create charts and other visuals from your data. These tools can help you to understand your data better, identify patterns and trends, and make better decisions.
There are many great data visualization tools available, but some of the most popular include:
– Ajelix BI
– Power BI
– Tableau
– Zoho Analytics
– Qlik Sense
– Looker
– Klipfolio
If you are a small business owner or entrepreneur, Ajelix BI is a great option. It is easy to use and affordable. It also has a number of features that are specifically designed for small businesses, such as the ability to create interactive dashboards and the ability to connect to Google Sheets.
There are a number of free data visualization tools available, including Ajelix BI and Zoho Analytics. However, these tools typically have fewer features than paid tools.
Ready to try Ajelix BI?
From data to report in one minute or less with Ajelix AI Agents


