5 Best Domo Alternatives & Competitors 2026

So many BI tools out there that it’s hard to navigate the world of business intelligence. Domo is one of those platforms that helps companies connect all business data one-place. Domo software was launched on 2010 and now has 0.75% in BI market.
The platform is equipped with advanced data analytics features that for some users may seem great, however, for others the usability can get overwhelming. This tool at first was created to ease the data analytics process but it’s no secret that the usability can get challenging.
Change the way you work with agentic AI
One-click dashboards,KPI tracking, and AI-powered insights—for work that actually gets done.

This platform is great for many businesses, however, there is some functionality that this tool lacks. We will take a look at the top 5 best domo alternatives to ease the data analytics struggles to help you choose the right platform for your needs.
5 Best Domo Alternatives for 2026
Here’s our list of top Domo alternatives for data analytics and visualization of the year 2026:
What is Domo?
Domo is Business intelligence platform that help companies connect all data in one place to help manage business processes. With data connections and advanced analytics this platform can help organize data to make data-driven decisions across teams.
Who are the Domo users?
The platform have many features but that doesn’t mean everyone can benefit from it. After doing some research we found out who are the ideal users for this software:
- Enterprise companies who deal with big amounts of data from various sources.
- Businesses who have an experienced data analysts on board.
- Industries with large amount of data, such as, manufacturing, e-commerce, etc.
- Data analysts and experts who can setup the platform.
What are Domo features?
Here are the most important features that this BI application provide:
- Connect all your data in a single dashboard
- Live data integration and refreshing
- Self-service BI
- Collaboration features: Bulk Administration, personalized data permissions
- Metrics to measure business data
- Automated updates
- Available on mobile devices
- User level security
This platform is great for experts, developers and experienced data analysts. However, it might get tricky once you’re not data analytics or IT expert. Plus, it can get pricy once you start to use this platform to full capacity.
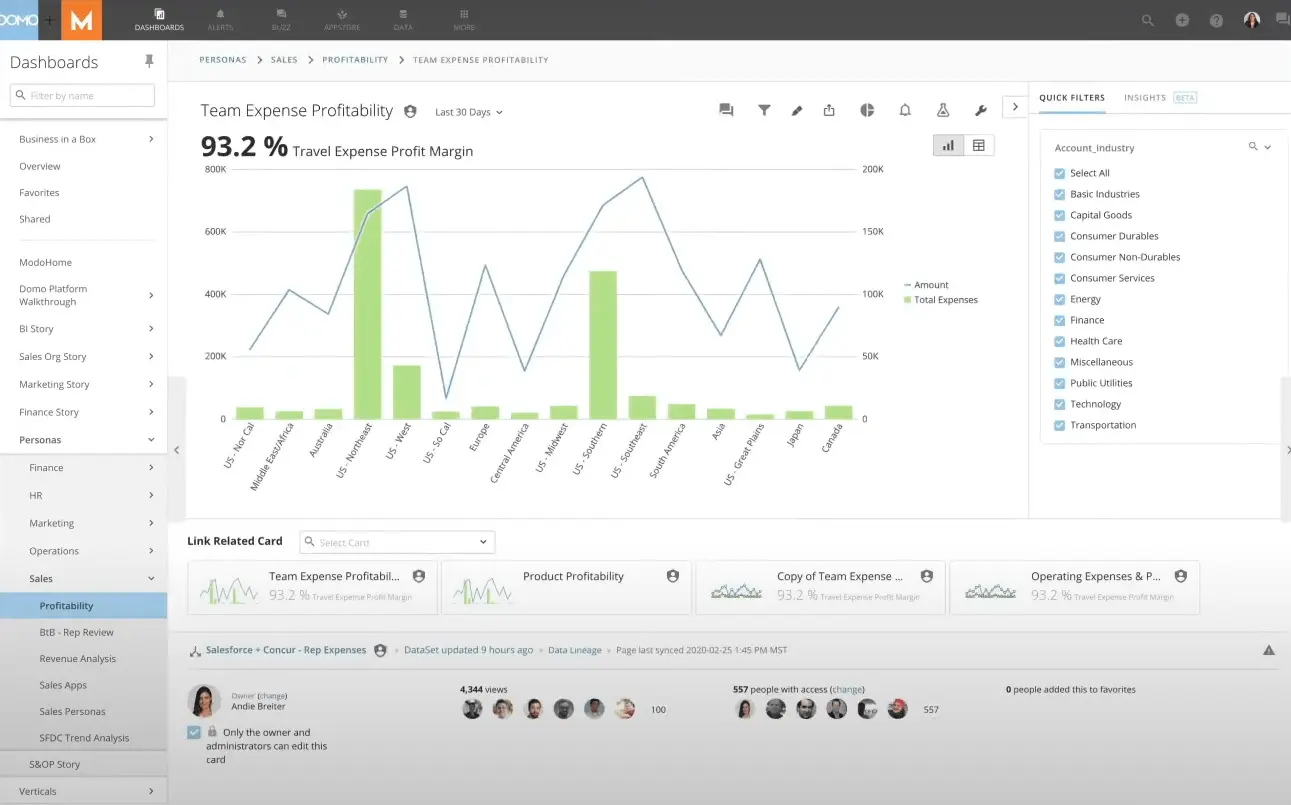
Domo BI dashboard screenshot from https://www.youtube.com/watch?v=BnBsEjunfDs&ab_channel=Domo
What are Domo cons & limitations?
There are many cons that users on internet highlight, let’s take a look at the few of the points:
- Steep learning curve: many users admit that it’s hard to keep up with all the functionality. Additionally, there are missing onboarding documents and they are hard to follow.
- The platform can get expensive with the setup and the data refreshing.
- Visualizations are a little outdated compared to other platforms
- Hard to build the dashboard yourself if you’re not an expert. Even though it’s a self-service BI platform casual users still need to order reports to data analysts.
- You can experience speed issues when working with large amounts of data.
- You can create custom designs, however, you need some coding knowledge to do that.

Screenshot for Domo Business Intelligence reviews from https://www.trustradius.com/products/domo/reviews?qs=pros-and-cons#reviews
The cons for this platform can be very subjective as each organization have different needs and possibilities. Next chapter will summarize available pricing plans.
What’s the Domo pricing?
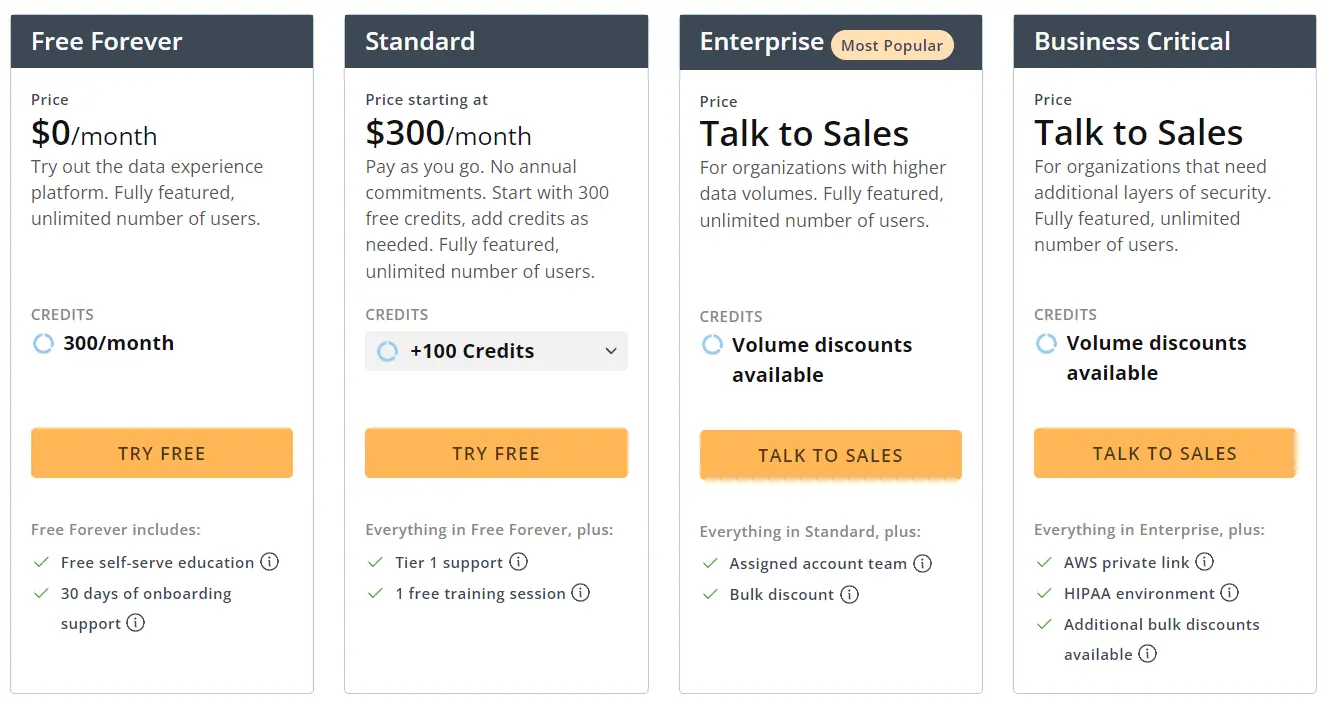
Domo BI can get pricy as the costs can pile up depending on the amount of credits you use. There are four plans available:
- Free: this plan included 300 credits and unlimited count of users.
- Standard: This plan is for companies with small amount of data. Plan starts from 300$ per month with unlimited number of users and includes 300 credits with possibility to add more credits. The more credits you need, the more you pay.
- Enterprise is a custom plan for organizations with high data volumes. Contact sales team to get a quote.
- Business critical with additional security layers.
When choosing this software you should keep in mind that the costs will pile up. However, it could be very beneficial in the long term for companies that deal with big amounts of data. Not so much for small companies.
Top 5 Domo Competitors & Alternatives
Based on the Accenture report in 2020, 74% of employees report feeling overwhelmed or unhappy when working with data. Domo is one of the players in the market, let’s take a look how we can turn these statistics into something more positive by looking into best alternatives.
1. Ajelix
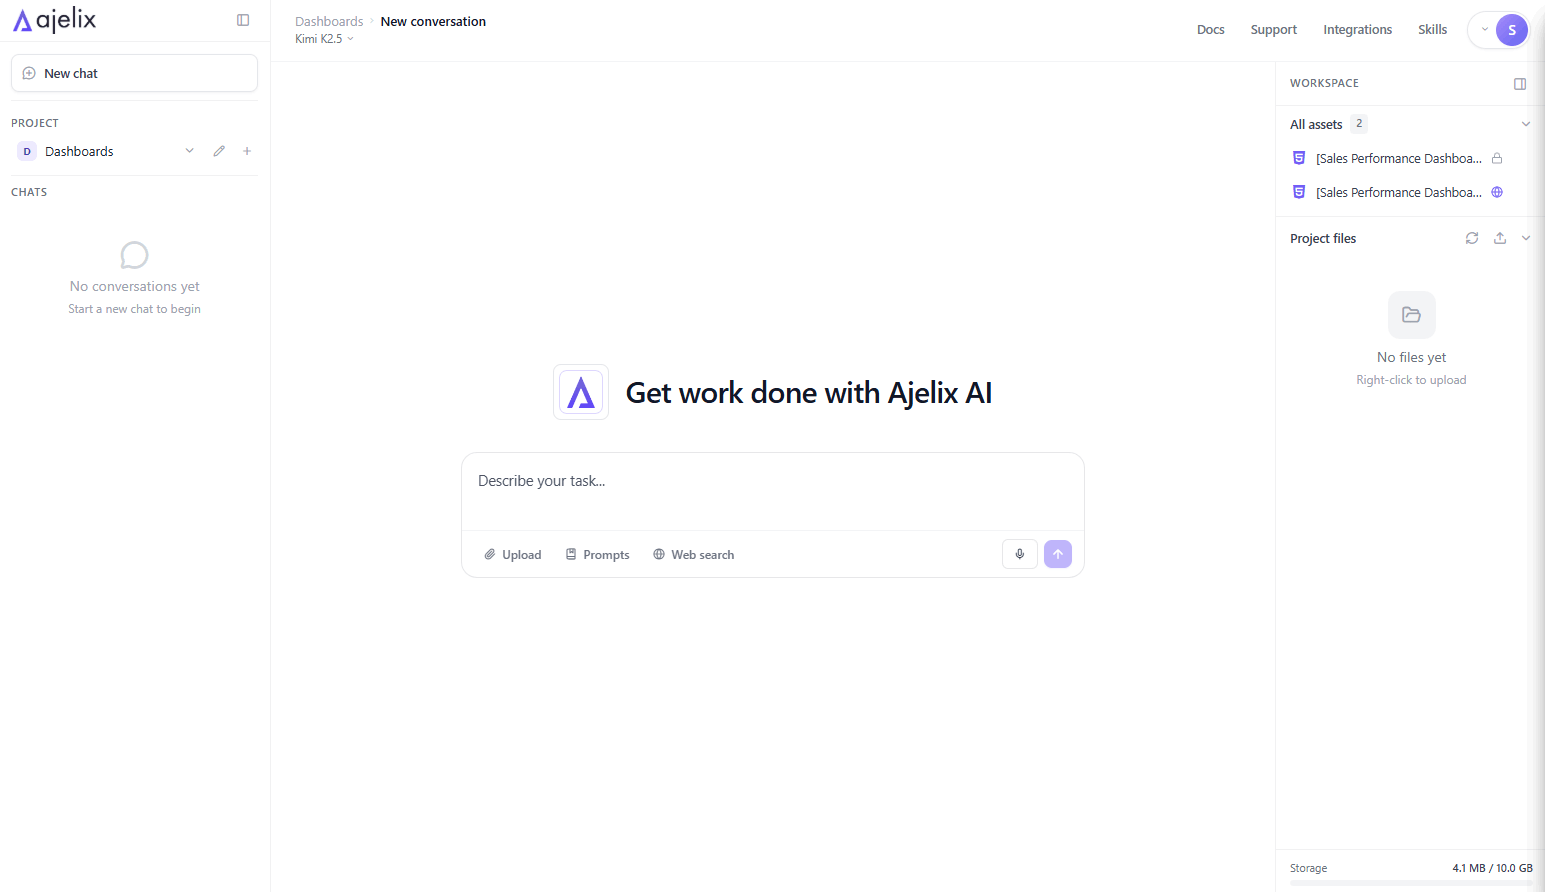
Ajelix stands out from typical business intelligence tools available in the market. Designed for effortless user interaction, this tool facilitates the swift and seamless report creation for non-technical users.
Utilizing a no-code editor, users can generate reports within minutes. One of its prominent strengths lies in its user-friendly nature, eliminating the need for complex setups or training sessions.
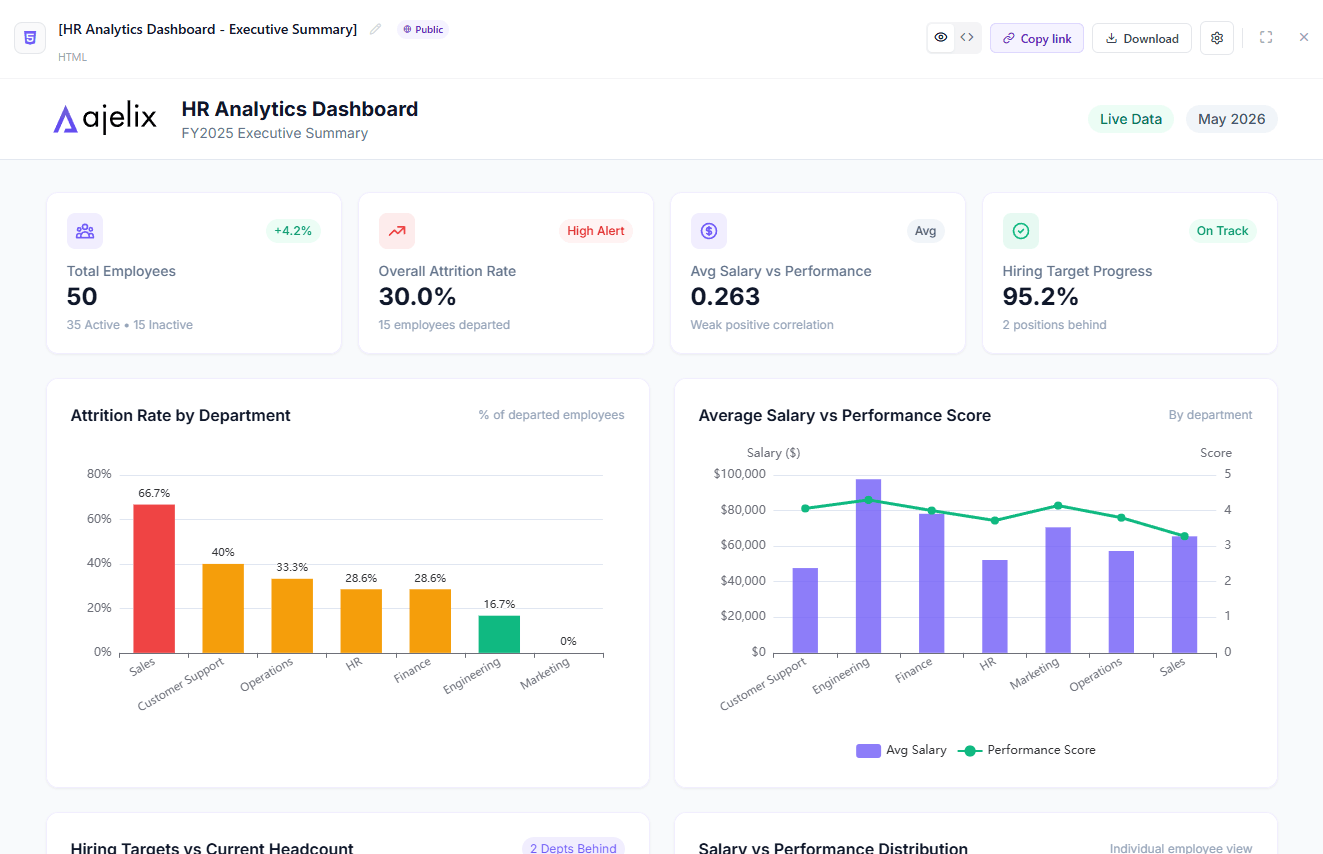
Ajelix HR analytics dashboard screenshot.
What are Ajelix Features?
- Easy AI agent – describe what you need, get working assets instantly.
- No training required. Sign up and start creating immediately.
- Conversational AI for instant insights and visualizations.
- Import from Google Sheets, Excel, PDFs, CSVs, presentations and documents.
- AI dashboards in seconds. Upload up to 1GB, no manual formatting.
- Auto-clean data and calculate KPIs from any file.
- Share dashboards and apps with one-click links.
- Persistent workspace remembers your files across chats.
- AI explains trends and delivers actionable recommendations.
- Create dashboards, Excel files, presentations, and web apps in one click.
Who Are The Ideal Ajelix users?
- Individuals and solo entrepreneurs who need to make data driven decisions fast
- Small to medium businesses
- Solo entrepreneurs
- Freelancers
- Start-ups
- Non-technical teams
- Excel users who want to create reports more efficiently
What is the Pricing?
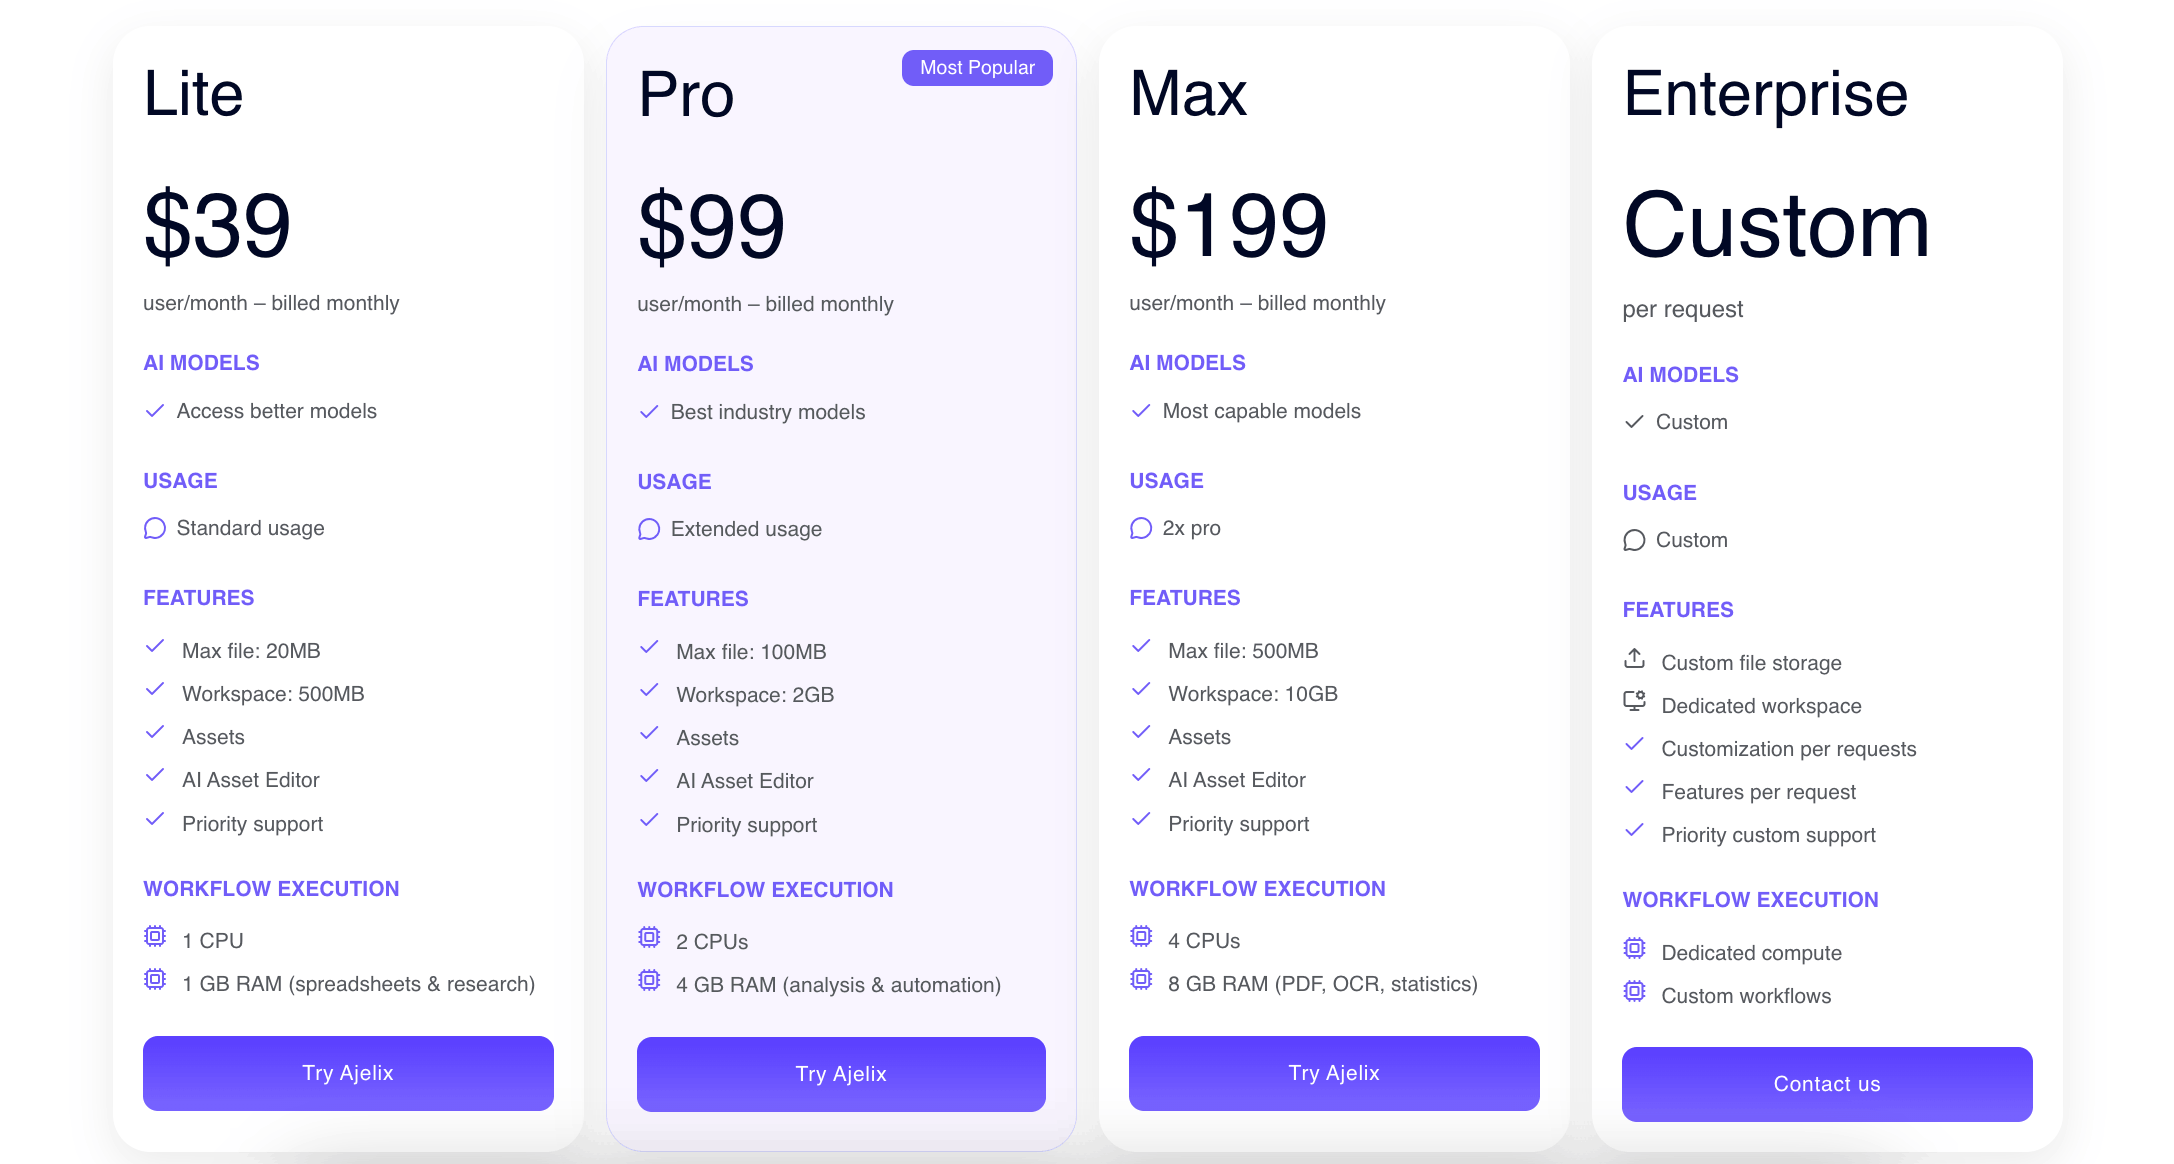
Ajelix data visualization platforms pricing is straightforward:
- You can test it for free before committing.
- The Lite plan is $39/month for individuals who need more power – 20MB files, 500MB workspace, and asset creation.
- The Pro plan at $99/month unlocks the full experience with best-in-class models, 100MB files, 2GB workspace, and extended usage.
- The Max plan at $199/month is built for heavy workloads – 500MB files, 10GB workspace, and 2x the processing power.
Once you choose Ajelix team you’ll support individual developers who strive in creating meaningful tools to help businesses become more effective. With regular updates and instant support you will get more value in the long run.
Reporting gives you a headache?
Upload your data and create professional reports with agentic AI

Start free
Try free and upgrade whenever
2. Tableau
Tableau’s is one of the leader BI platforms they have secured almost 16% of all data visualization users worldwide. The advanced features and scalability makes a popular choice for organizations seeking analysis tools.
This platform is great for enterprise companies looking for big data analytics and next level data insights.
Who are Tableau Users?
- Advanced data analysts
- IT specialists
- Enterprises with large amounts of data
- Experts who work with complex data analytics
What are Tableau Features?
- Employ intricate data flows, preparation, and cataloging to effectively manage and link data.
- Seamlessly integrate advanced AI and ML capabilities through Einstein Discovery.
- Utilize an intuitive drag-and-drop interface available on the desktop version.
- Benefit from embedded analytics functionality.
- Conduct data preparation prior to creating visualizations.
- Choose the preferred storage location for your data: either on the server or in the cloud.
- Access Tableau through its mobile version for on-the-go data insights.
- Execute complex analytics seamlessly, even with substantial data volumes.
- The platform is adept at handling demanding tasks, ensuring optimal speed performance.
- Enjoy the convenience of a mobile-friendly version for enhanced accessibility.
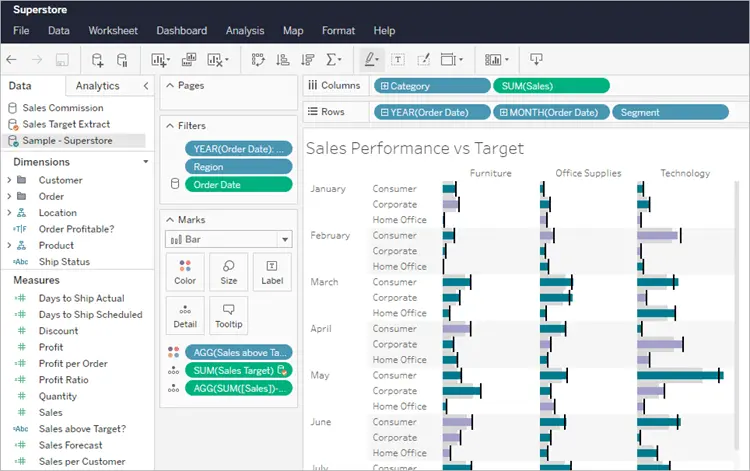
Tableau editor screenshot from https://help.tableau.com/current/pro/desktop/en-us/web_author_build_view.htm
What’s the Pricing?
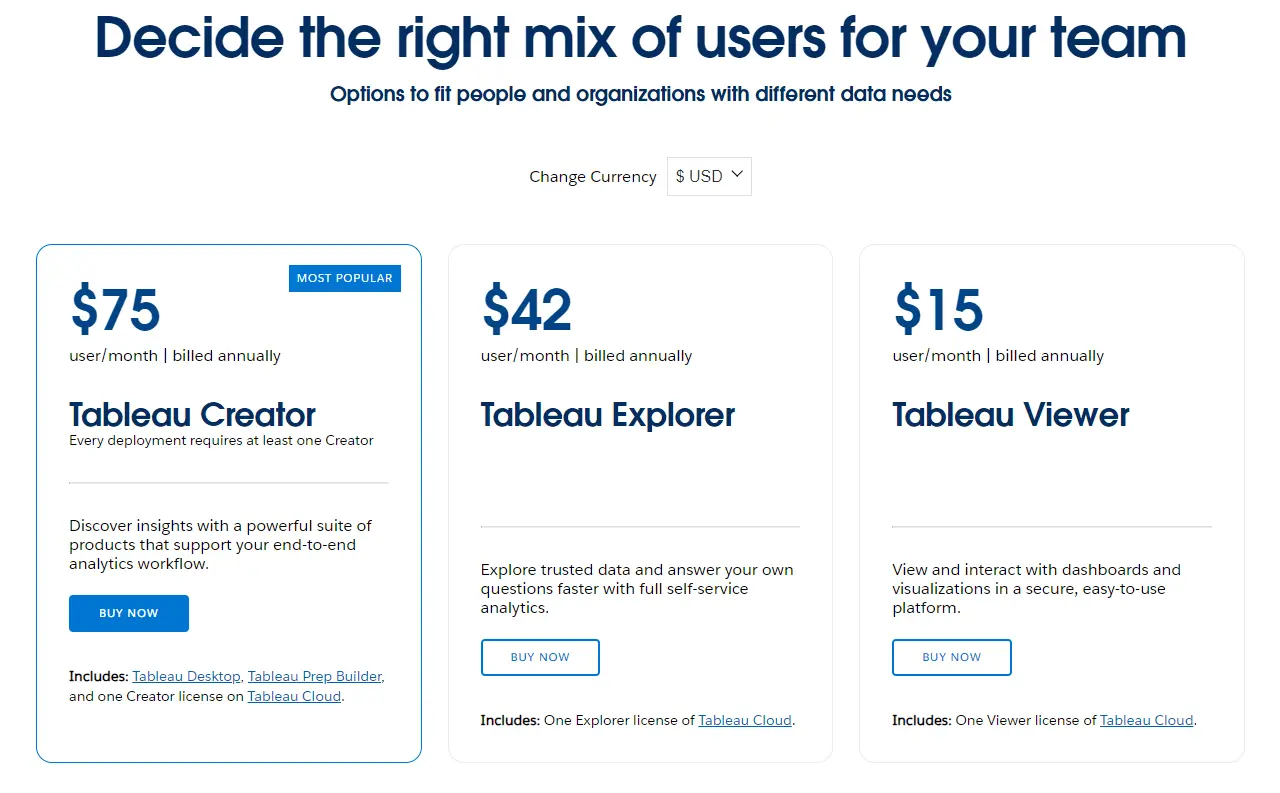
- Tableau Viewer costs 15$ per user a month. Plan includes ability to view the reports your analysts have created.
- Explorer costs 42$ per user a month and you can edit existing reports and collaborate with other users on platform.
- For your company, at least one user should possess the Creator license, enabling the creation and sharing of reports. The cost for this license is $75 per user per month.
What are the Tableau Limitations & cons?
- Tableau lacks automatic report refreshing, necessitating manual efforts for updates.
- The pricing plan lacks flexibility and is among the most expensive solutions with annual subscriptions.
- Proficiency in SQL and/or VizQL is required, potentially incurring high costs to enlist an expert for report setup and maintenance.
- Visualization options are limited; unlike other platforms, custom visuals cannot be imported.
- Each visual must be formatted individually; there is no option to apply the same style to all reports.
- The absence of version control is a notable drawback.
- Dashboards are not responsive, requiring the creation of separate versions for mobile and desktop.
- Manual approval for any changes to reflect in the report.
Related Article: 5 Tableau Alternatives To Explore Data With AI
3. Looker
Looker provides a self-service feature, allowing users to construct their custom applications. Additionally, it offers the capability to engage in real-time conversations with business data. Furthermore, the platform supports the generation of automatic insights and trends derived from your data.
Who are the ideal Looker users?
- Enterprise level companies
- Data analysts who are experienced with SQL and Google solutions
- Companies with big data
What are the Looker features?
- Real time insights and reports from your choice of cloud.
- Available embedded analytics
- Option to connect with other BI platforms
Looker dashboard editor screenshot from https://cloud.google.com/looker/docs/creating-visualizations
What are Looker limitations & cons?
- Challenging learning curve: Acquiring proficiency in SQL and advanced analytics is essential for configuring this BI platform.
- High cost: This platform ranks among the priciest options we’ve evaluated, potentially making it a suitable choice for enterprises but potentially excessive for small to medium-sized businesses.
- Limited customer support: Obtaining assistance can be challenging, with extended wait times for support.
- Performance concerns: Some developers have reported lagging issues, particularly when handling substantial amounts of data.
What’s The Pricing?
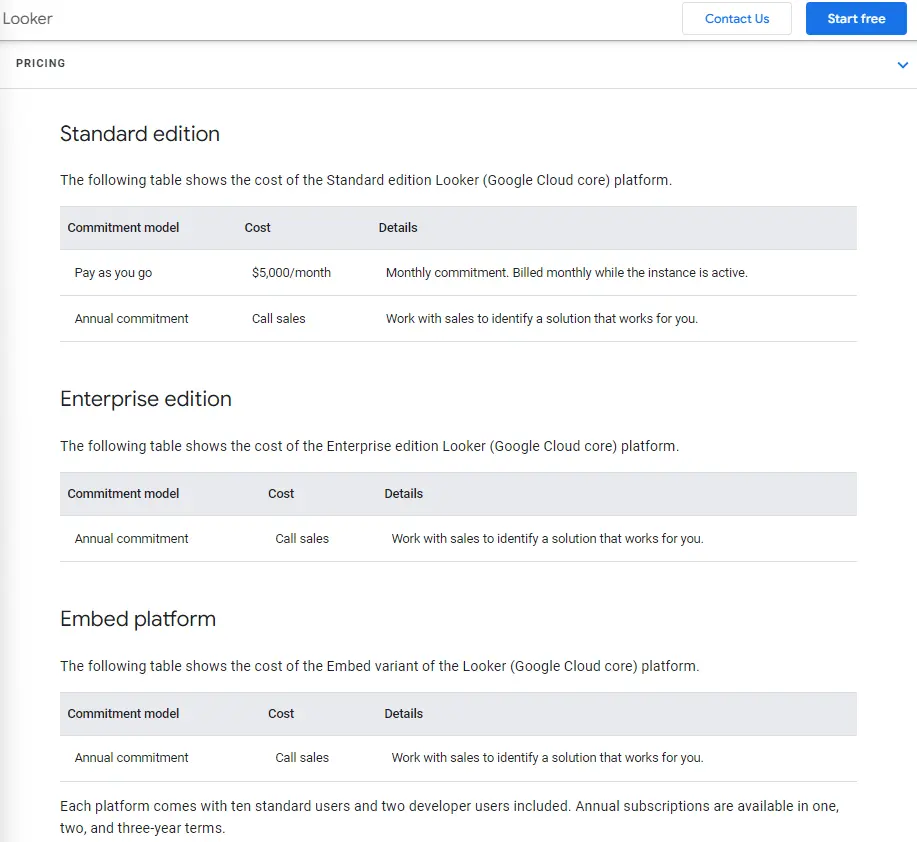
Looker’s pricing plan is separated in two parts: individual licensing and packages. Here are 3 platform packages:
- The Standard edition is designed for small organizations with up to 50 users, priced at $5000 per month. This package includes 10 standard users, 2 developer users, and allows up to 1000 query-based API calls and 1000 administrative API calls.
- The Enterprise edition provides an equivalent number of licenses but distinguishes itself with a higher allocation of API calls, allowing for 100,000 query-based API calls and 10,000 administrative API calls. For a quote, please reach out to the sales team and take into account an annual commitment.
- The Embed edition includes the same number of licenses, with a substantial increase in API call allocations: 500,000 query-based API calls and 100,000 administrative API calls. For pricing details, please get in touch with our sales team.
Looker pricing screenshot from https://cloud.google.com/looker/pricing
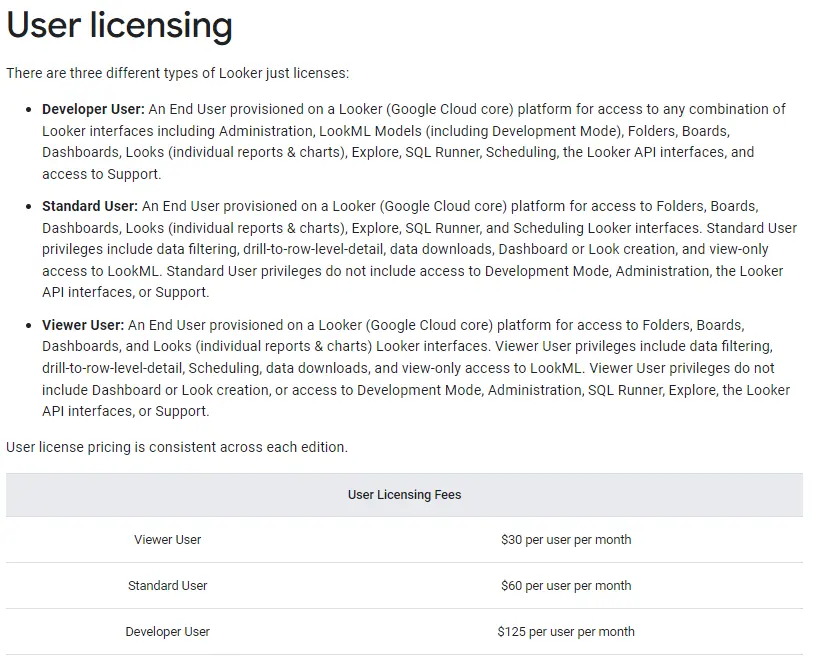
You also have the option purchase individual licenses:
- The Developer user license grants the ability to create reports and provides access to all features offered by this BI platform. The cost for this license is $125 per user per month.
- The Standard user is equipped to use and analyze existing reports but does not have access to development mode, administration, API, and support. This user type is priced at $60 per user per month.
- The Viewer user is limited to viewing and interacting with reports only. The license for this user is $30 per user per month.
Looker pricing for user licensing screenshot from https://cloud.google.com/looker/pricing
Related Article: Top 5 Looker Alternatives For Non-Tech Teams
4. Qlik Sense
The qlik sense was launched on 2014 this platform offers advanced AI data analytics insights and actions from your data. They offer data visualization, AI model, active analytics, hybrid cloud platform.
Who are the ideal Qlik sense users?
- Data analytics experts
- Medium businesses
- Large enterprises with big amount of data
What are Qlik Sense Features?
- Automated insight generation
- AI assisted creation and data preparation
- Self-service visualizations
- Interactive dashboards
- Advanced and predictive analytics
- Reporting
- High performance cloud platform
- Mobility
- Custom & embed functions
- AI powered data insights and analytics.
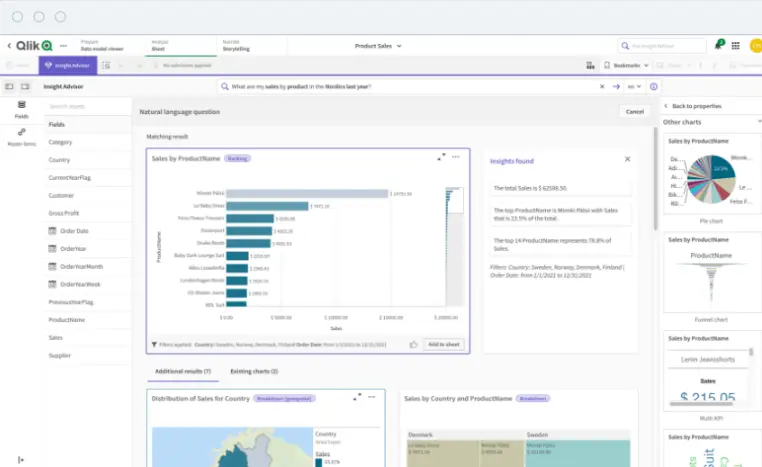
Qlik sense screenshot from https://www.qlik.com/us/products/qlik-sense
What are Qlik Sense limitations & cons?
- Data extraction is limited
- Doesn’t provide live data streaming
- Platform setup requires advanced knowledge and experts
- Steep learning curve, it’s not user-friendly and intuitive, requires training to use this platform
- Limited visualizations and customization options
- Mobile app can get speed issues and is hard to navigate
- Complicated & expensive pricing
- You can face speed issues when working with big amounts of data.
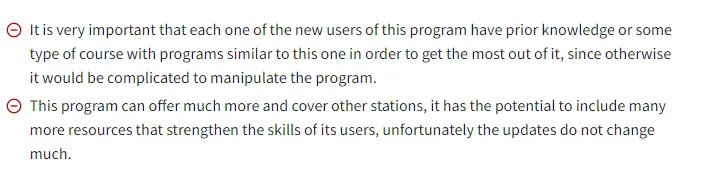
Qlik sense review screenshot from https://www.trustradius.com/products/qlik-sense/reviews?qs=pros-and-cons#reviews
What’s The Pricing?
Qlik Sense offer 3 pricing plans:
- Standard package is priced at $20 per user per month, billed annually. However, it’s important to note that you need to acquire complete user licenses to enable the creation of reports, incurring additional costs.
- Opting for the Premium plan grants you increased data capacity, access to various data sources, and an unlimited number of users, all for a monthly fee of $2,700.
- For those seeking a more personalized solution, the Enterprise plan offers a customized package designed to meet your specific requirements, ensuring enhanced performance and scalability.
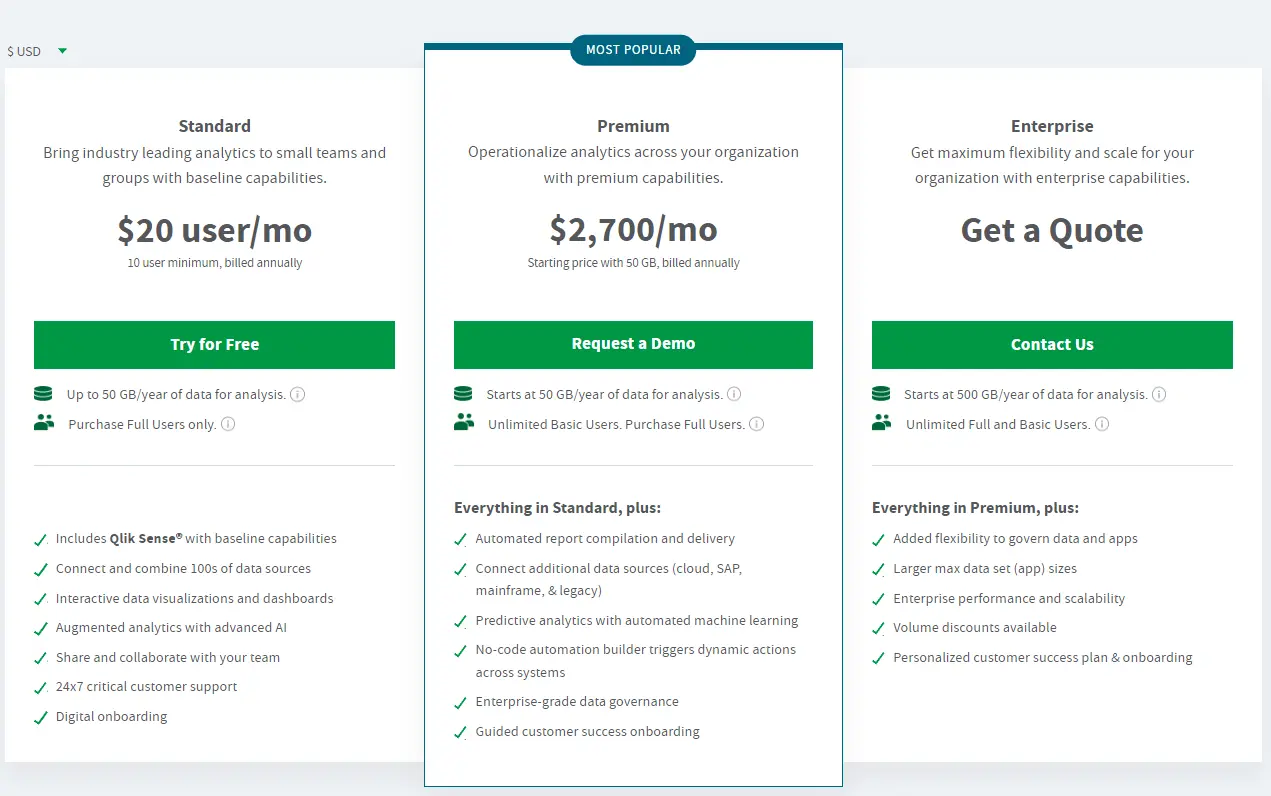
Qlik pricing plan screenshot from https://www.qlik.com/us/pricing
You can also get a 30-day free trial to try out the tool.
Related Article: 7 Best Self-Service Business Intelligence (BI) Tools
5. Power BI
Power BI stands out as a top-tier tool for data visualization and analytics, playing a pivotal role in fostering a data-driven culture within organizations. This platfrom proves to be a robust tool catering to experts, developers, and seasoned data analysts. In the following section, we will outline the drawbacks and limitations of this tool.
Who are the Power BI users?
The potential offered by this platform is virtually limitless, but not everyone may find it equally beneficial. Here’s our list of those who stand to gain the most from utilizing this platform:
- Large enterprise companies handling substantial volumes of data.
- Companies with numerous data sources seeking assistance in consolidating data in a unified platform.
- Proficient professionals, particularly data analysts with expertise in DAX formulas.
- Workspaces already immersed in the Microsoft environment.
What are the Features?
- Diverse data connections
- Utilization of DAX formulas
- Data transformations facilitated by queries (Power Query editor)
- Seamless integration into Microsoft’s ecosystem
- Scheduled Data Refresh feature
- Custom visualization creation, tailored for developers
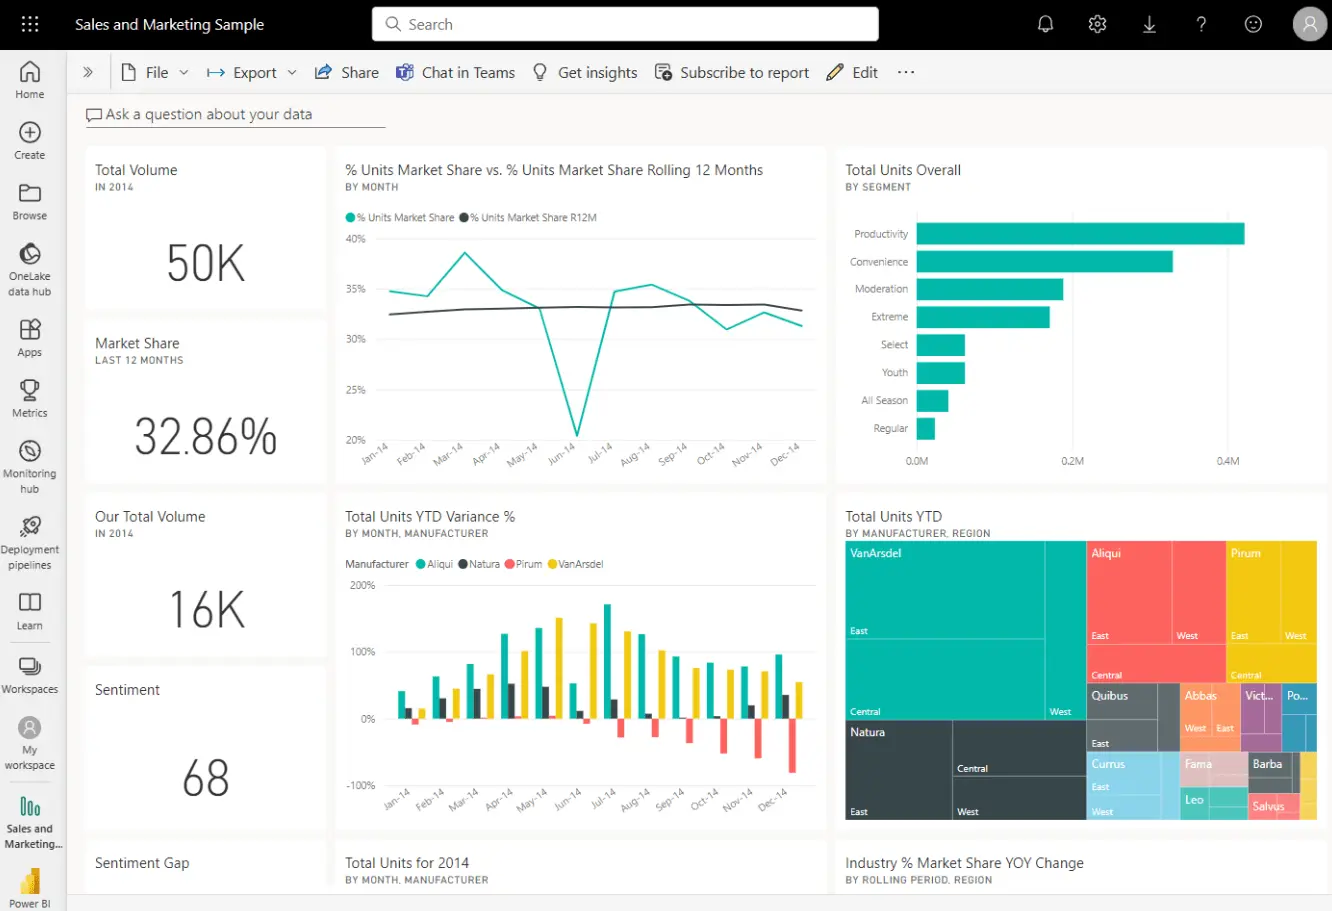
Power BI dashboard screenshot from https://learn.microsoft.com/en-us/power-bi/create-reports/service-dashboards-design-tips
What are Power BI limitations & cons?
- Advanced knowledge in writing DAX functions is essential for a complex setup.
- The creation of reports for your business requires skilled data analysts.
- Achieving responsiveness for mobile applications can be challenging, you may end up creating a separate report for mobile device.
- Steep learning curve, with numerous features that may overwhelm users during report creation.
- Password protection for reports is unavailable; once published online, access is open to anyone.
- Opening the report on a new computer involves installing the file, making accessibility less straightforward.
- Lack of support
- Problem resolution may be time-consuming
- Cross-platform editing is not supported, restricting the ability to edit reports from mobile devices or tablets.
- The platform’s dependency on the Microsoft ecosystem
- Real-time data refresh is not instantaneous; changes to the report may take some time to appear in the system.
What’s the Pricing?
This software offers three fixed-price plans, but for a customized offer, you can contact the sales team.
- Free Plan: Designed for individuals creating reports for personal use, this plan restricts the sharing and collaboration of reports with others.
- Power BI Pro per user: Tailored for individual users seeking collaborative report capabilities, this plan offers advanced analytics features not available in the free plan, with a monthly cost of $10 per user.
- Power BI Premium per User: Encompassing advanced features such as AI analytics, insights, a faster refresh rate, and 23 other capabilities, this plan is priced at $20 per user per month.
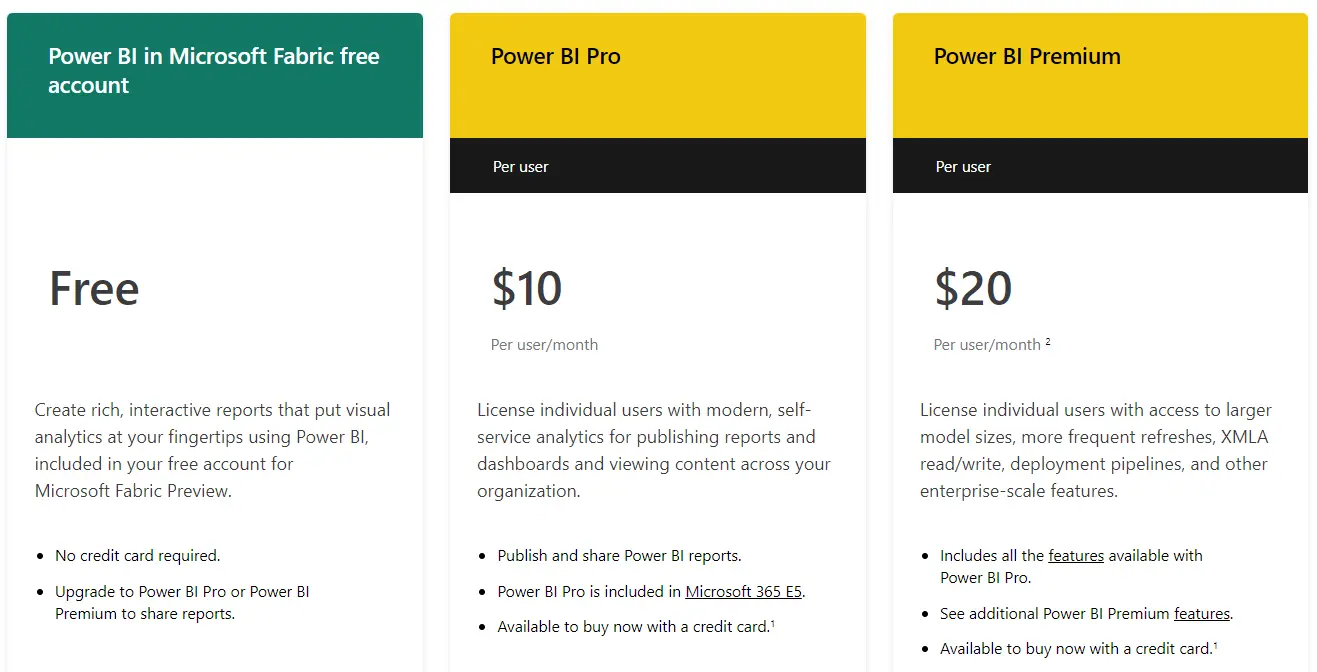
Pricing screenshot from https://www.microsoft.com/en-us/power-platform/products/power-bi/
Summary
Hopefully, this article helped you discover other Domo alternatives that can help manage your business analytics across you company. Before choosing your software make sure to test at least couple of alternatives so you have an understanding of the options and market. You can start by trying out Ajelix.
Ready to start creating reports with Ajelix?
From data to report in one minute or less with Ajelix AI Agents


