5 Best Free Data Visualization Tools 2026 (Comparison)
Visualization is an integral part of any data. Otherwise, how else can you make a decision or understand the correlation between data cells? Visualization makes everything easier, and we all love pretty charts that give us an idea of the current situation.
With so many data visualization tools out in the market, it can be challenging to find the right tool at the best price. This top will review the best 5 free and budget-friendly data visualization tools for your business needs.
Change the way you work with agentic AI
One-click dashboards,KPI tracking, and AI-powered insights—for work that actually gets done.

5 Budget-friendly & Free Data Visualization Tools 2026
Here’s our pick:
Let’s review the functionality and costs for each tool in the chapters.
1. Ajelix
Ajelix is a cool option for any small to medium business owner, entrepreneur, and basically anyone who need some visualization. This platform comes with user-friendly editing, easy set-up and maintenance.
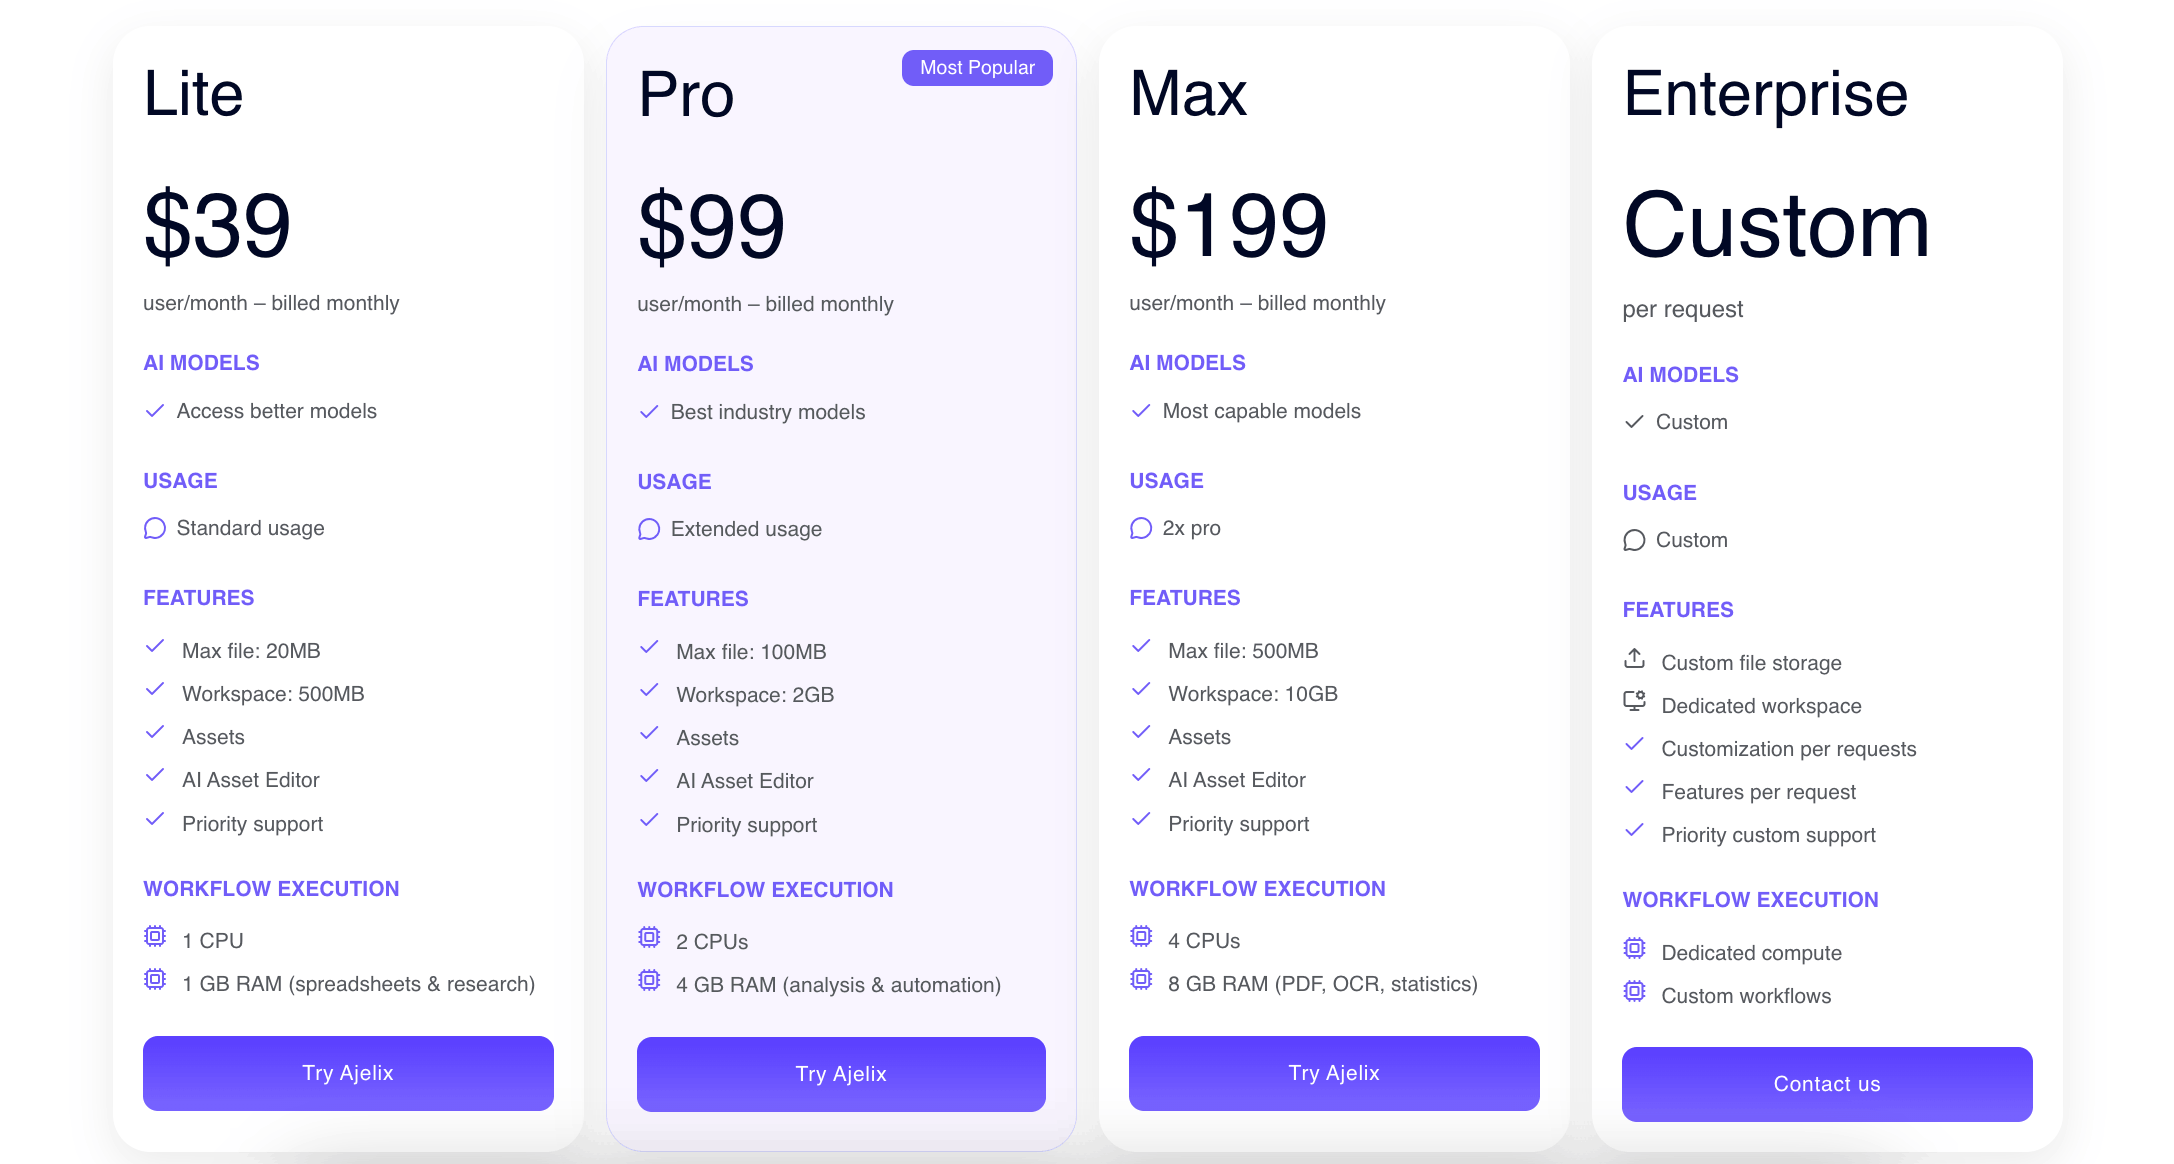
The best part, you don’t need to be an IT specialist or analytics expert to set up and use the report. They offer a free trial and come with a $39 per month upgrade.
Ajelix Features (Free & Paid Plan)
- Easy AI agent – describe what you need, get working assets instantly.
- No training required. Sign up and start creating immediately.
- Conversational AI for instant insights and visualizations.
- Import from Google Sheets, Excel, PDFs, CSVs, presentations and documents.
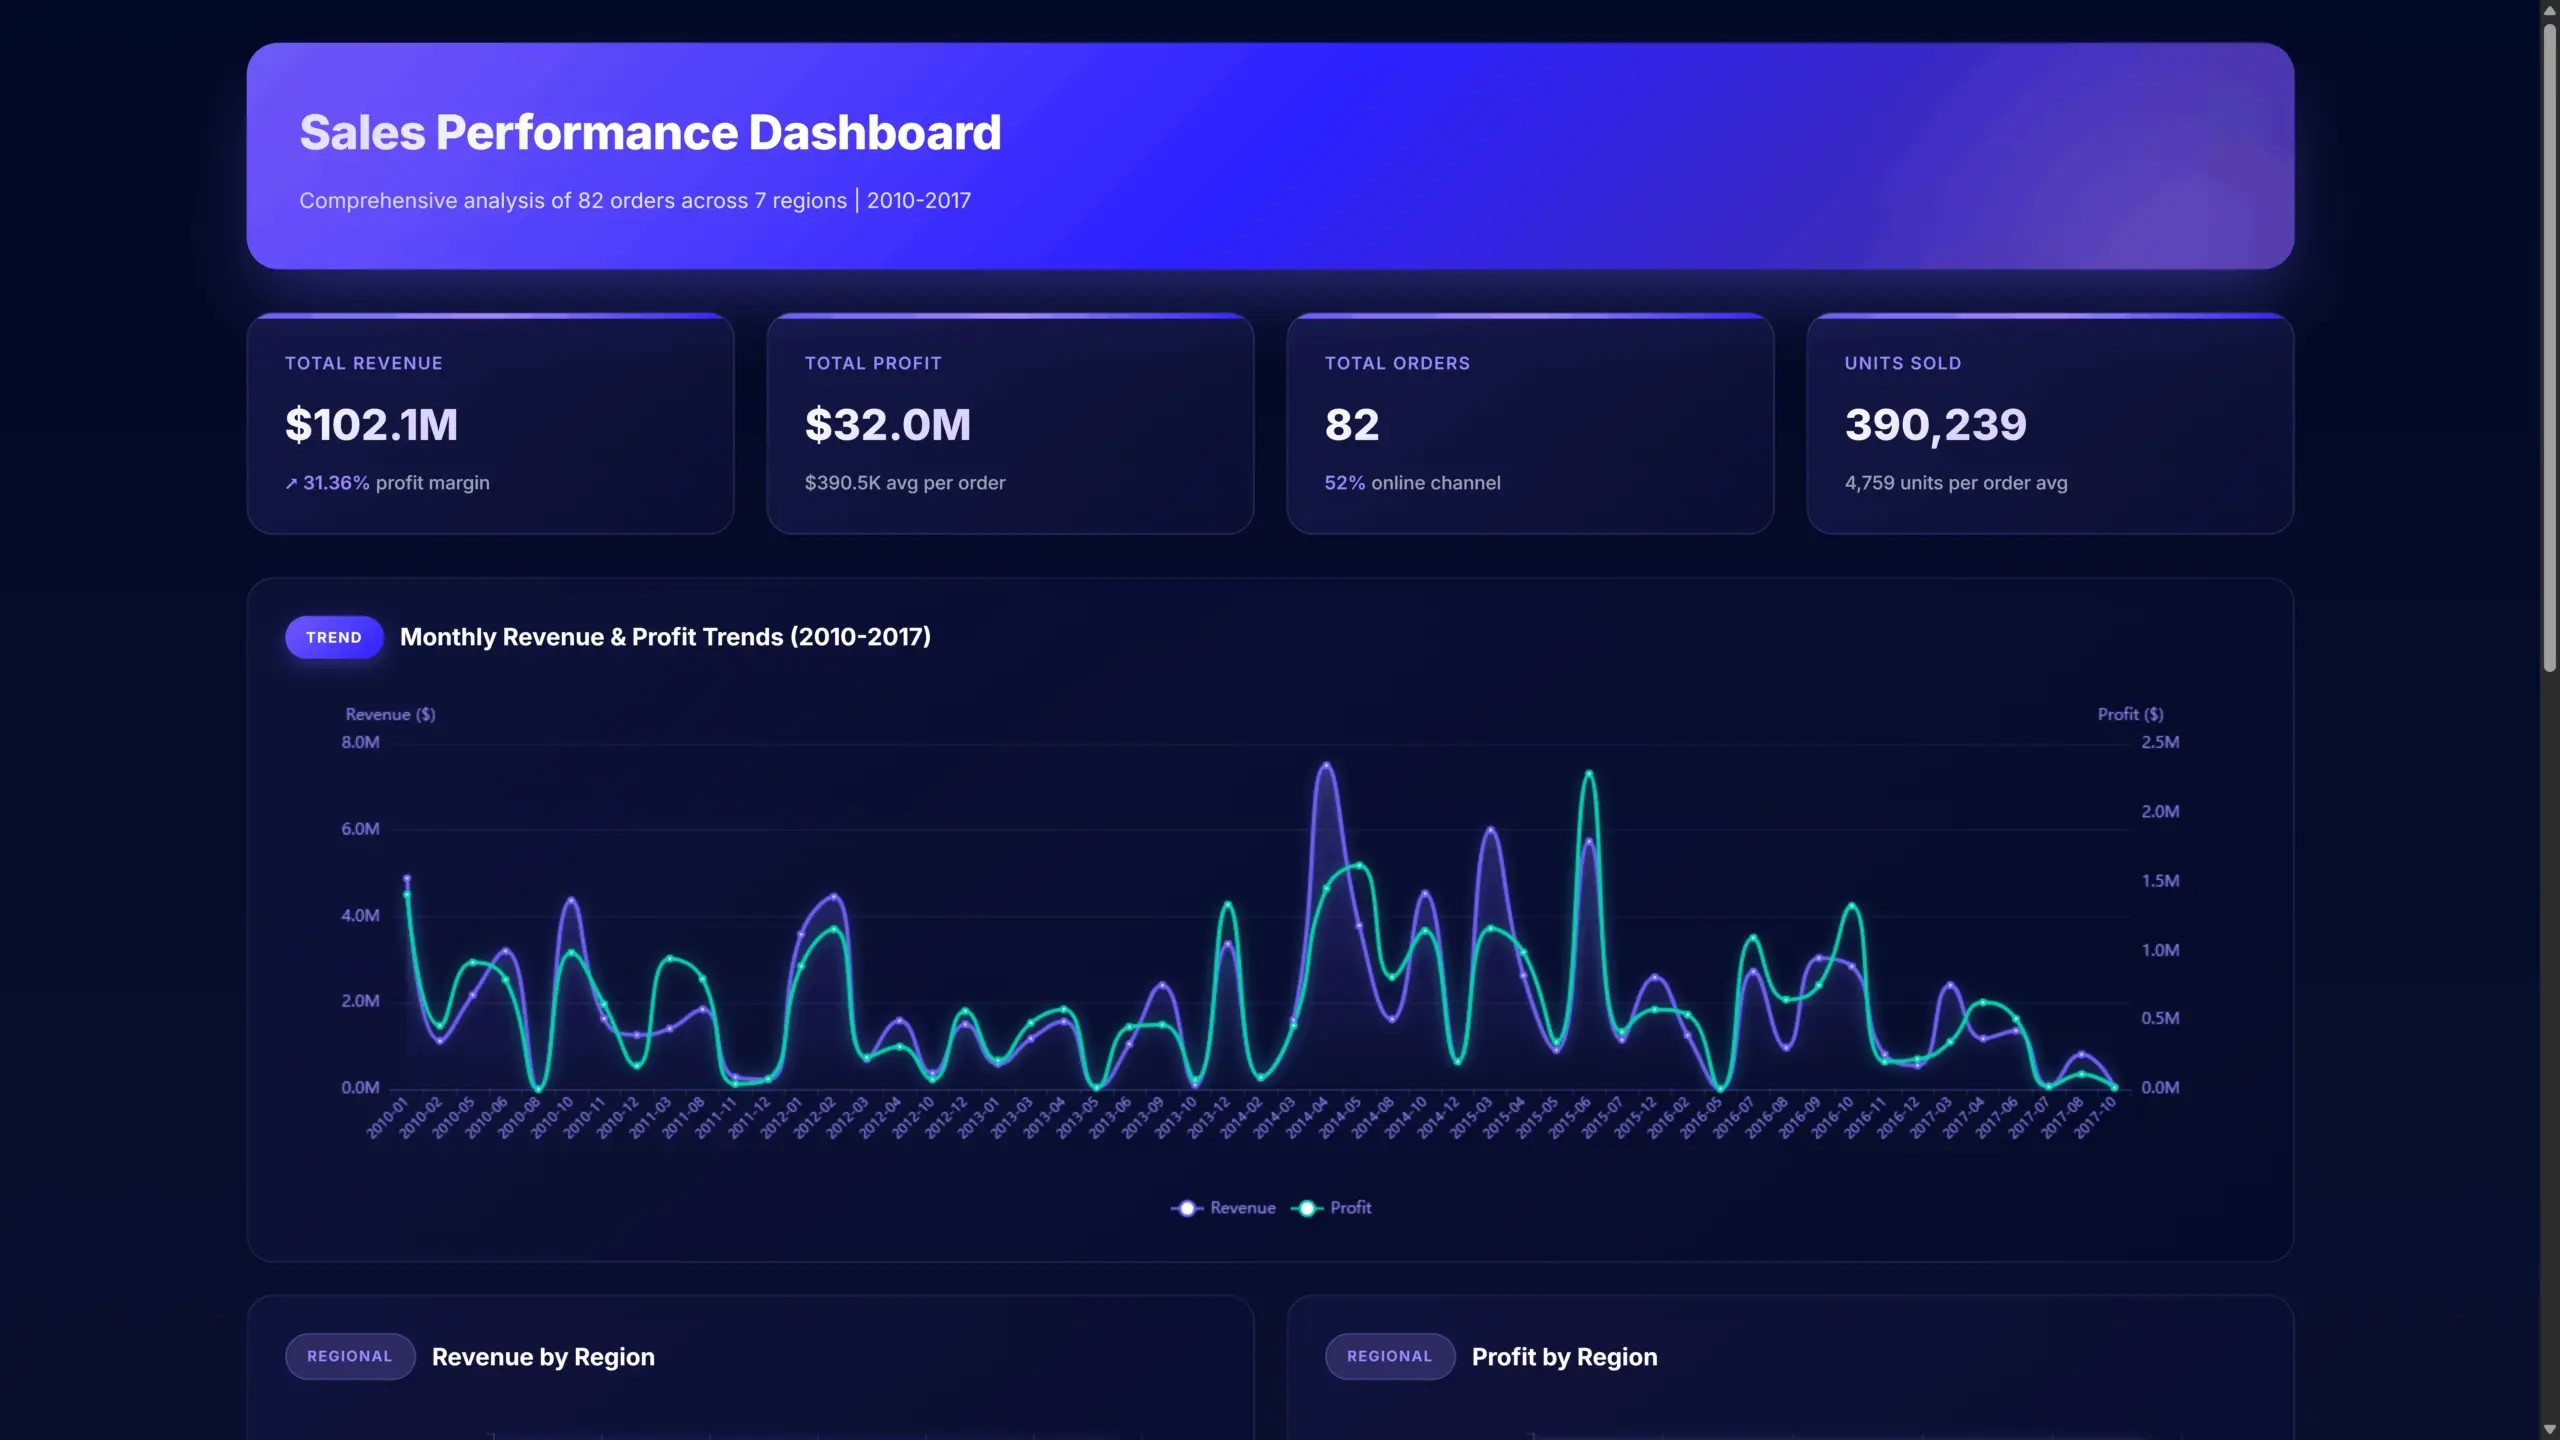
- AI dashboards in seconds. Upload up to 1GB, no manual formatting.
- Auto-clean data and calculate KPIs from any file.
- Share dashboards and apps with one-click links.
- Persistent workspace remembers your files across chats.
- AI explains trends and delivers actionable recommendations.
- Create dashboards, Excel files, presentations, and web apps in one click.
| Feature | Freemium | Lite($20 per user/month) |
|---|---|---|
| AI Spreadsheet tools | Unlimited | |
| Unlimited data sources | ||
| Excel as data source | ||
| Report Saving | ||
| Report Sharing | ||
| Automatic Data Refreshing | ||
| Google Sheets Data Source | ||
| AI analytics |
Ajelix pricing plan starts at $39 per month and offers full data visualization usability.
Now let’s take a look at the rest of the 4 tools that are great alternatives for Ajelix.
Reporting gives you a headache?
Upload your data and create professional reports with agentic AI

Start free
Try free and upgrade whenever
2. Zoho
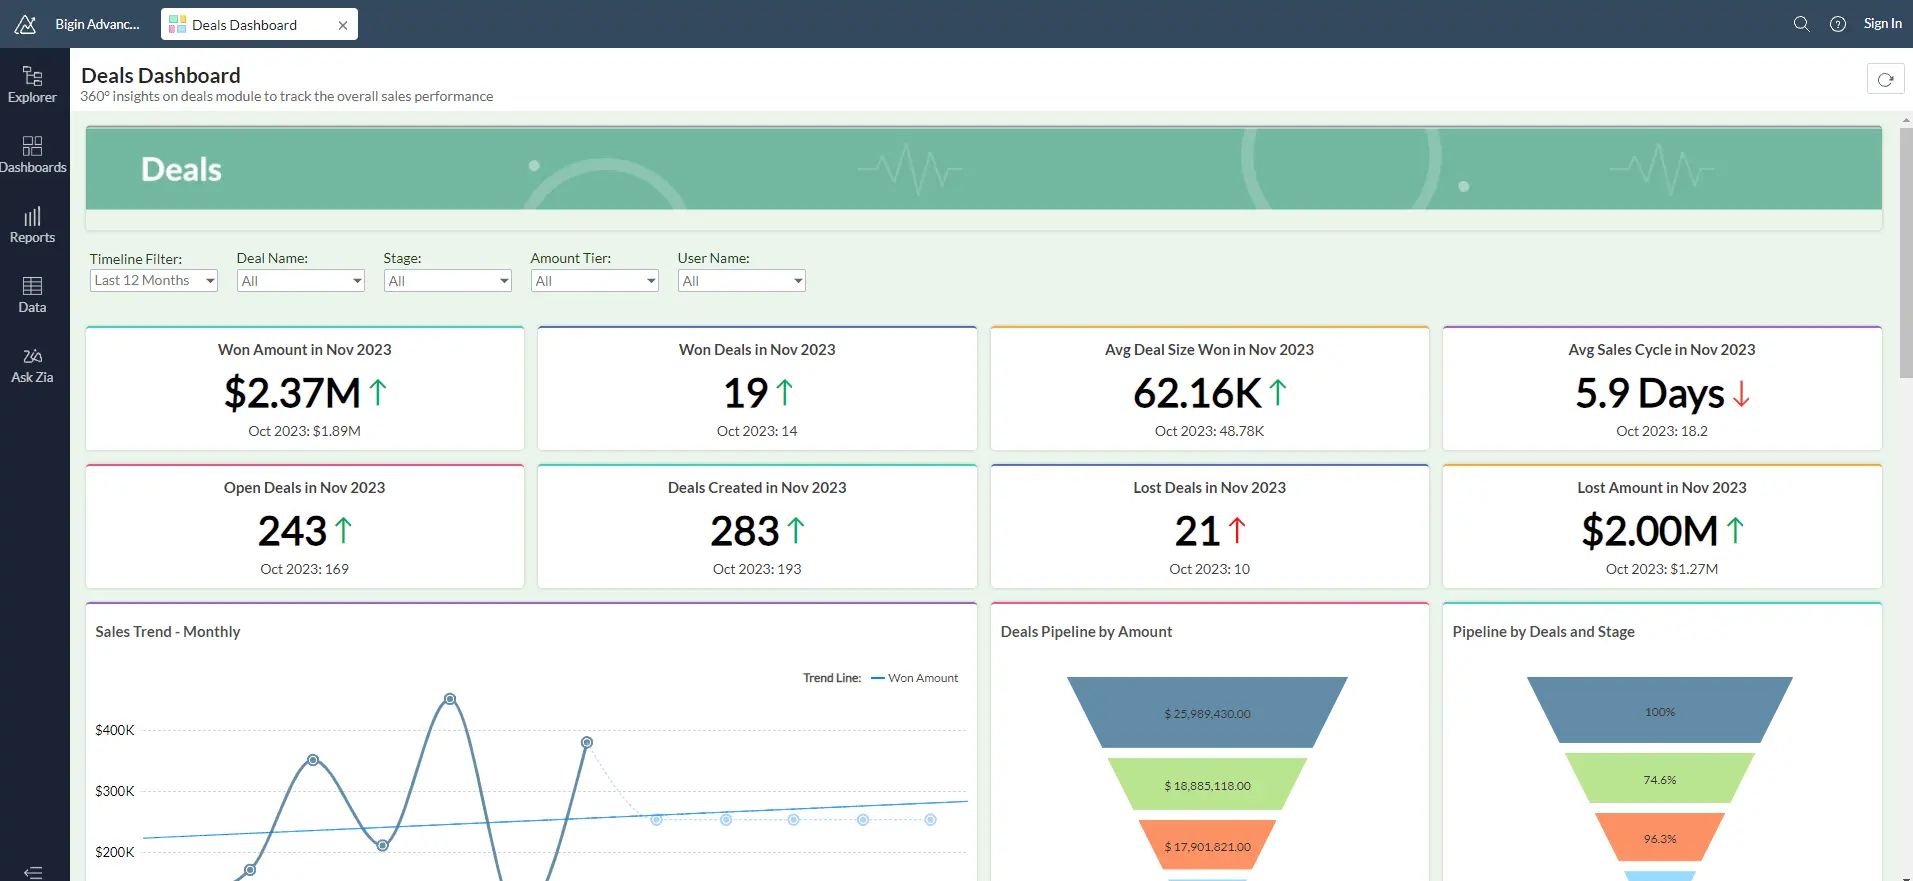
Zoho also offers a great freemium plan and a flexible pricing plan for small businesses. This platform is very advanced and is suited for individual users as well as enterprises.
One of the limitations you may face when first starting out is ease of usability. Many users mention that it’s hard to start—there’s a steep learning curve and lack of helpful guides.
Using this platform to full capacity may request some IT knowledge and coding knowledge. However, if you need to complete simple tasks, you shouldn’t face any problems.
Zoho Features (Paid & Free)
- Variety of data sources
- Data cleansing and preparation before report creation
- User-friendly editing with drag and drop editing
- Explore data with AI and reveal insights.
- Perform conversational analytics, predictive analytics and what-if analysis.
- Collaborate and share report with others.
- Insert dashboards in your applications with no code embedding solution.
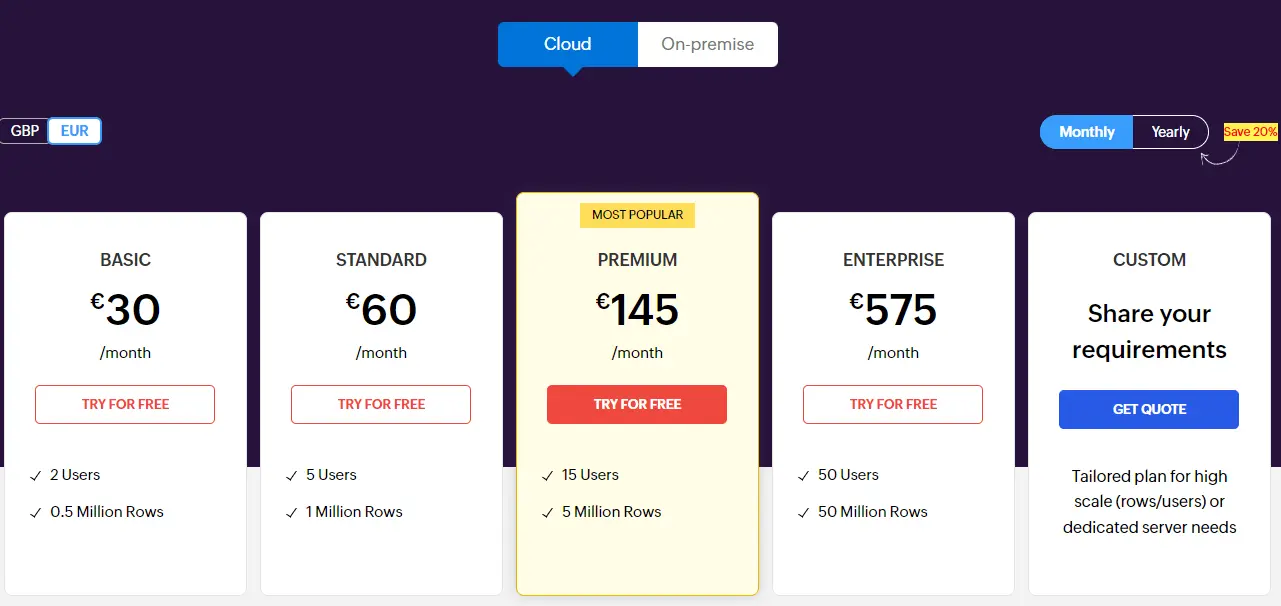
| Feature | Freemium | Basic (€ 30 per user/month) |
|---|---|---|
| Users | 1 | 2 |
| Data Space | Up to 10 tables, 10K rows, 5 workspaces | 0.5 million rows |
| AI chat | ||
| Viewers | ||
| Daily data refresh | ||
| Support | ||
| Data connections | ||
| Unlimited reports & dashboards | ||
| Live Connect & Data bleding |
Please note that Zoho analytics offers several other plans that you can explore further on their homepage. Comparison was created with Free plan and Basic plan that costs 30$ per month a user.
Related Article: 5 Tableau Alternatives To Explore Data With AI
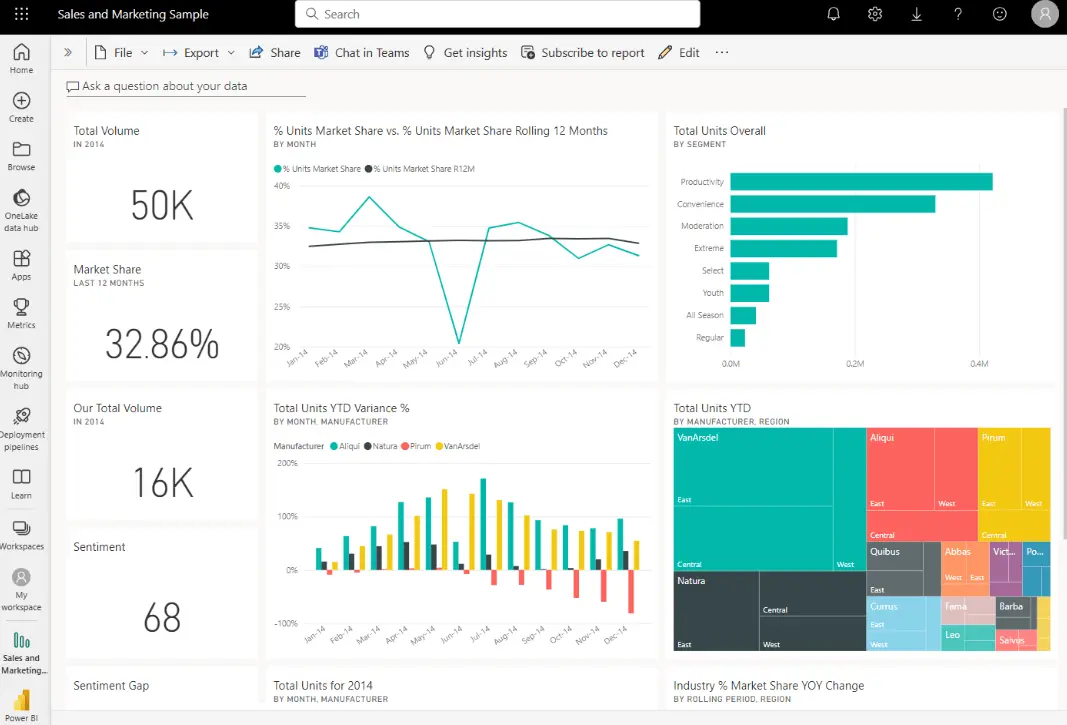
3. Power BI
Most likely, you have heard about Power BI as it’s one of the most popular BI tools in the market. This tool is advanced and requires some knowledge. It may take some time to learn how to use it accordingly.
The reason we included this tool on our list because it offers an extensive freemium plan. Also, the pricing plan is very budget-friendly if we compare it to other BI tools.
Some of the limitations of using this tool includes steep learning curve, DAX function knowledge, doesn’t offer a web interface, and dependency on the MS environment. Read more about Power BI and alternatives in our article.
Power BI Features (Free & Paid)
- A variety of data connections
- DAX formulas
- Data transformations through queries (Power Query editor)
- Integration into Microsoft’s ecosystem
- Scheduled Data Refresh
- Creating custom visualizations (for developers)
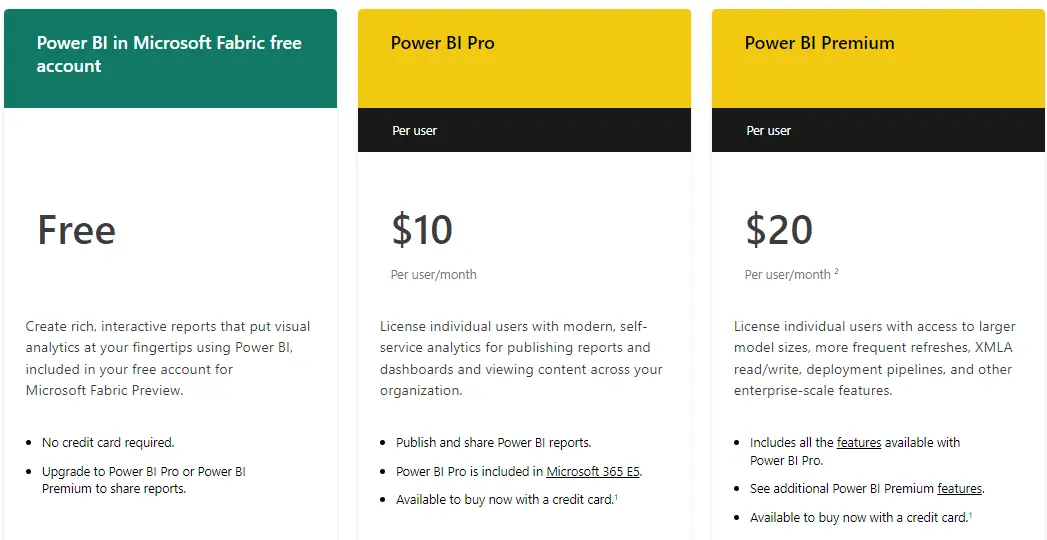
| Feature | Freemium | Power BI Pro ($10 per user/month) |
|---|---|---|
| Report creation | ||
| Report publishing | ||
| Advanced AI, dataflows, etc. | ||
| Model memory size | 1GB | |
| Data refresh | 8/day | |
| Max storage | 10GB/user |
This comparison was created based on the Power BI pricing plan that is available on their homepage. Please note that the comparison was made with the cheapest plan Power BI Pro that starts from 10$ a user per month.
Related Article: Top 5 Looker Alternatives For Non-Tech Teams
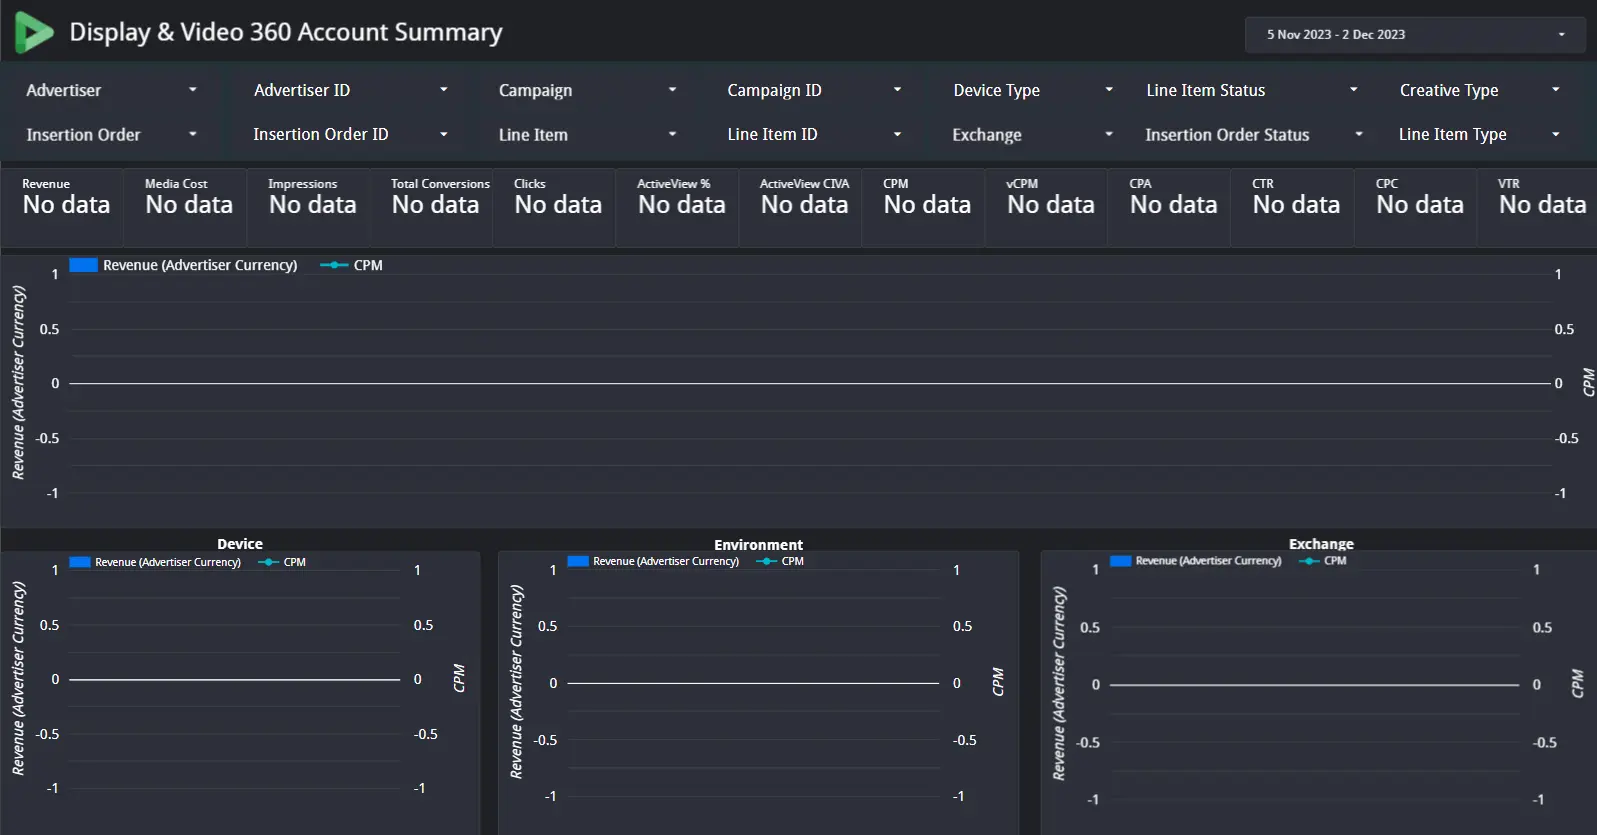
4. Looker Studio
Another big platform that offers advanced analytics and data visualization possibilities. Just like any big platform, they offer an extensive list of features that require additional training.
To set up this platform accordingly, you might need some SQL or IT knowledge. However, if you decide to use already implemented connections, such as Google Analytics, it will be pretty easy.
Some limitations that Looker Studio has: customer support is lacking, guides are complex, and again, you’ll experience a steep learning curve. You can’t brand your dashboard, and data blending is complex.
Looker Studio Features (Paid & Free)
- Easy-to-use web interface that facilitates reporting
- There are many premade templates that are for free, as well as a template marketplace.
- Around 600 data sources and integrations
- Relatively easy setup and report creation
- Report embedding
- API’s
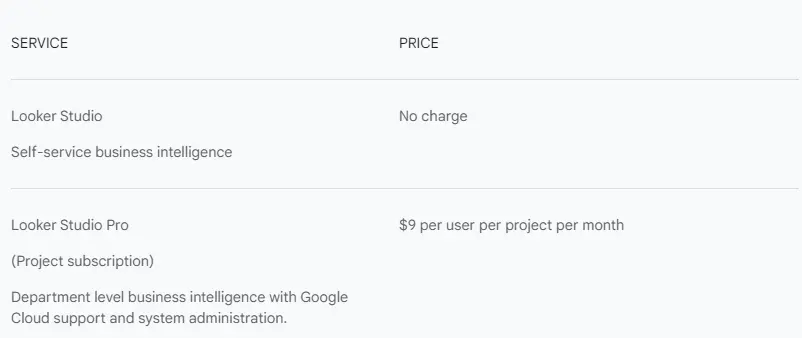
| Feature | Freemium | Looker Studio Pro ($9 per user/month) |
|---|---|---|
| Report creation | ||
| Data connections | ||
| Report sharing | ||
| Automated report delivery | ||
| Report sharing via links | ||
| Access to support | ||
| Unlimited dashboards |
Looker studio plan starts at 9$ per user per each project. One project equals one dashboard. View the pricing below.
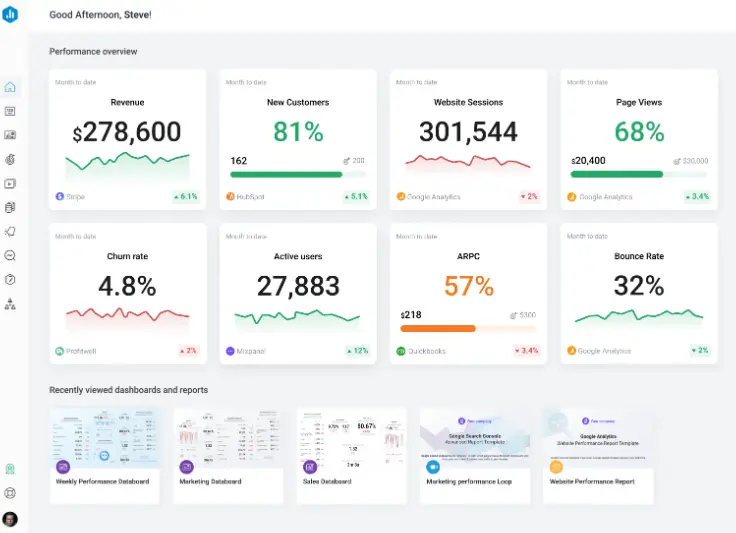
5. Databox
Databox platform offers the same functionality as the rest of the tools. It’s user-friendly, has automated reporting, and the possibility to create data dashboards.
They also offer several integrations and data sources for your reports. Some customers complain that it can get buggy as the solution is quite new, missing some integrations and customization options.
However, a great price vs solution value for freemium and paid plans.
Databox Features (Paid & Free)
- Metric and business goal tracking
- More than 100+ data sources
- Collaboration with users, editors
- Several dashboard examples to help create visualizations
- User-friendly data visualization
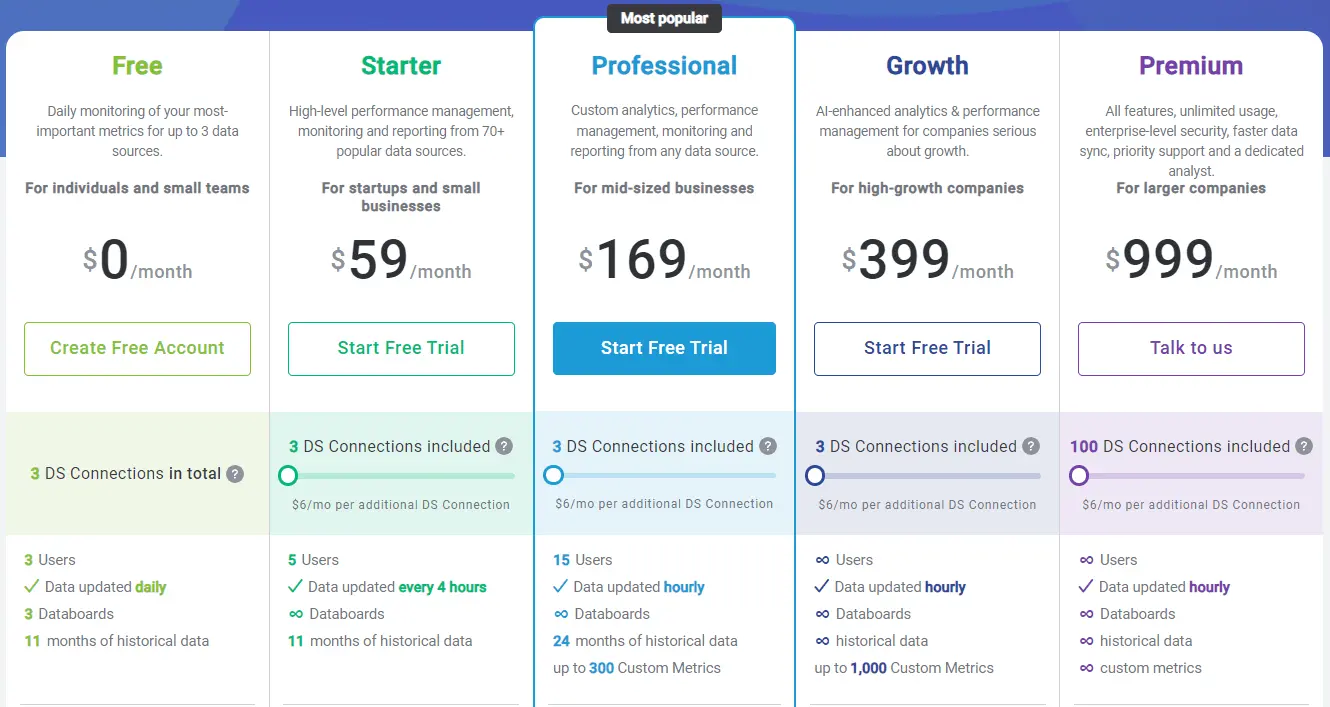
| Feature | Freemium | Starter ($59/month) |
|---|---|---|
| Data connections | 3 | 3 (option to purchase more) |
| Users | 3 | 5 |
| Data refreshing | daily | every 4 hours |
| Databoards | 3 | Unlimited |
| Data storage | 5GB | 20GB |
| Data calculations | ||
| Basic reporting | ||
| 10 free requests |
There are more pricing plans available on Databax official website. This tool is one of the most costly if we compare to all the tools above.
Related Article: 8 Best Business Intelligence (BI) Tools For Small Businesses
Summary
Hope this guide helped you discover new tools or at least compare them to understand which tools fit you the best. Test the tools and choose the best fit for your business needs.
FAQ’s
Ajelix, however, every business needs to compare all the tools available on the market to understand which is the best solution.
There are several tools that offer a freemium plan with Excel as a data source: Ajelix, Zoho, Databox.
Ready to start visualizing?
From data to report in one minute or less with Ajelix AI Agents


