What Is Ad Hoc Reporting & Analysis With Examples
Having standardized reports that drop in your mailbox every week is great. But what about those urgent requests that require in-depth analysis and experts’ viewpoints? That’s where ad hoc reporting can come in handy.
Ad Hoc reporting lets you create reports instantly and are made to answer specific questions. Usually, these reports can be created without any technical knowledge so it’s easier for non-technical teams to get insights fast.
Change the way you work with agentic AI
One-click dashboards,KPI tracking, and AI-powered insights—for work that actually gets done.

What is Ad Hoc Reporting?
Ad hoc reporting is creating reports as needed they usually answer a specific question or inquiry, like “How many sales did we make this week in California” or “Which marketing channel brings in the most customers.”
Instead of relying on pre-defined reports, ad hoc reporting lets you dig into your data for specific questions and insights.
Difference between Static Reports vs. Ad Hoc Reporting
The main distinction between static and ad hoc reporting lies in their approach to information delivery.
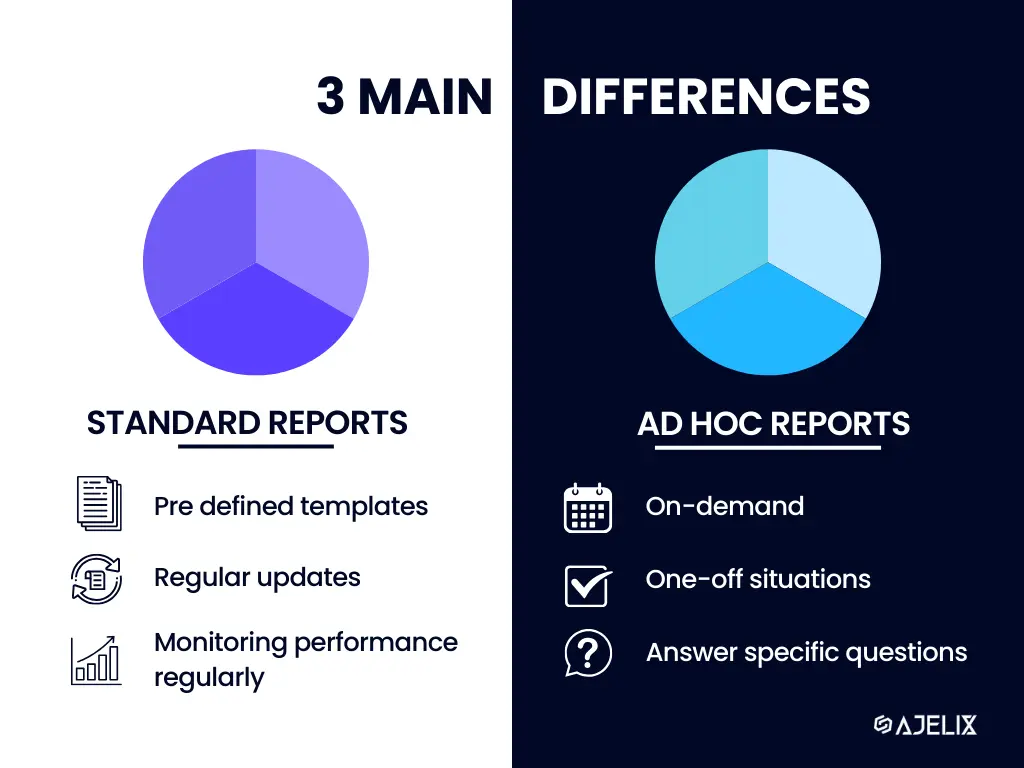
- Static reports are pre-defined templates that deliver specific sets of data regularly. Think of them like automated news feeds that consistently provide the same kind of information. These reports are ideal for tracking key metrics, monitoring performance over time, and ensuring consistency in data presentation.
- Ad hoc reports are created on-demand to address specific questions or analyze unexpected trends. These reports offer flexibility, allowing you to choose the exact data points and format the report in a way that best suits analysis. This is helpful for one-off situations, troubleshooting issues, or exploring new areas of inquiry within the data.
| Feature | Standard Reporting | Ad Hoc Reporting |
|---|---|---|
| Schedule | Recurring (daily, monthly, etc.) | On-demand |
| Purpose | Track key metrics, monitor performance | Answer specific questions, investigate trends |
| Flexibility | Limited – pre-defined format | High – customizable data and layout |
| User | May require IT assistance | Business users can create reports themselves (often) |
What is Ad Hoc Analysis?
Ad hoc analysis is investigating your data to answer a specific question that just popped up. This analysis lets you dive into the data to answer the question now. Imagine you’re looking at your company’s sales data and wonder “Are sales higher in the morning or evening?”. This is how ad hoc reporting works.
Here are some key points about ad hoc analysis:
- Focuses on one-off questions: It’s not about creating regular reports, but rather addressing specific curiosities or problems that arise.
- Fast and flexible: The goal is to get answers quickly, so the analysis is often done with user-friendly tools and self-service BI that easy exploration of the data.
- Data-driven decision-making: By analyzing data on the fly, you can make informed choices from real-time data.
Ad hoc analysis allows employees to be more proactive and adaptable. It empowers users to find insights in the data that might not have been identified through pre-defined reports.
6 Benefits Of Ad Hoc Reporting & Analysis
Ad hoc reporting and analysis offer a range of benefits for businesses and users. Here are 6 key advantages:
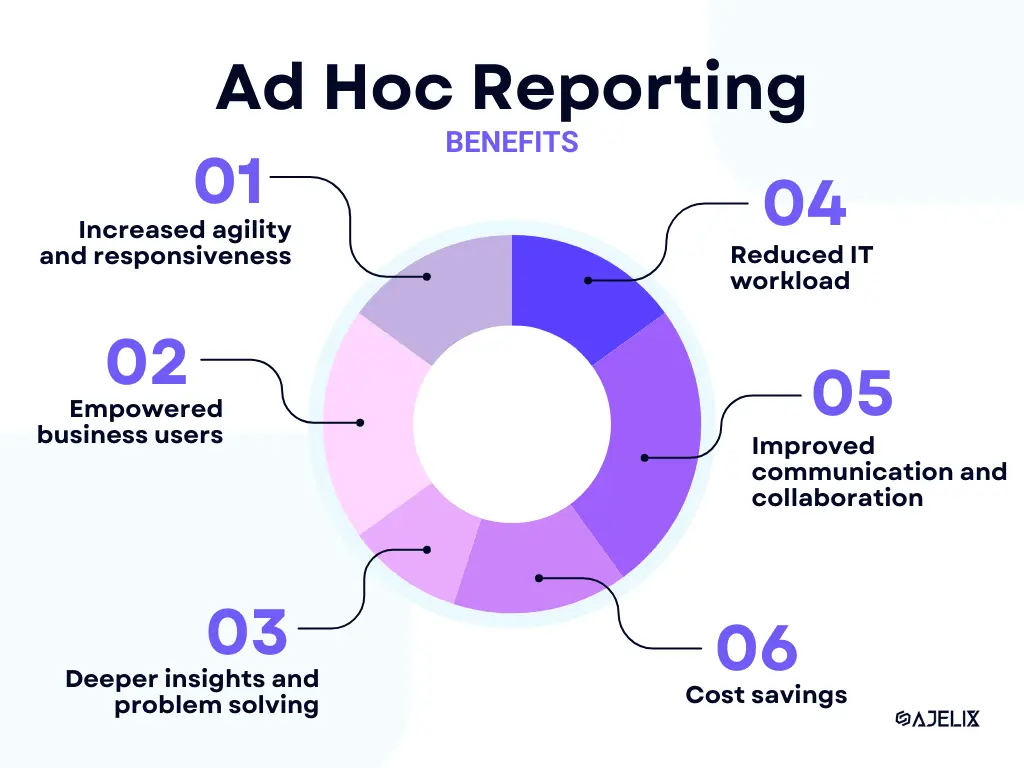
Infographic with 6 benefits for ad hoc reporting and analysis, image by author
1. Increased agility and responsiveness
With ad hoc tools, you can answer pressing questions and address unexpected situations quickly. This can help you make faster decisions and adapt to changing market conditions.
2. Empowered business users
These reporting tools are often user-friendly, allowing employees across departments to explore data and generate reports without relying on IT assistance. This can help you foster a more data-driven culture and empower users to take ownership of their areas.
P.s. Ajelix focuses on user-friendly self-service that can help non-technical teams visualize their data.
3. Deeper insights and problem-solving
By diving deeper into specific data sets, your team can uncover hidden trends and patterns that might not be apparent in pre-defined reports. Leading to improved problem-solving and the identification of new opportunities.
4. Reduced IT workload
Ad hoc reporting tools can free up IT resources by allowing employees from the Marketing department to the Finance departments to generate their own reports. Now IT teams can focus on more complex tasks and data management strategies.
5. Improved communication and collaboration
By sharing ad hoc reports and insights across departments, teams can work together more effectively. Fostering better communication and collaboration throughout the organization.
6. Cost savings
Ad hoc reporting can potentially save money by reducing reliance on external reporting services or custom software development for one-off needs.
Overall, ad hoc reporting and analysis empower businesses to be more agile, data-driven, and responsive to changing conditions. Did you had a chance to check out best BI tools for data analytics?
Different Types Of Ad Hoc Reports With Examples
Ad hoc reports can be grouped based on their function. Each department has its own set of data that require different visualization elements and analysis. Let’s take a look at the different reports with examples from Ajelix.
1. Sales Analysis Reports
These reports delve into sales data to understand customer preferences, product performance, identify top-selling items or underperforming regions. Sales ad hoc reports zoom in on specific areas of your sales data. Analyzing things like:
- Customer trends: Who’s buying what?
- Product performance: What’s selling well (or not)?
- Sales channel effectiveness: Which channels bring in the most sales?
- Campaign impact: Did that promotion work?
- Regional performance: Where’s sales booming (or busting)?
2. Financial Analysis Reports
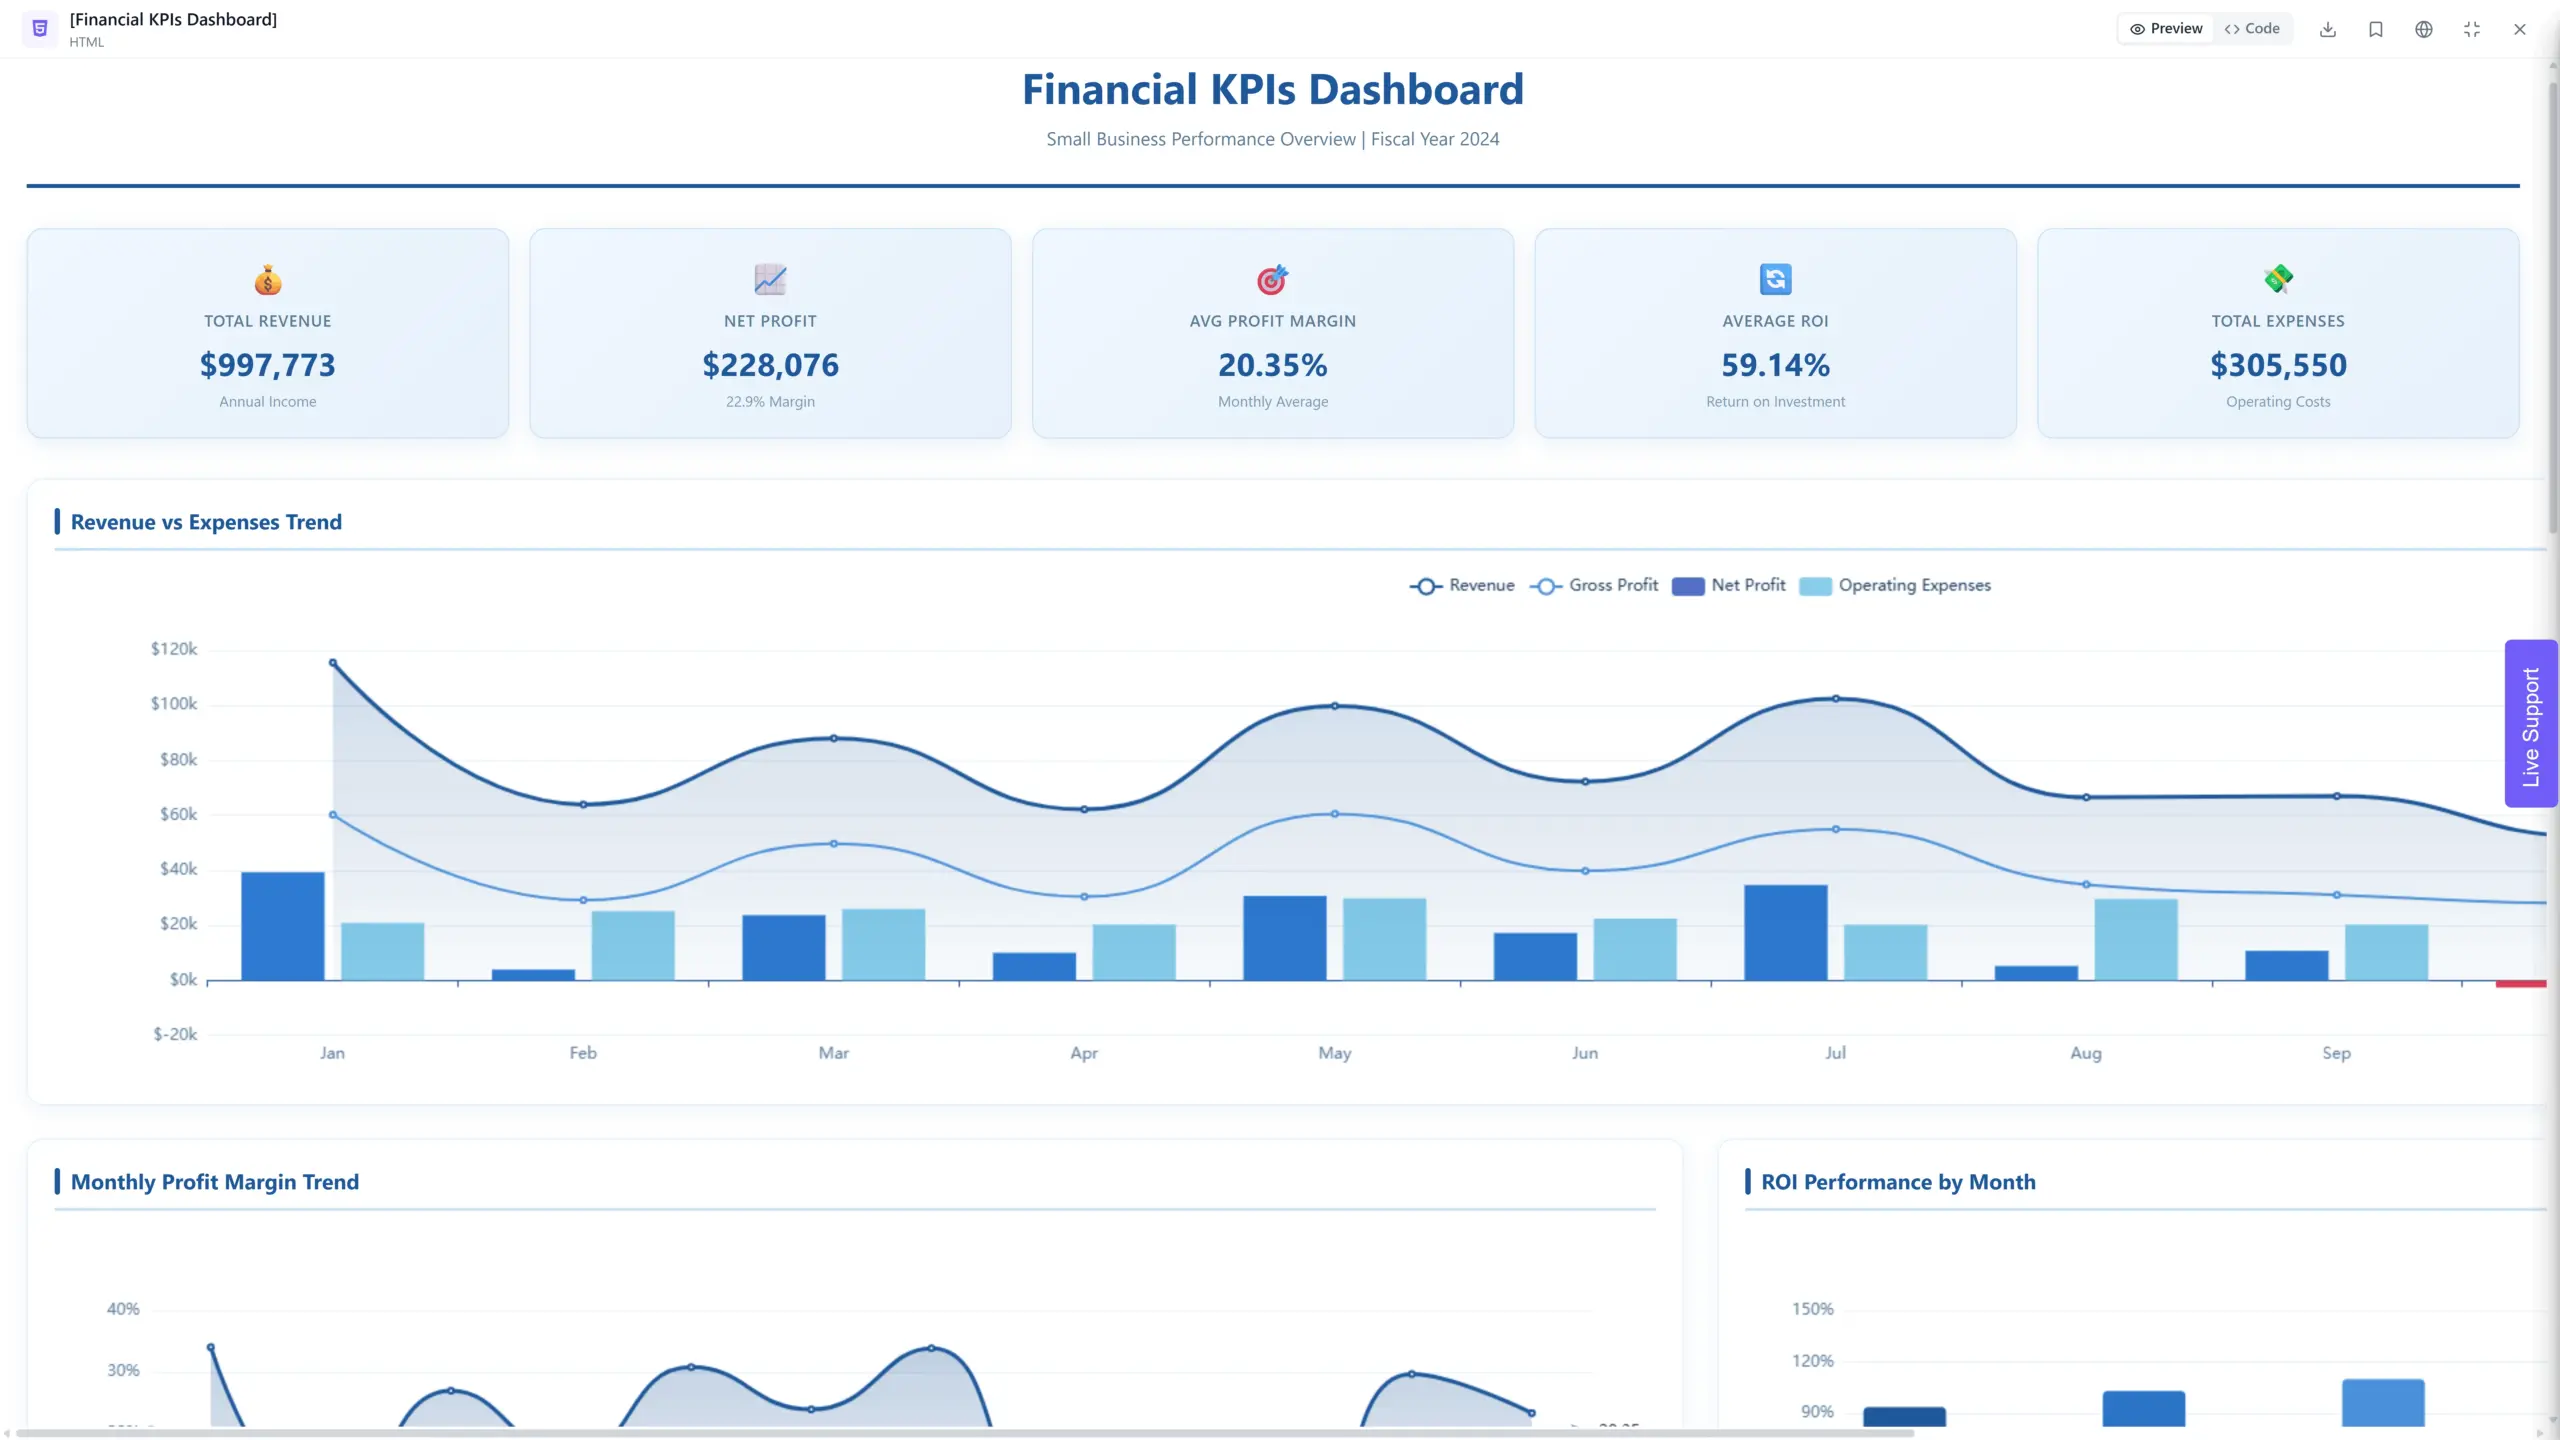
Financial reporting can help you analyze financial data like revenue, expenses, and profitability to track financial health, identify cost-saving opportunities, or assess the impact of marketing campaigns.
- Profitability: Where can you save money or make more?
- Cash Flow: Is there enough cash to cover bills?
- Budget Tracking: Are you sticking to your spending plan?
- Investment Performance: Are your investments paying off?
- Debt Management: How to best handle your company’s debt.
Discover the best practices about financial data visualization.
3. Marketing Performance Reports
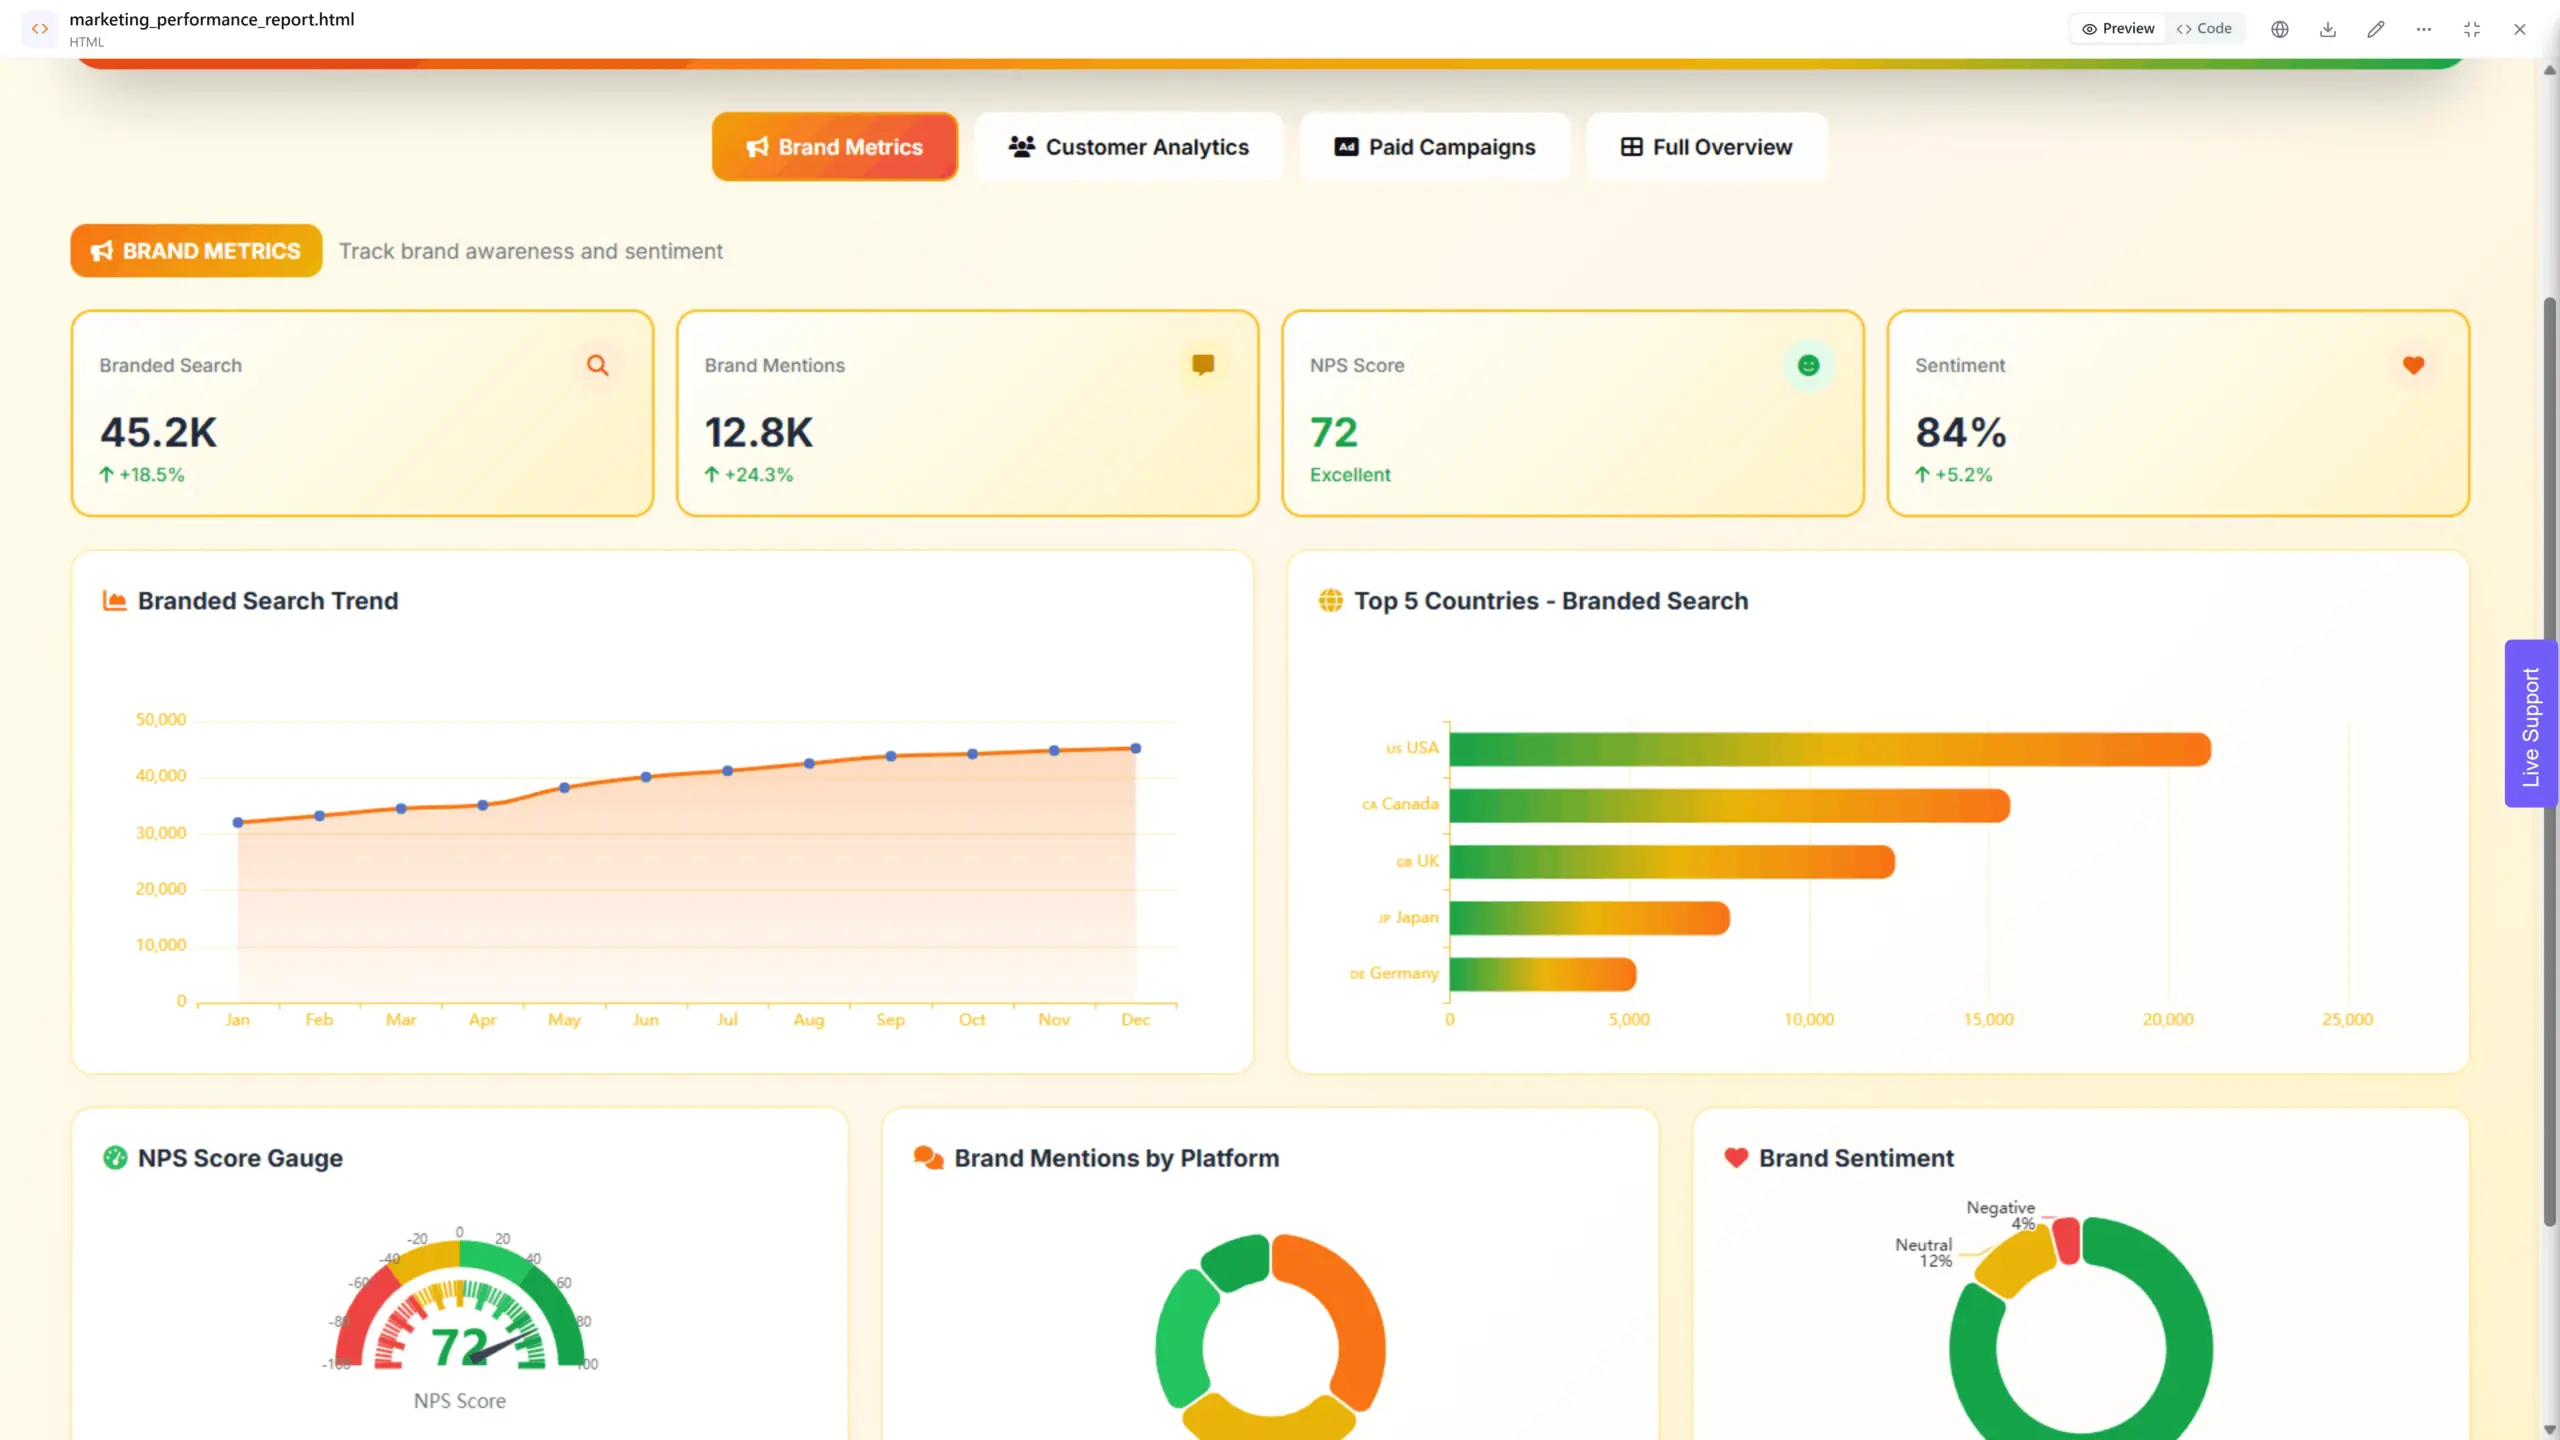
Marketing ad hoc reports can help you track the effectiveness of marketing campaigns across different channels, identify which channels generate the most leads or conversions, and visualize marketing strategies.
- Campaign results: Did that ad campaign bring in new customers?
- Best channels: Which marketing channels are generating the most leads?
- Content performance: What kind of content resonates with your audience?
- Customer costs: How much does it cost to acquire a new customer?
- Engagement: Is your audience interacting with your brand?
- Target audience: Who are you really trying to reach?
Reporting gives you a headache?
Upload your data and create professional reports with agentic AI

Start free
Try free and upgrade whenever
4. Customer Segmentation Reports
Customer segmentation ad hoc reports sort customer data based on demographics, purchase history, or behavior to personalize marketing efforts and target specific customer groups.
- Demographics: Who are they (age, location, income)?
- Buying habits: What do they buy and how often?
- Online behavior: How do they interact with your website?
- Interests: What are they interested in?
5. Operational Efficiency Reports
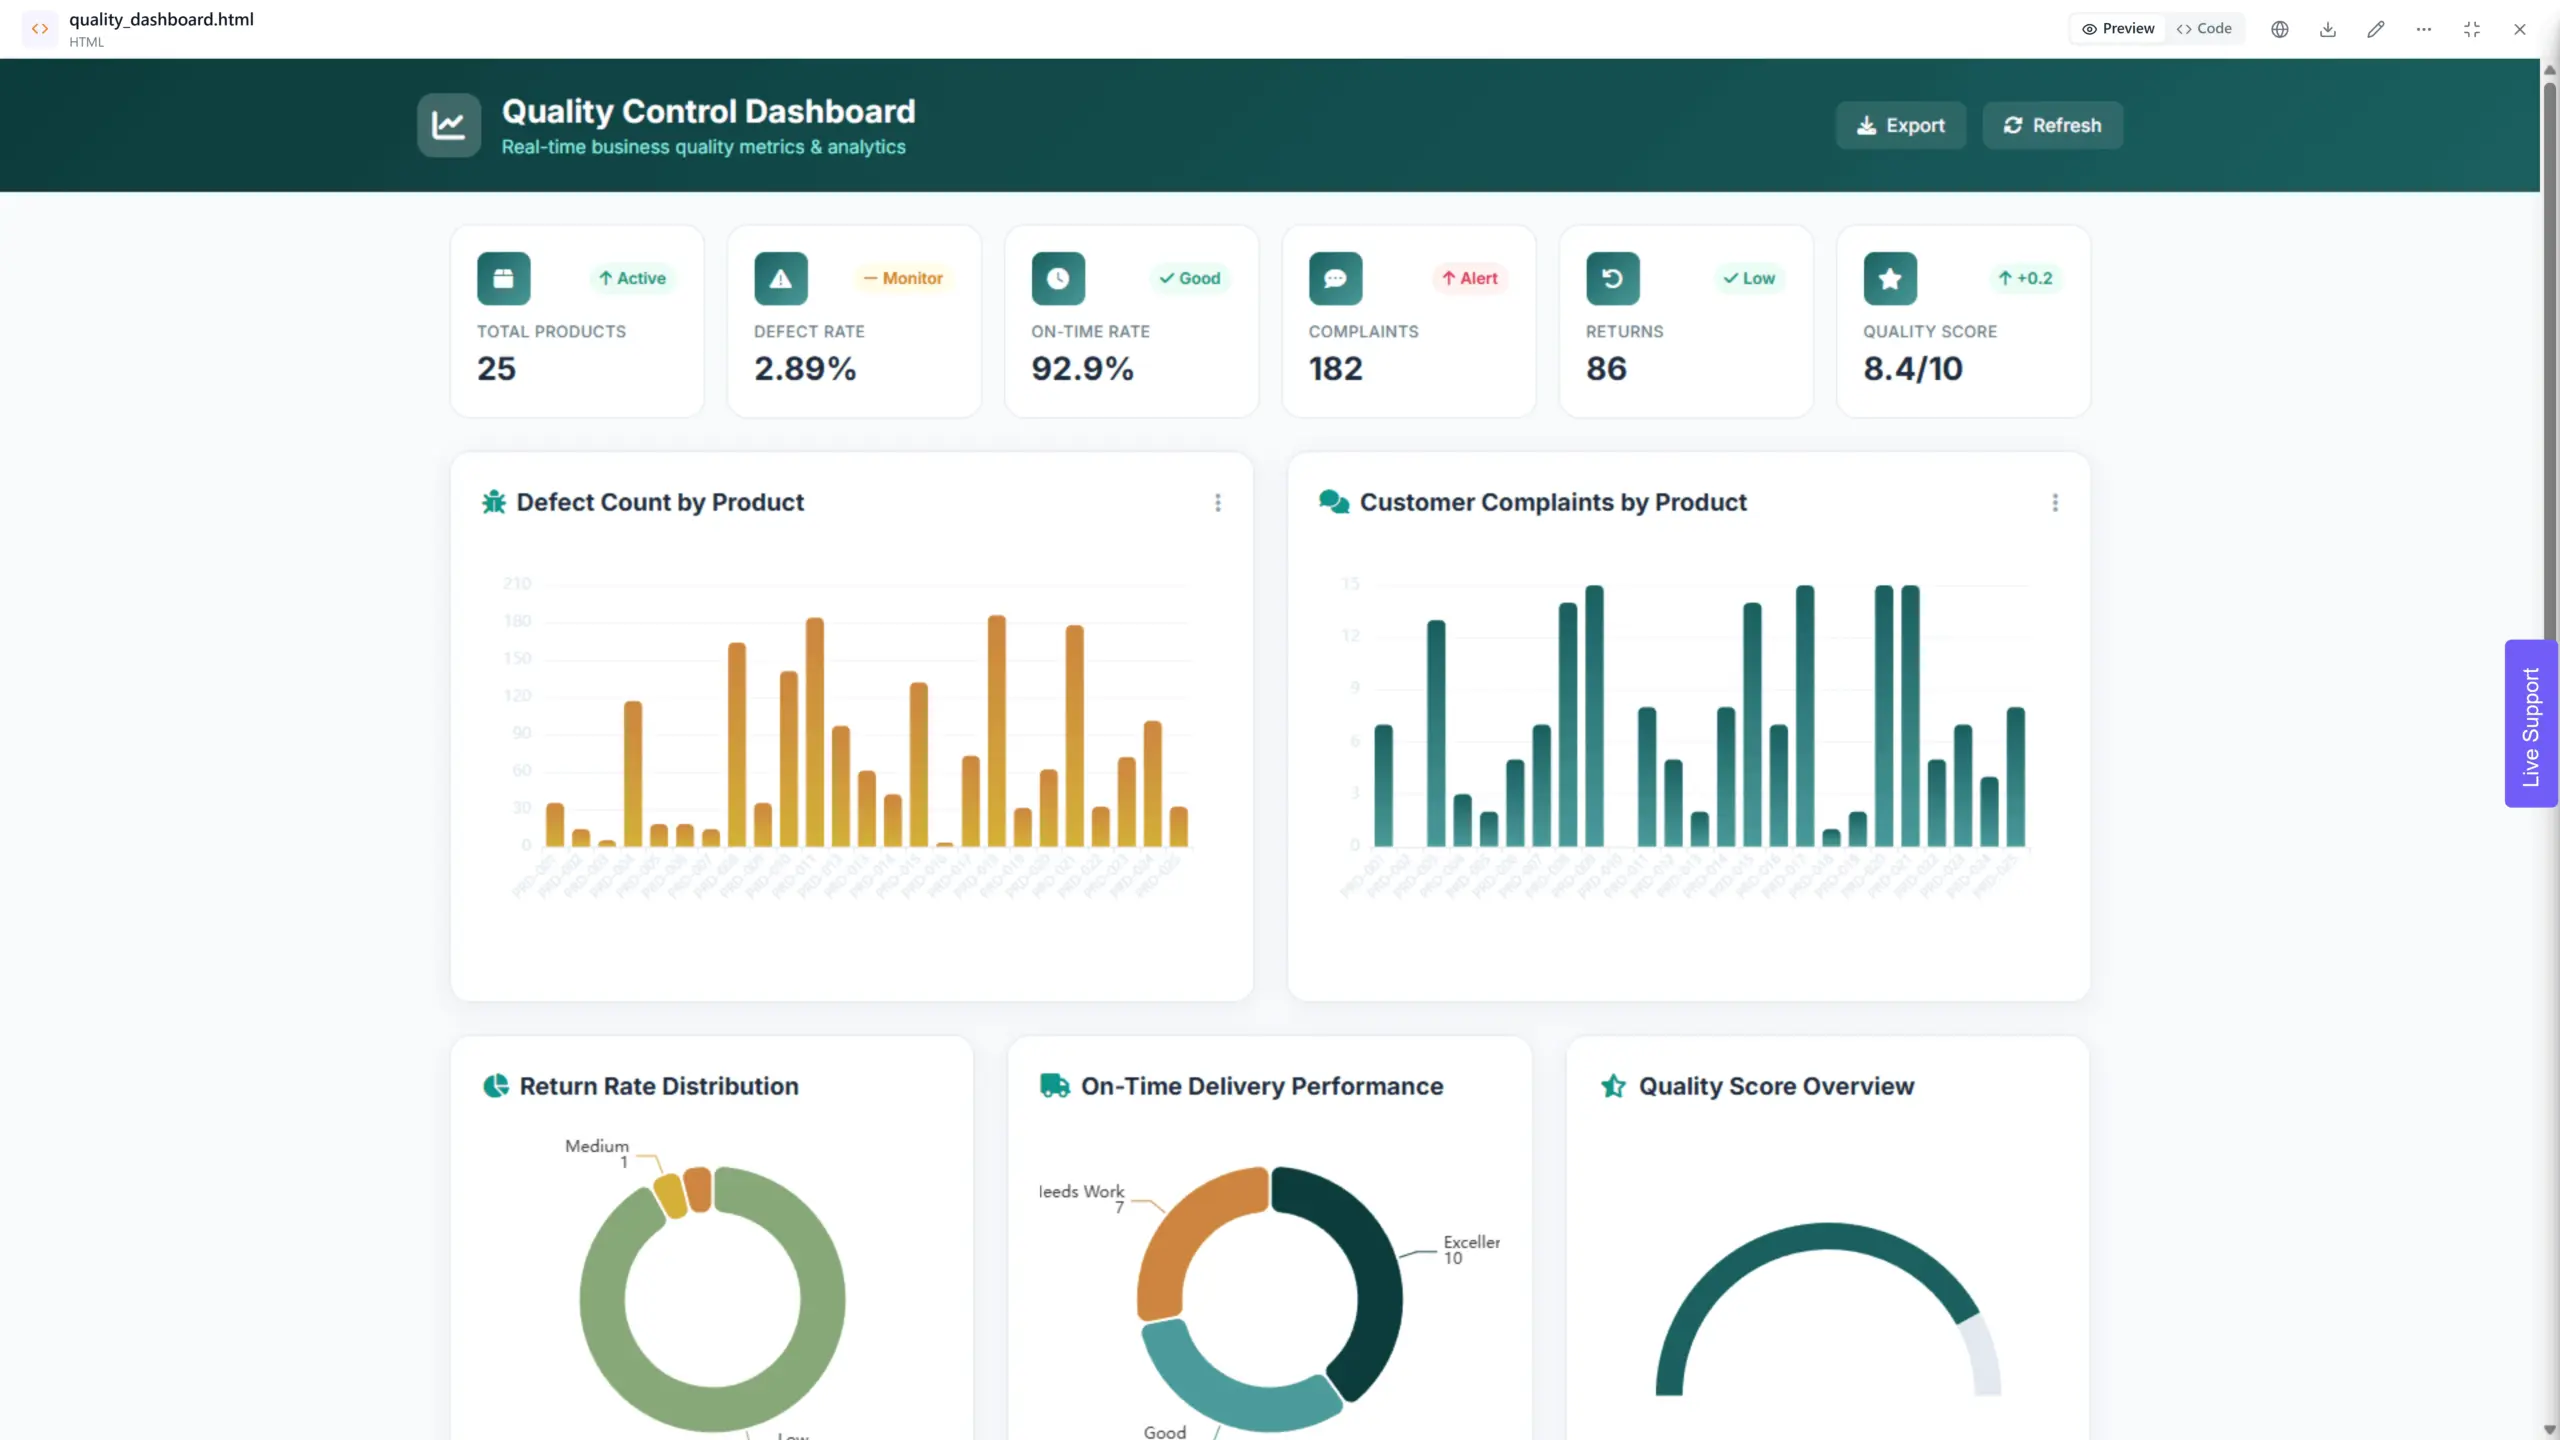
Operational ad hoc reports examine data related to production processes, inventory management, or resource allocation to identify bottlenecks, improve efficiency, and reduce waste.
- Production bottlenecks: Where are things slowing down?
- Inventory management: How much stuff do you really need?
- Resource allocation: Are your resources being used effectively?
- Delivery performance: Are your deliveries on time and accurate?
- Waste reduction: How can you minimize waste and save money?
6. HR Analytics Reports
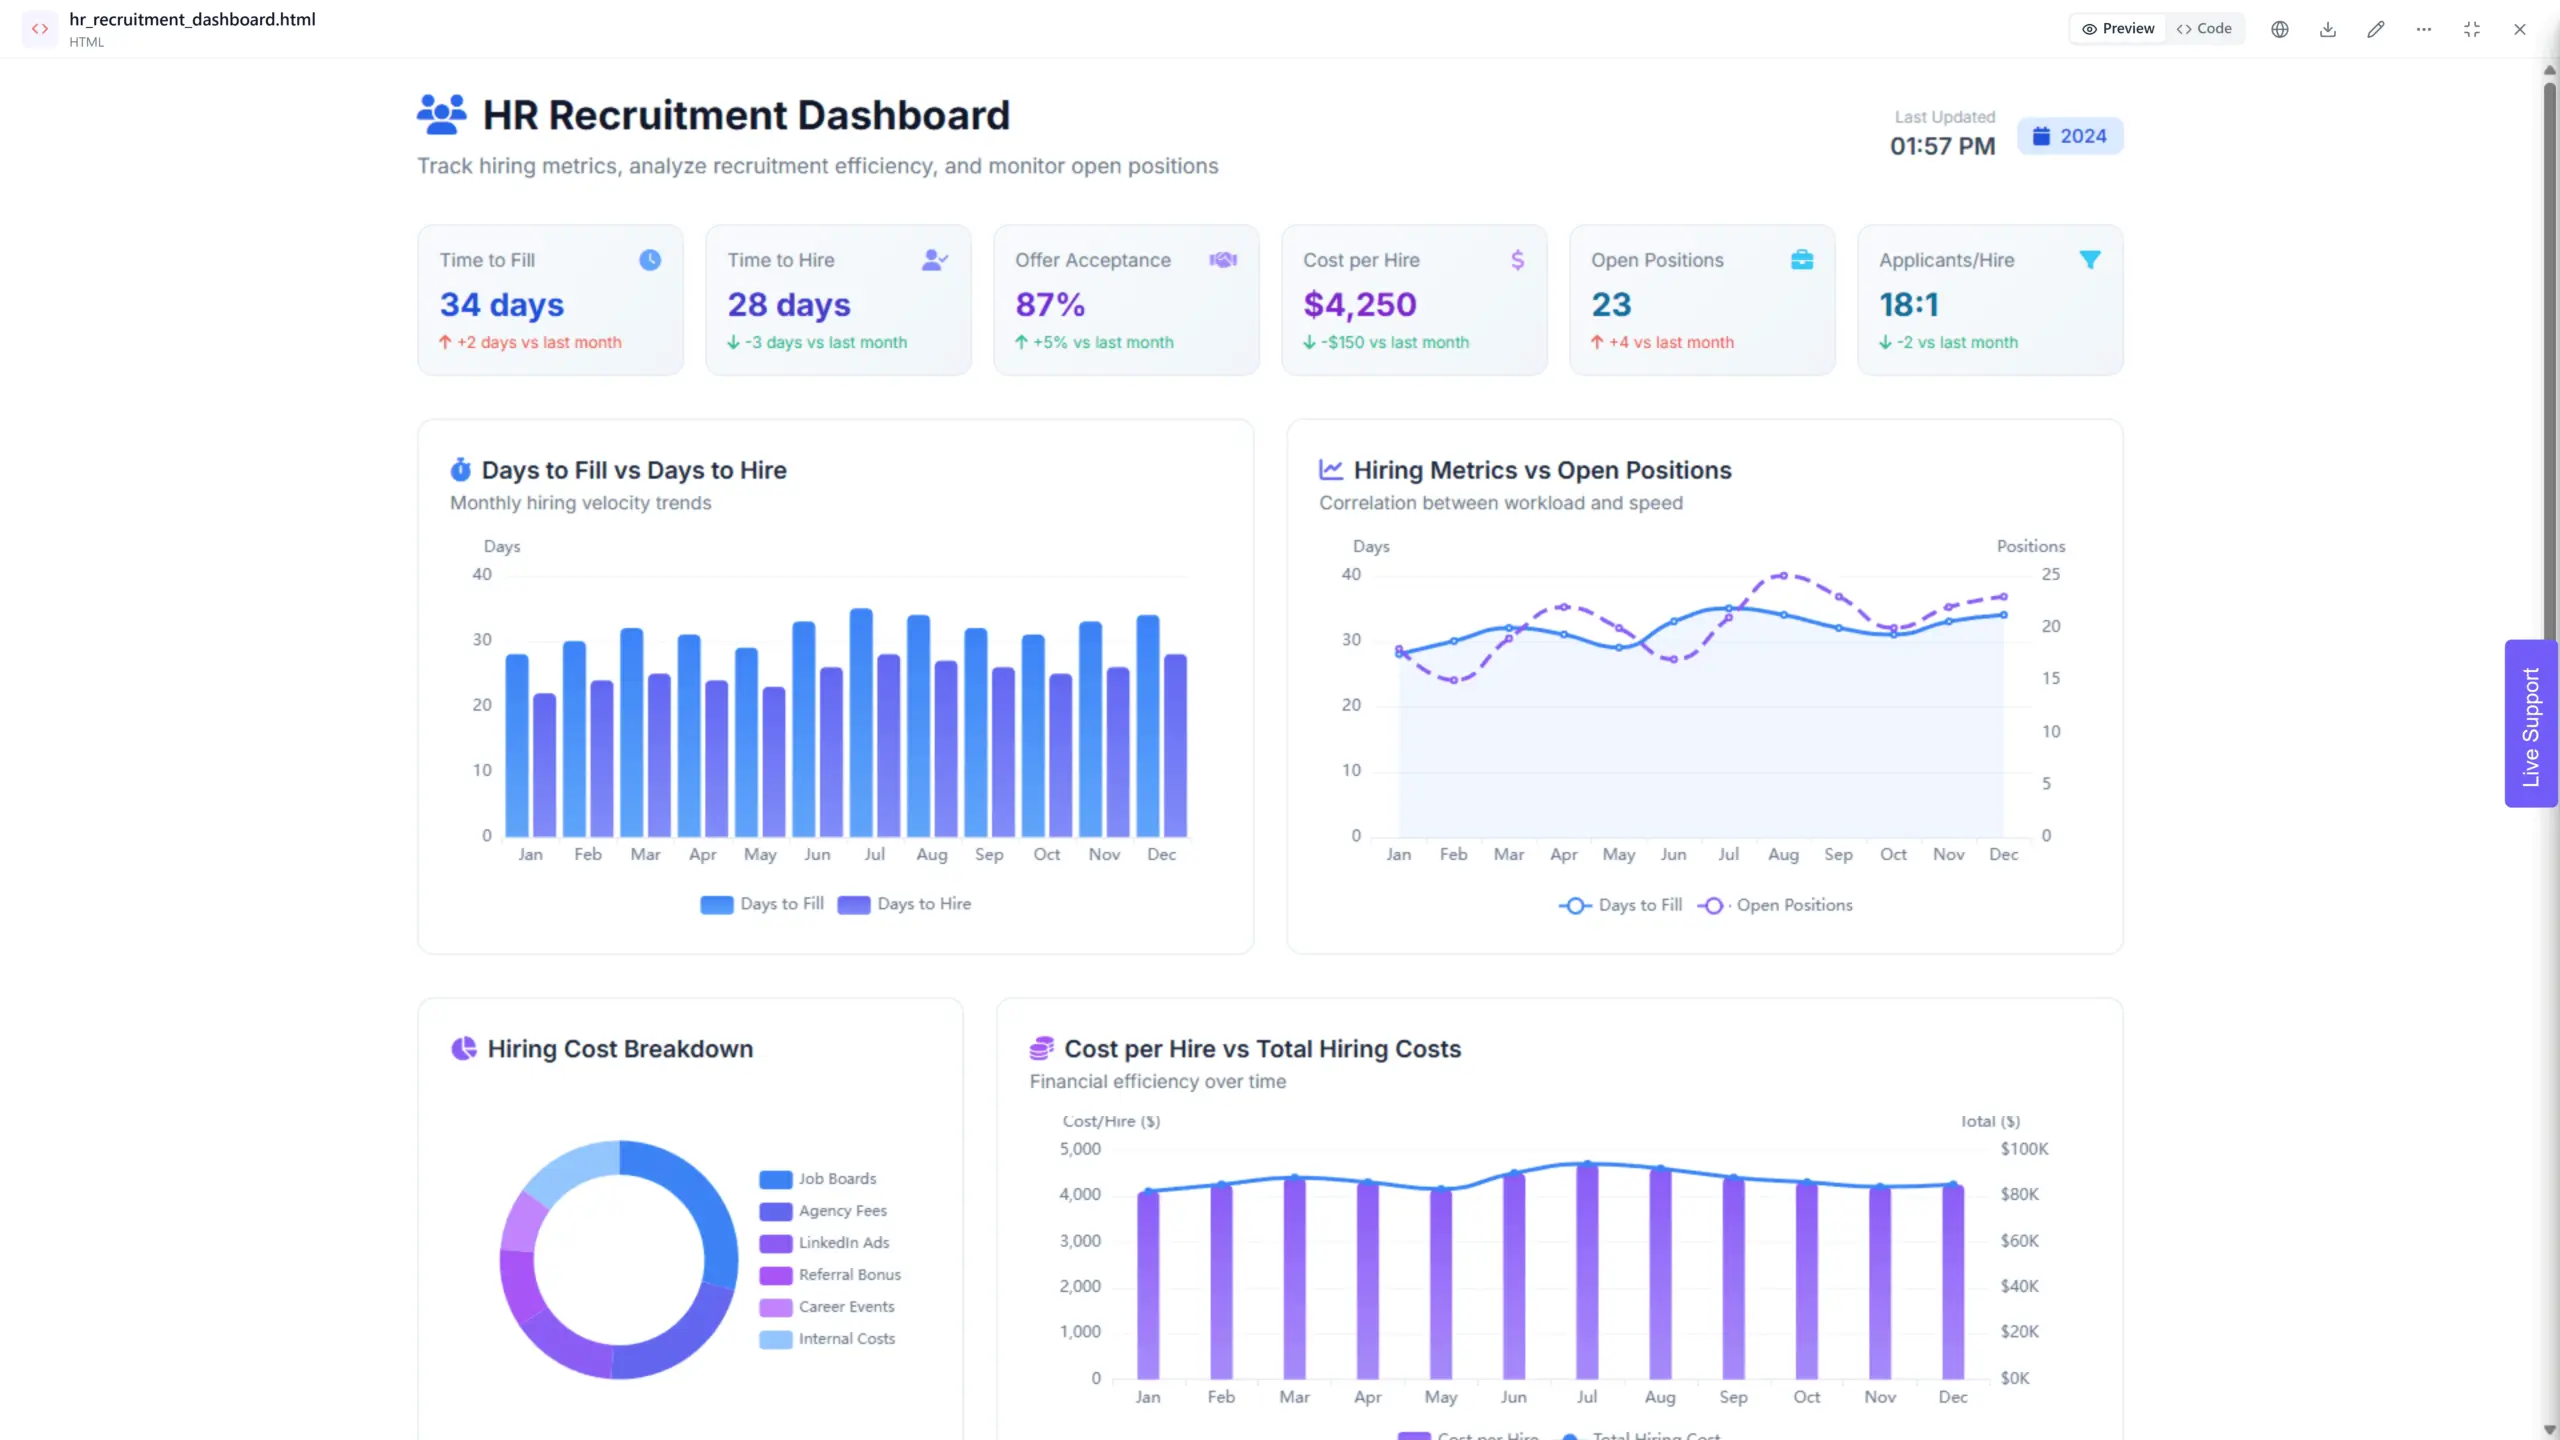
HR ad hoc reports analyze data on employee performance, recruitment efforts, or turnover to identify trends, improve hiring processes, or boost employee engagement.
- Recruiting effectiveness: Are you hiring the right people efficiently?
- Employee performance: Who’s excelling and who needs help?
- Workforce trends: What skills gaps or turnover issues do you have?
- Compensation & benefits: Are you offering competitive packages?
- Employee engagement: How happy and engaged are your employees?
With HR automation tools, reports are generated more efficiently, offering real-time insights and simplifying the tracking of key metrics. We have created overview of 10+ important KPIs for HR managers.
How To Create Ad Hoc Report?
Creating an ad hoc report involves following 7 steps, though the specifics may vary depending on the tools you’re using.
Time needed: 1 hour and 30 minutes
7 steps on how to create ad hoc report
- Identify the Question
The first step is to clearly define the question your report is trying to answer. What specific insight are you looking for in the data? This will guide your data selection and analysis.
- Gather Your Data
Once you know your question, determine the data sources you’ll need. This could involve pulling data from databases, spreadsheets, CRM systems, or marketing automation platforms.
- Clean and Prepare the Data
The data you gather might need cleaning or formatting to ensure consistency and accuracy. This might involve removing duplicates, correcting errors, or transforming formats.
- Choose Your Tool
Many platforms offer ad hoc reporting functionalities. Depending on your needs, you might use spreadsheet software like Excel with pivot tables, business intelligence (BI) tools, or specific reporting modules within your data source platforms.
- Build Your Report
Use your chosen tool to design your report layout. This involves selecting the data elements (metrics and dimensions) relevant to your question and arranging them in a clear and visually appealing way.
- Analyze and Interpret:
Once your report is built, analyze the data to answer your question. Look for trends, patterns, or outliers that provide insights.
- Communicate Findings
Share your report with the relevant stakeholders and explain your findings and their implications. Visualizations like charts and graphs can enhance communication and understanding.
Here are some additional tips for creating effective ad hoc reports:
- Keep it Simple: Focus on the essential data points to answer your question and avoid overwhelming the audience with too much information.
- Visual Appeal: Use charts, graphs, and formatting to make your report visually engaging and easier to understand.
- Filter and Drill Down: Many tools allow you to filter data subsets or drill down into specific details for further exploration.
- Collaboration: Consider allowing others to contribute or share insights based on the report.
Remember, ad hoc reporting is an iterative process. As you explore the data, you might refine your question or identify the need for additional data points. The key is to be flexible and focus on extracting the insights you need for informed decision-making.
How To Choose Ad Hoc Reporting Software?
Choosing the right ad hoc reporting software depends on several factors specific to your needs and workflow. Here are 6 key considerations to help you pick the best tool:
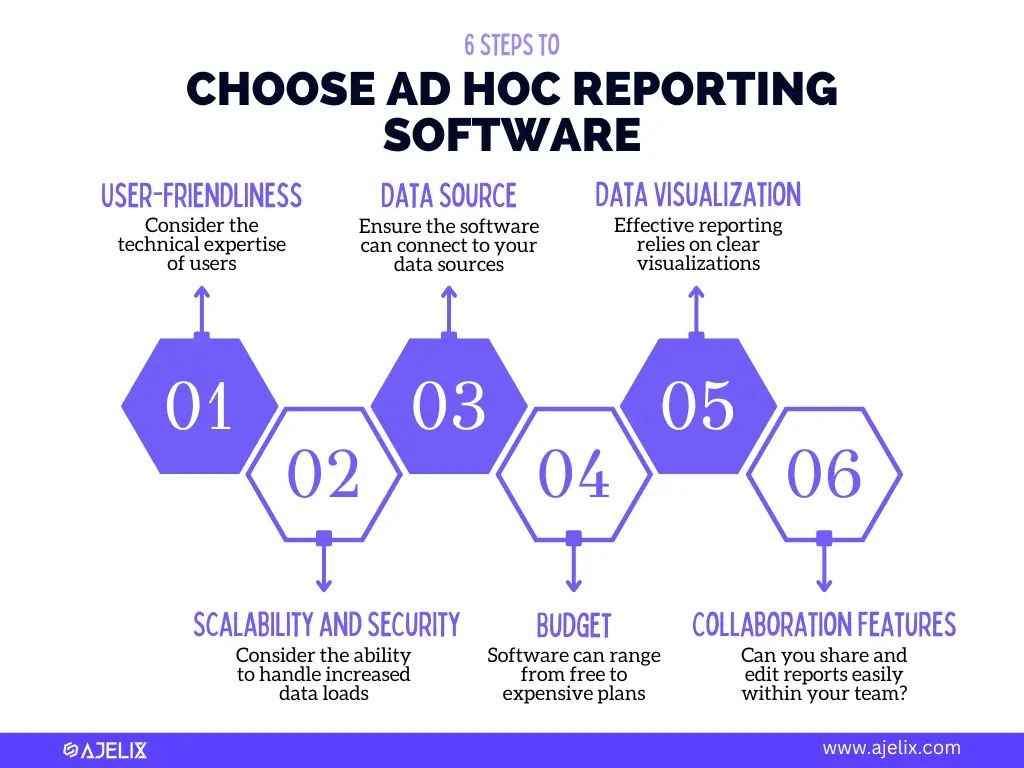
6 steps in choosing the right ad hoc reporting software, infographic by author
1. Data Source Compatibility
Ensure the software can connect to your data sources (databases, spreadsheets, CRMs, etc.) This avoids the hassle of data migration or manual manipulation.
2. User-friendliness
Consider the technical expertise of the people who will be creating reports. Ideally, the tool should offer a user-friendly interface with drag-and-drop functionality and clear instructions for easy report building.
3. Data Visualization Capabilities
Effective reporting relies on clear visualizations. Does the software offer a variety of charts, graphs, and formatting options to present your data insights engagingly?
4. Scalability and Security
If your data volume is large or expected to grow, consider the software’s ability to handle increased data loads. Security features are also crucial, ensuring your data remains protected.
5. Collaboration Features
Does the software allow for collaboration on reports? Can multiple users share reports, add comments, or contribute to the analysis? This can be valuable for teams.
6. Budget
Ad hoc reporting software can range from free (with limited features) to enterprise-level solutions with robust functionalities. Determine your budget and choose a tool that offers the features you need at a reasonable cost.
Additional tips:
- Free Trials: Many vendors offer free trials, allowing you to test-drive the software and see if it meets your needs. Ajelixoffers freemium plan that you can explore without complex setups.
- User Reviews: Read user reviews and comparisons of different ad hoc reporting tools to get insights from real users.
- Consider Cloud-based vs. On-premise: Cloud-based solutions offer easier accessibility and scalability, while on-premise solutions might provide more control over data security (depending on your needs).
By carefully considering these factors, you can choose an ad hoc reporting software that empowers your team to generate valuable insights from your data and make informed decisions.
Conclusions
Ad hoc reporting and analysis turn you from data observer to knowledge architect. Using ad hoc reporting you can unlock hidden insights within your data, answer critical questions in real-time, and make data-driven decisions that propel your business forward.
Key takeaways:
- React quickly to new questions and trends.
- Empower business users to analyze data themselves.
- Discover deeper insights for improved problem-solving.
- Foster data-driven communication across departments.
No matter what department your in ad hoc reporting can help you discover new strategies and take ownership of your data.
FAQ
Standard reports are pre-defined templates that deliver specific data sets regularly, however ad hoc reports are created on-demand to answer specific questions or investigate trends.
You can use the most appropriate platform that fits your needs from spreadsheets to Business intelligence (BI) tools and specific reporting modules within data source platforms.
Ready to create your ad hoc report with Ajelix?
From data to report in one minute or less with Ajelix AI Agents


