Financial Business Intelligence: Solve Your Data Tasks

Financial business intelligence uses data analytics to unlock insights specifically from a company’s financial data. Measuring business financial health is vital for any manager or owner to understand what is happening in your company.
TL;DR
Financial business intelligence (BI) uses data analytics to understand a company’s financial health, improve profitability, manage risks, and support strategic planning. Implementing financial BI involves collecting, cleaning, and integrating financial data, choosing the right BI tools, and creating dashboards and visualizations for actionable insights. Key benefits include better decision-making, cost reduction, increased revenue, and enhanced collaboration. Common pitfalls include poor data quality, unclear goals, resistance to change, integration issues, and selecting the wrong tools. Popular tools include Ajelix, Power BI, Tableau, Zoho Analytics, and Klipfolio. Financial BI is useful for businesses of all sizes seeking data-driven financial management.
However, you can’t do that with messy spreadsheets or tools that are too hard to use or understand. This is where financial business intelligence tools come in handy. This article will explain the basics of financial BI, where to start, and offer tools that can help you ease the journey.
Change the way you work with agentic AI
One-click dashboards,KPI tracking, and AI-powered insights—for work that actually gets done.

What Is Financial Business Intelligence?
Financial business intelligence uses data analysis techniques to understand an organization’s financial health. It involves gathering financial data from various sources, analyzing it, and presenting it in a way that helps businesses make better decisions.
Business intelligence for finance:
- Collects financial data: This data can come from accounting systems, sales figures, and market trends.
- Integrates and Cleans Data: The collected data often comes in different formats, so you must clean the data to ensure accuracy.
- Analyzes the data: Financial analysts use data to identify patterns, trends, and areas where the company might improve.
- Data Visualization: The complex data analysis should be translated into understandable formats using financial dashboards, charts, graphs, and reports.
- Provides insights: The analysis is presented clearly and concisely, often through reports, dashboards, and visualizations.
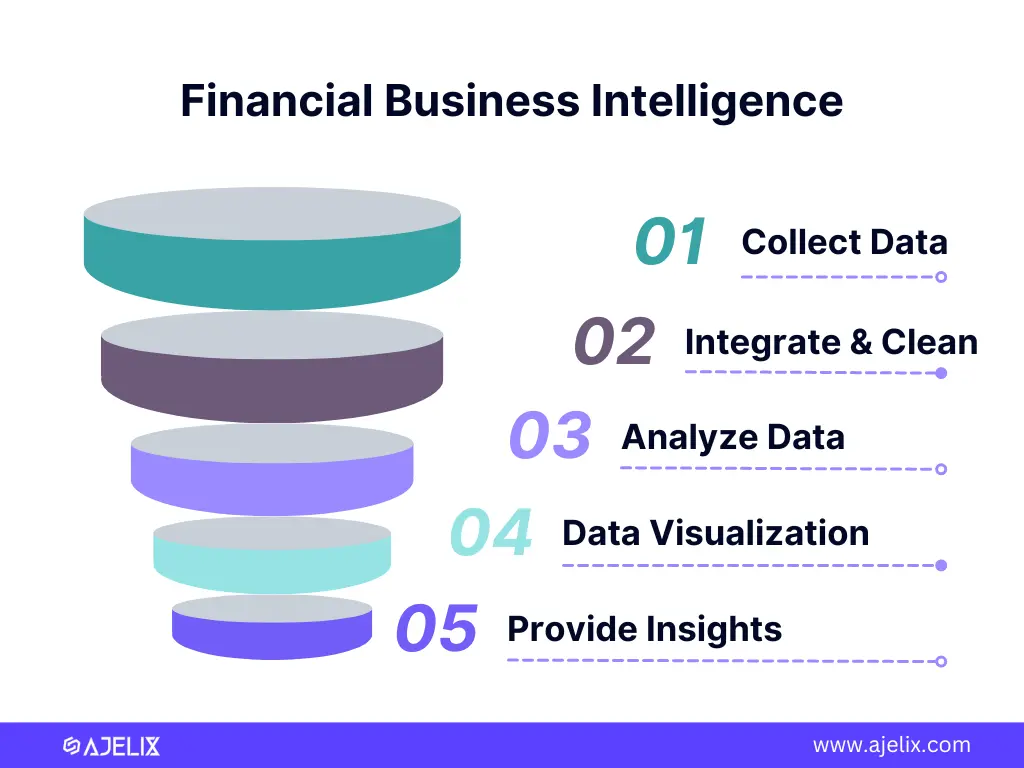
Infographic with financial business intelligence steps, created by the author
Financial business intelligence can be used for:
- Improve profitability: Identify areas where you can cut costs or increase revenue.
- Manage risks: Identify potential financial risks and take steps to mitigate them.
- Meet compliance requirements: Ensure the company’s financial reporting is accurate and up-to-date.
- Strategic planning: Provide insights to develop long-term financial plans.
In short, financial business intelligence is a powerful tool that can help businesses improve their financial performance and make better decisions.
What Are The Benefits of Financial BI?
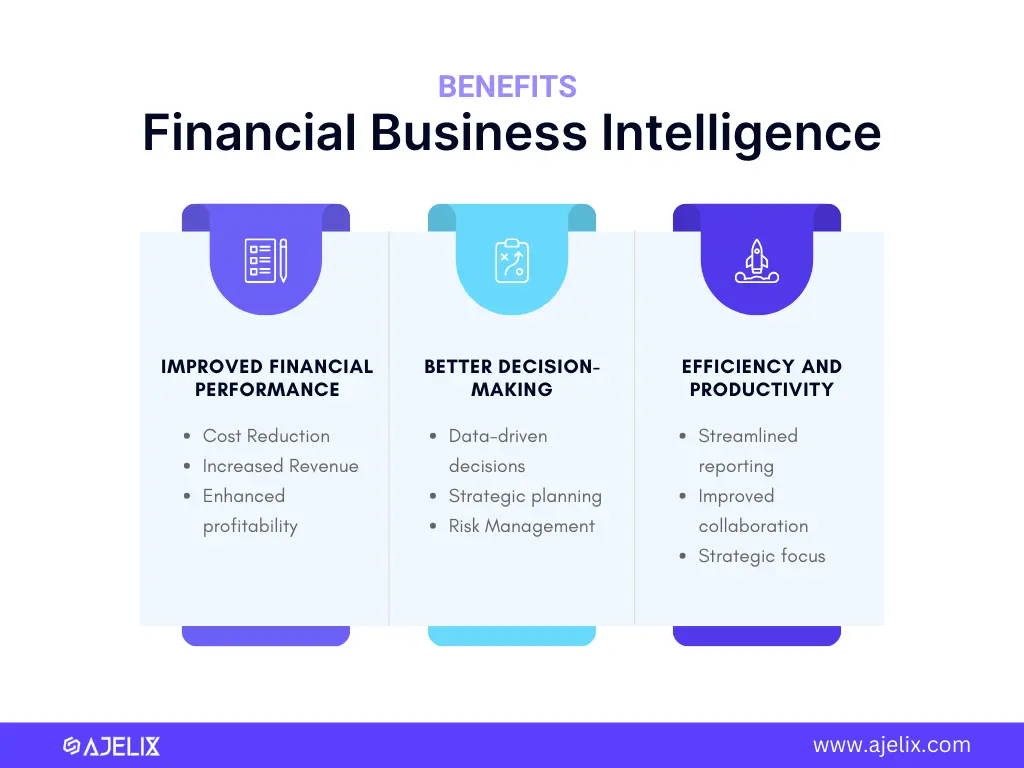
Infographic with financial business intelligence benefits, image by author
Financial business intelligence (FBI) offers a range of benefits that can significantly improve a company’s financial health and decision-making. When aligned with an enterprise cloud strategy, these benefits extend further by enabling unified data environments and seamless access to analytics across multiple business units. Here are some key advantages:
Improved Financial Performance
- Cost Reduction: Pinpoint areas to cut costs and optimize resource allocation by analyzing spending patterns and identifying inefficiencies.
- Increased Revenue: Identify sales trends, customer behavior, and market opportunities, to develop targeted strategies for revenue growth.
- Enhanced Profitability: Businesses can improve their profitability by optimizing costs.
Better Decision-Making
- Data-Driven Decisions: Financial insights based on concrete data analysis replace guesswork and intuition.
- Strategic Planning: Develop long-term financial plans and forecast performance, to set realistic financial goals.
- Risk Management: Identify potential financial risks like market fluctuations or credit defaults, to take proactive measures to mitigate them.
Increased Efficiency and Productivity
- Streamlined Reporting: Automated reports and dashboards generated by BI tools enhanced by AI-powered workflow automation, save time and resources compared to manual data analysis.
- Improved Collaboration: Financial data becomes readily accessible across departments, empowering non-technical users to access data.
- Focus on Strategic Initiatives: Freed from time-consuming data analysis tasks, financial professionals can focus on strategic financial planning and analysis.
Overall, financial business intelligence empowers businesses to make smarter financial decisions, optimize performance, and achieve their financial objectives.
How To Implement Financial Business Intelligence?
Implementing financial business intelligence in your business involves a structured approach. Here’s a roadmap to get you started:
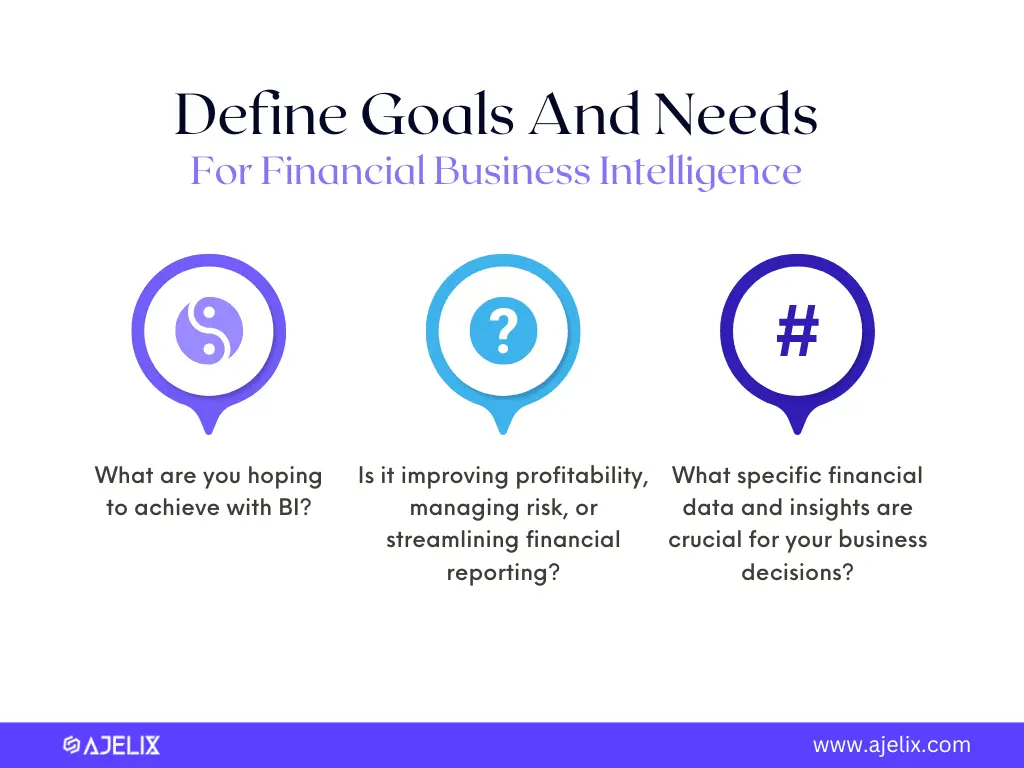
- Define Your Goals and Needs
Answer to these questions: What are you hoping to achieve with BI? Is it improving profitability, managing risk, or streamlining financial reporting? What specific financial data and insights are crucial for your business decisions?
- Assess Your Data Landscape
Data Sources: Identify all potential sources of financial data, including internal accounting systems, sales records, and external market data.
Data Quality: Evaluate the data’s accuracy, consistency, and completeness.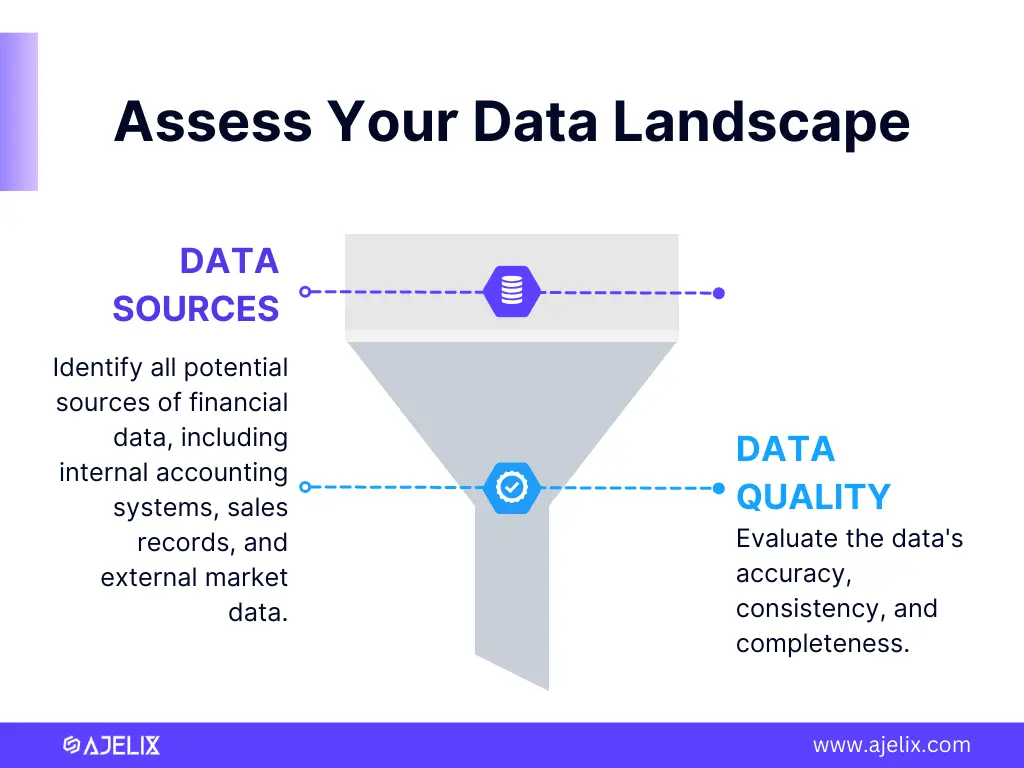
- Develop a Data Strategy
Data Collection: Determine how you will collect data from various sources and automate the process if possible.
Data Warehousing: Establish a central repository (data warehouse) to store and integrate all your financial data.
Data Governance: Define data access, security, and maintenance protocols to ensure data integrity. - Choose the Right Tools
Financial BI Software: Select a business intelligence (BI) tool for financial data analysis and visualization.
Consider Features: Look for tools that offer functionalities like financial dashboards, reporting, and data analysis specific to financial metrics.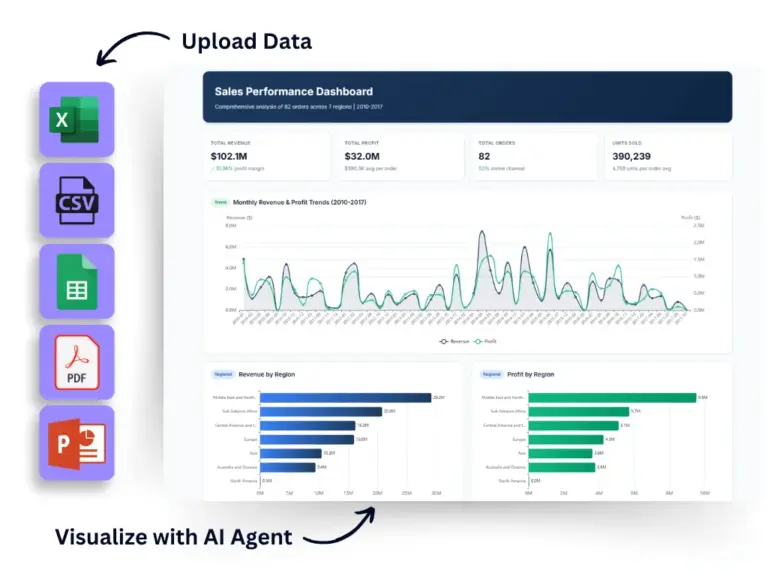
- Implement and Integrate
Data Integration: Connect your chosen BI tool with your data warehouse to ensure seamless data flow.
User Training: Train financial analysts, business leaders, and relevant personnel on using the BI tools and interpreting financial insights. - Refine and Monitor
Continuous Improvement: Regularly assess the effectiveness of your analytics process.
Data Monitoring: Monitor data quality and identify areas for improvement in data collection and analysis.
Evolving Needs: Adapt your FBI system as your business needs and financial objectives evolve.
Additional Tips
- Start Small: Begin with a pilot project focusing on a specific financial area before implementing BI across the organization.
- Seek Expert Help: Consult with data analysts or financial BI specialists for guidance and expertise.
- Communication is Key: Communicate the value proposition of BI to gain buy-in from all stakeholders within the organization.
By following these steps and continuously refining your approach, you can successfully implement financial business intelligence and unlock the power of data-driven financial decision-making for your business.
Reporting gives you a headache?
Upload your data and create professional reports with agentic AI

Start free
Try free and upgrade whenever
Pitfalls to Avoid When Launching Financial Business Intelligence
Problem #1: Poor Data Quality
Garbage in, garbage out. Financial BI relies on accurate and complete data to generate reliable insights. Inconsistent data formats, errors, and missing information can lead to misleading conclusions and hinder informed decision-making.
Solution: Invest in data cleaning processes to identify and fix inaccuracies. Consolidate data from various sources into a central, well-organized repository. Or use BI tools that provide data preparation or cleaning, such as Ajelix.
Problem #2: Unclear Goals For Financial Business Intelligence
Without a specific destination in mind, it’s difficult to choose the right path. Vague goals for financial BI make it challenging to select the most relevant data and functionalities for your chosen solution.
Solution: Define clear objectives for your BI implementation. Are you aiming to boost profitability, manage risk more effectively, or improve regulatory compliance? Knowing your priorities helps tailor your BI solution for maximum impact.
Problem #3: Resistance to Change
People often prefer familiar routines. Employees accustomed to traditional financial reporting methods may be hesitant to adopt new BI tools and processes. This resistance can hinder the successful implementation of financial BI.
Solution: Open communication and comprehensive training are key. Explain the benefits of BI for employees and demonstrate how it can improve their work efficiency and decision-making.
Problem #4: Integration Challenges
Financial data often resides in multiple systems across an organization. Connecting your chosen BI tool with these disparate sources can be complex. Technical expertise or external support might be necessary to ensure seamless data flow.
Solution: Evaluate your existing IT infrastructure and choose a BI tool that offers easy integration capabilities. Seek professional help if needed to ensure a smooth data connection process.
Problem #5: Choosing the Wrong Tool For Financial BI
Not all tools are created equal. Selecting a BI solution that doesn’t cater to your specific financial needs or budget can limit its effectiveness. You may end up with functionalities you don’t need or lack features crucial for your financial analysis.
Solution: Thoroughly research and compare different BI solutions. Consider factors like features, scalability, user-friendliness, and cost. Choose a tool that aligns with your specific financial requirements and budget constraints.
Best Financial Business Intelligence Tools
There’s no big difference between standard BI tools and financial business tools. The only difference is how you call it and how you will use the software. However, we have gathered the list with self-service BI tools that can help businesses analyze financial data:
- Ajelix: simple agentic AI platform designed for non-technical teams
- Power BI: one of the biggest BI tools in the market with advanced analytics capabilities
- Klipfolio: focuses on measuring metrics and data cleansing
- Zoho Analytics: advanced visualization software for small teams and enterprises
- Tableau: another big data analytics platform with advanced features, ideal for enterprise and data scientists.
Conclusion
In summary, financial business intelligence is the same BI platform with a focus on financial data visualization and analytics. Each business will have its reasons why to implement analytics solutions in a company. The main thing you should remember is the goal. Why do you need BI? That will help you pick the right software and make your company data-driven.
Most of the BI tools offer freemium plans or trials. Play around with some tools and pick the one that feels more natural. P.S. Ajelix offers a freemium plan, that you can start using after simple registration.
FAQ
Regular BI looks at all business data, while financial BI focuses specifically on financial data like revenue, expenses, and profitability. It uses this data to answer financial questions and improve financial performance.
Yes, financial BI often requires specialized software, such as Ajelix that can handle complex financial data integration, analysis, and visualization. These tools go beyond basic spreadsheet capabilities.
Financial BI costs vary depending on features, deployment (cloud vs. on-premise), and user base. It can range from free (basic tools) to thousands per month for enterprise solutions.
Financial BI lets you generate reports on:
Profitability: Track income, expenses, and margins.
Cash flow: Monitor incoming and outgoing cash.
Financial performance: Analyze trends and identify areas for improvement.
Budgeting and forecasting: Create financial projections and track variances.
Compliance: Generate reports for regulatory requirements.
Financial BI can be very useful for SMEs. It can help them:
Compete with larger companies by providing data-driven insights.
Make better financial decisions with clear visibility into finances.
Improve efficiency by identifying areas to optimize spending.
Manage cash flow more effectively.
There are also affordable financial BI solutions designed specifically for SMEs.
Ready to create a financial dashboard with Ajelix?
From data to report in one minute or less with Ajelix AI Agents


