7 Best AI For Data Analysis: Tools You Can’t Miss
Data analysis used to be a slow, manual process. But with the ever-increasing volume and data complexity, traditional methods just don’t cut it anymore.
AI for data analysis applies artificial intelligence techniques to analyze datasets, uncover patterns, and generate insights that would be difficult or impossible through traditional methods.
With the wide option of available technologies businesses can use AI for data analysis to fast-forward data processing and ease the analytics tasks.
We’ve identified the 7 best AI-powered software for data analysis, designed to help with data tasks and unlock insights from your data.
Change the way you work with agentic AI
One-click dashboards,KPI tracking, and AI-powered insights—for work that actually gets done.

What is AI Data Analysis?
AI data analysis is the process of using artificial intelligence techniques to extract meaningful insights from large and complex datasets. It automates tasks, finds hidden patterns, and generates conclusions that would be difficult or impossible for traditional data analysis methods.
How Is AI Used In Data Analysis?
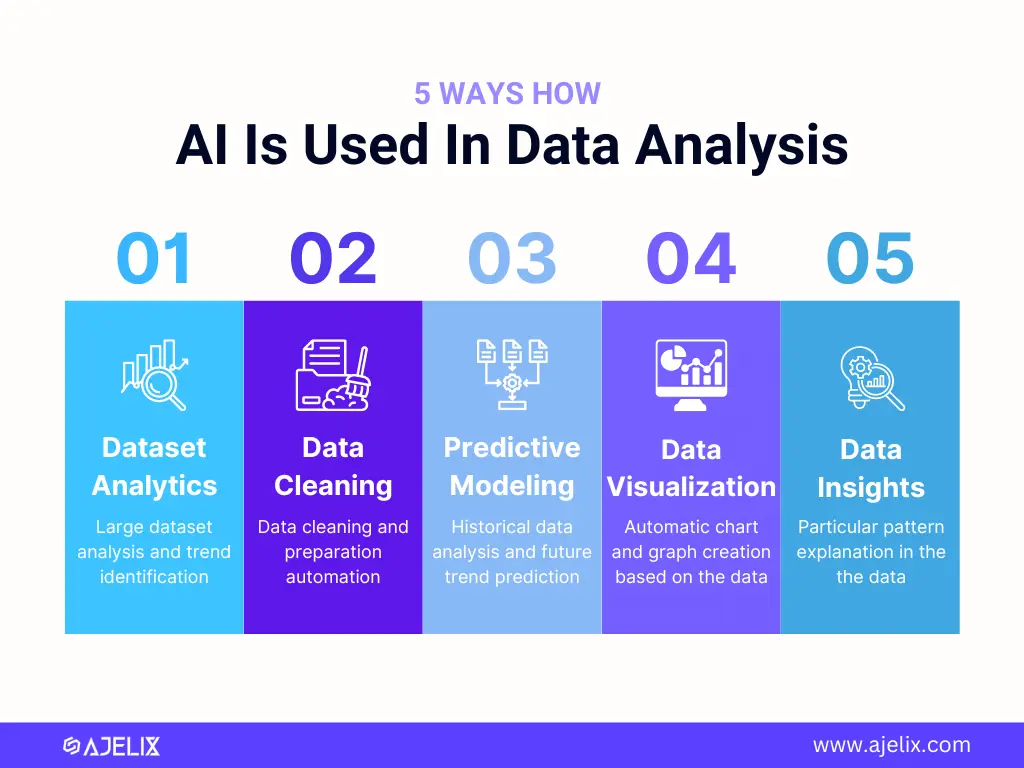
Infographic with 5 ways how AI used in data analysis, image by author
AI is rapidly transforming how businesses extract insights from their data. AI automates tasks, finds hidden patterns, and generates insights that would be difficult or impossible for humans to uncover on their own. Here’s how different AI techniques are used in data analysis tools:
1. Analyzing massive datasets
AI can sift through mountains of data, identifying trends and relationships human analysts might miss. Imagine sifting through millions of customer transactions – AI can automatically detect purchase trends or correlations between products, aiding businesses in optimizing marketing campaigns or inventory management.
2. Data Cleaning and Preparation
Data analysis often involves cleaning and prepping messy datasets before diving into insights. Data analysis often involves cleaning and prepping messy datasets before diving into insights. Integrating a web scraping API such as HasData can significantly speed up the process of extracting and organizing data. AI automates these tedious tasks, freeing up analysts’ time for deeper exploration.
3. Predictive Modeling
AI can analyze historical data and identify trends to predict future outcomes. For instance, AI can forecast customer churn (likelihood of unsubscribing), allowing companies to develop targeted retention campaigns.
4. Data Visualization
AI can automatically generate charts and graphs based on the data, helping non-technical users find the clearest way to represent their findings. AI can present complex data in a visually compelling way so you don’t have to struggle with chart creation. The ability to create dashboards with one click is most loved by Ajelix users.
5. Explaining complex datasets
Some AI tools (Ajelix included) can explain why a particular pattern emerged in the data, providing a deeper understanding of the results.
How Businesses Are Using AI to Get Ahead
Businesses are constantly seeking ways to optimize processes, gain deeper customer insights, and make data-driven decisions. Because once you stop—you’re one step behind. A 2022 McKinsey survey revealed that over 50% of businesses globally have already adopted AI within their business processes. This widespread adoption highlights the need for AI implementation in organizations.
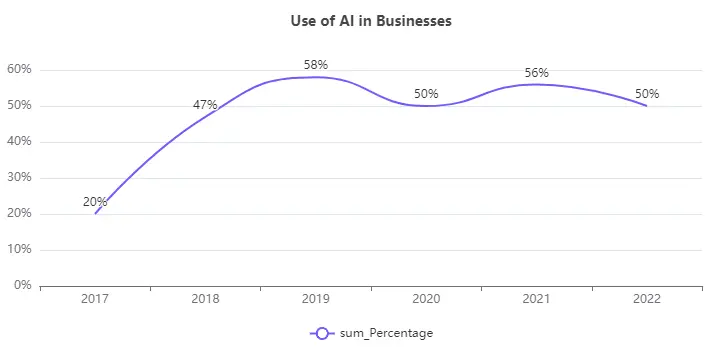
Graph showing the use of AI in businesses, image by author
But how exactly are businesses leveraging this technology? Another study by IBM in the same year sheds light on AI use in Business Intelligence. According to IBM, 26% of businesses are utilizing AI in business intelligence, empowering them to extract valuable insights from vast amounts of data.
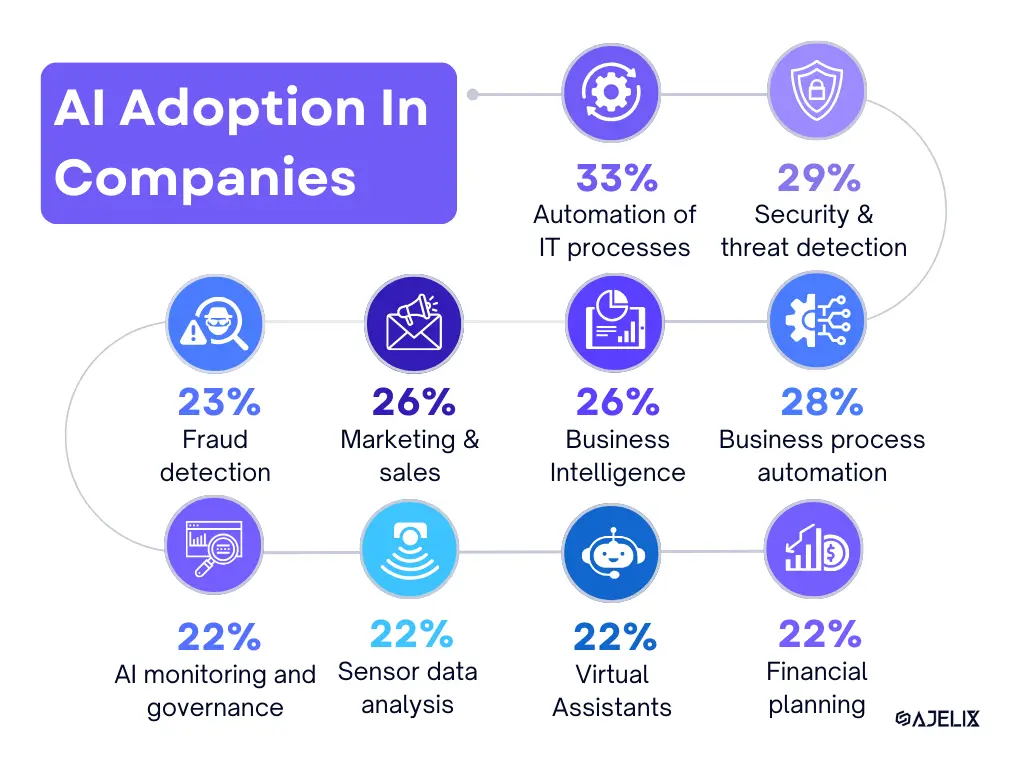
Infographic with business AI adoption statistics in 2022, image by author
These statistics paint a clear picture: AI is not just a futuristic concept; it’s a rapidly growing reality within the business world.
Benefits of Using AI for Data Analysis
So, why are businesses flocking to AI? The reasons are compelling:
- Enhanced Efficiency: automate repetitive tasks, freeing up human resources for higher-level analysis and strategic thinking.
- Deeper Customer Insights: analyze customer data to understand preferences, predict behavior, and personalize marketing campaigns for maximum impact.
- Improved Decision-Making: AI helps analyze vast datasets and identify patterns humans might miss, leading to more informed and data-driven decisions. AI is rapidly transforming how businesses extract insights from their data, but understanding complex data sets often requires a grasp of fundamental concepts. For those looking to deepen their understanding in data analysis, mastering basic SQL queries is essential. This skill not only complements AI analysis but can also enhance one’s ability to manage and query databases effectively. Learning SQL can greatly benefit those involved in analytics tasks by allowing them to write precise queries and manipulate datasets with confidence.
- Innovation and Optimization: optimize business processes, identify new opportunities, and develop innovative products and services.
The statistics speak for themselves. AI is rapidly transforming the business landscape. By incorporating AI into your operations, you gain a significant competitive edge. Whether it’s streamlining workflows, unlocking customer insights, or optimizing decision-making, AI empowers businesses to operate smarter and achieve greater success.
How To Start Using AI for Data Analysis?
The answer to this question depends on your technical expertise and previous knowledge. So we have summarized different ways to implement AI for data analysis in your business based on technical knowledge.
| Non-technical users | Technical users |
|---|---|
| Leverage Pre-built AI Tools: numerous user-friendly, AI-powered data analysis platforms don’t require coding and offer drag-and-drop interfaces for data exploration. You can automate tasks like data cleaning, generate visualizations, and get basic insights. (We’ll provide tools you can use later) | Open-Source AI Libraries: use an ecosystem of open-source AI libraries (like TensorFlow or PyTorch) that allow developers to build AI models. This gives control over the analysis process but requires programming skills and an understanding of AI concepts. |
| Utilize Cloud-Based AI Services: cloud platforms often provide pre-trained AI models that can be integrated into your workflow. You can access these services through user-friendly interfaces without in-depth AI knowledge. | Cloud-Based AI Platforms: cloud platforms offer robust AI development environments with pre-built tools and infrastructure. These platforms offer developers to build, train, and deploy custom AI models for specific data analysis needs. |
Top 7 AI For Data Analysis
Let’s cut the fluff. You are here to see these tools so here they are:
1. Ajelix
Unleash the power of your data without complex coding! Ajelix is an agentic AI tool that empowers users of all experience levels to gain valuable insights from their data.
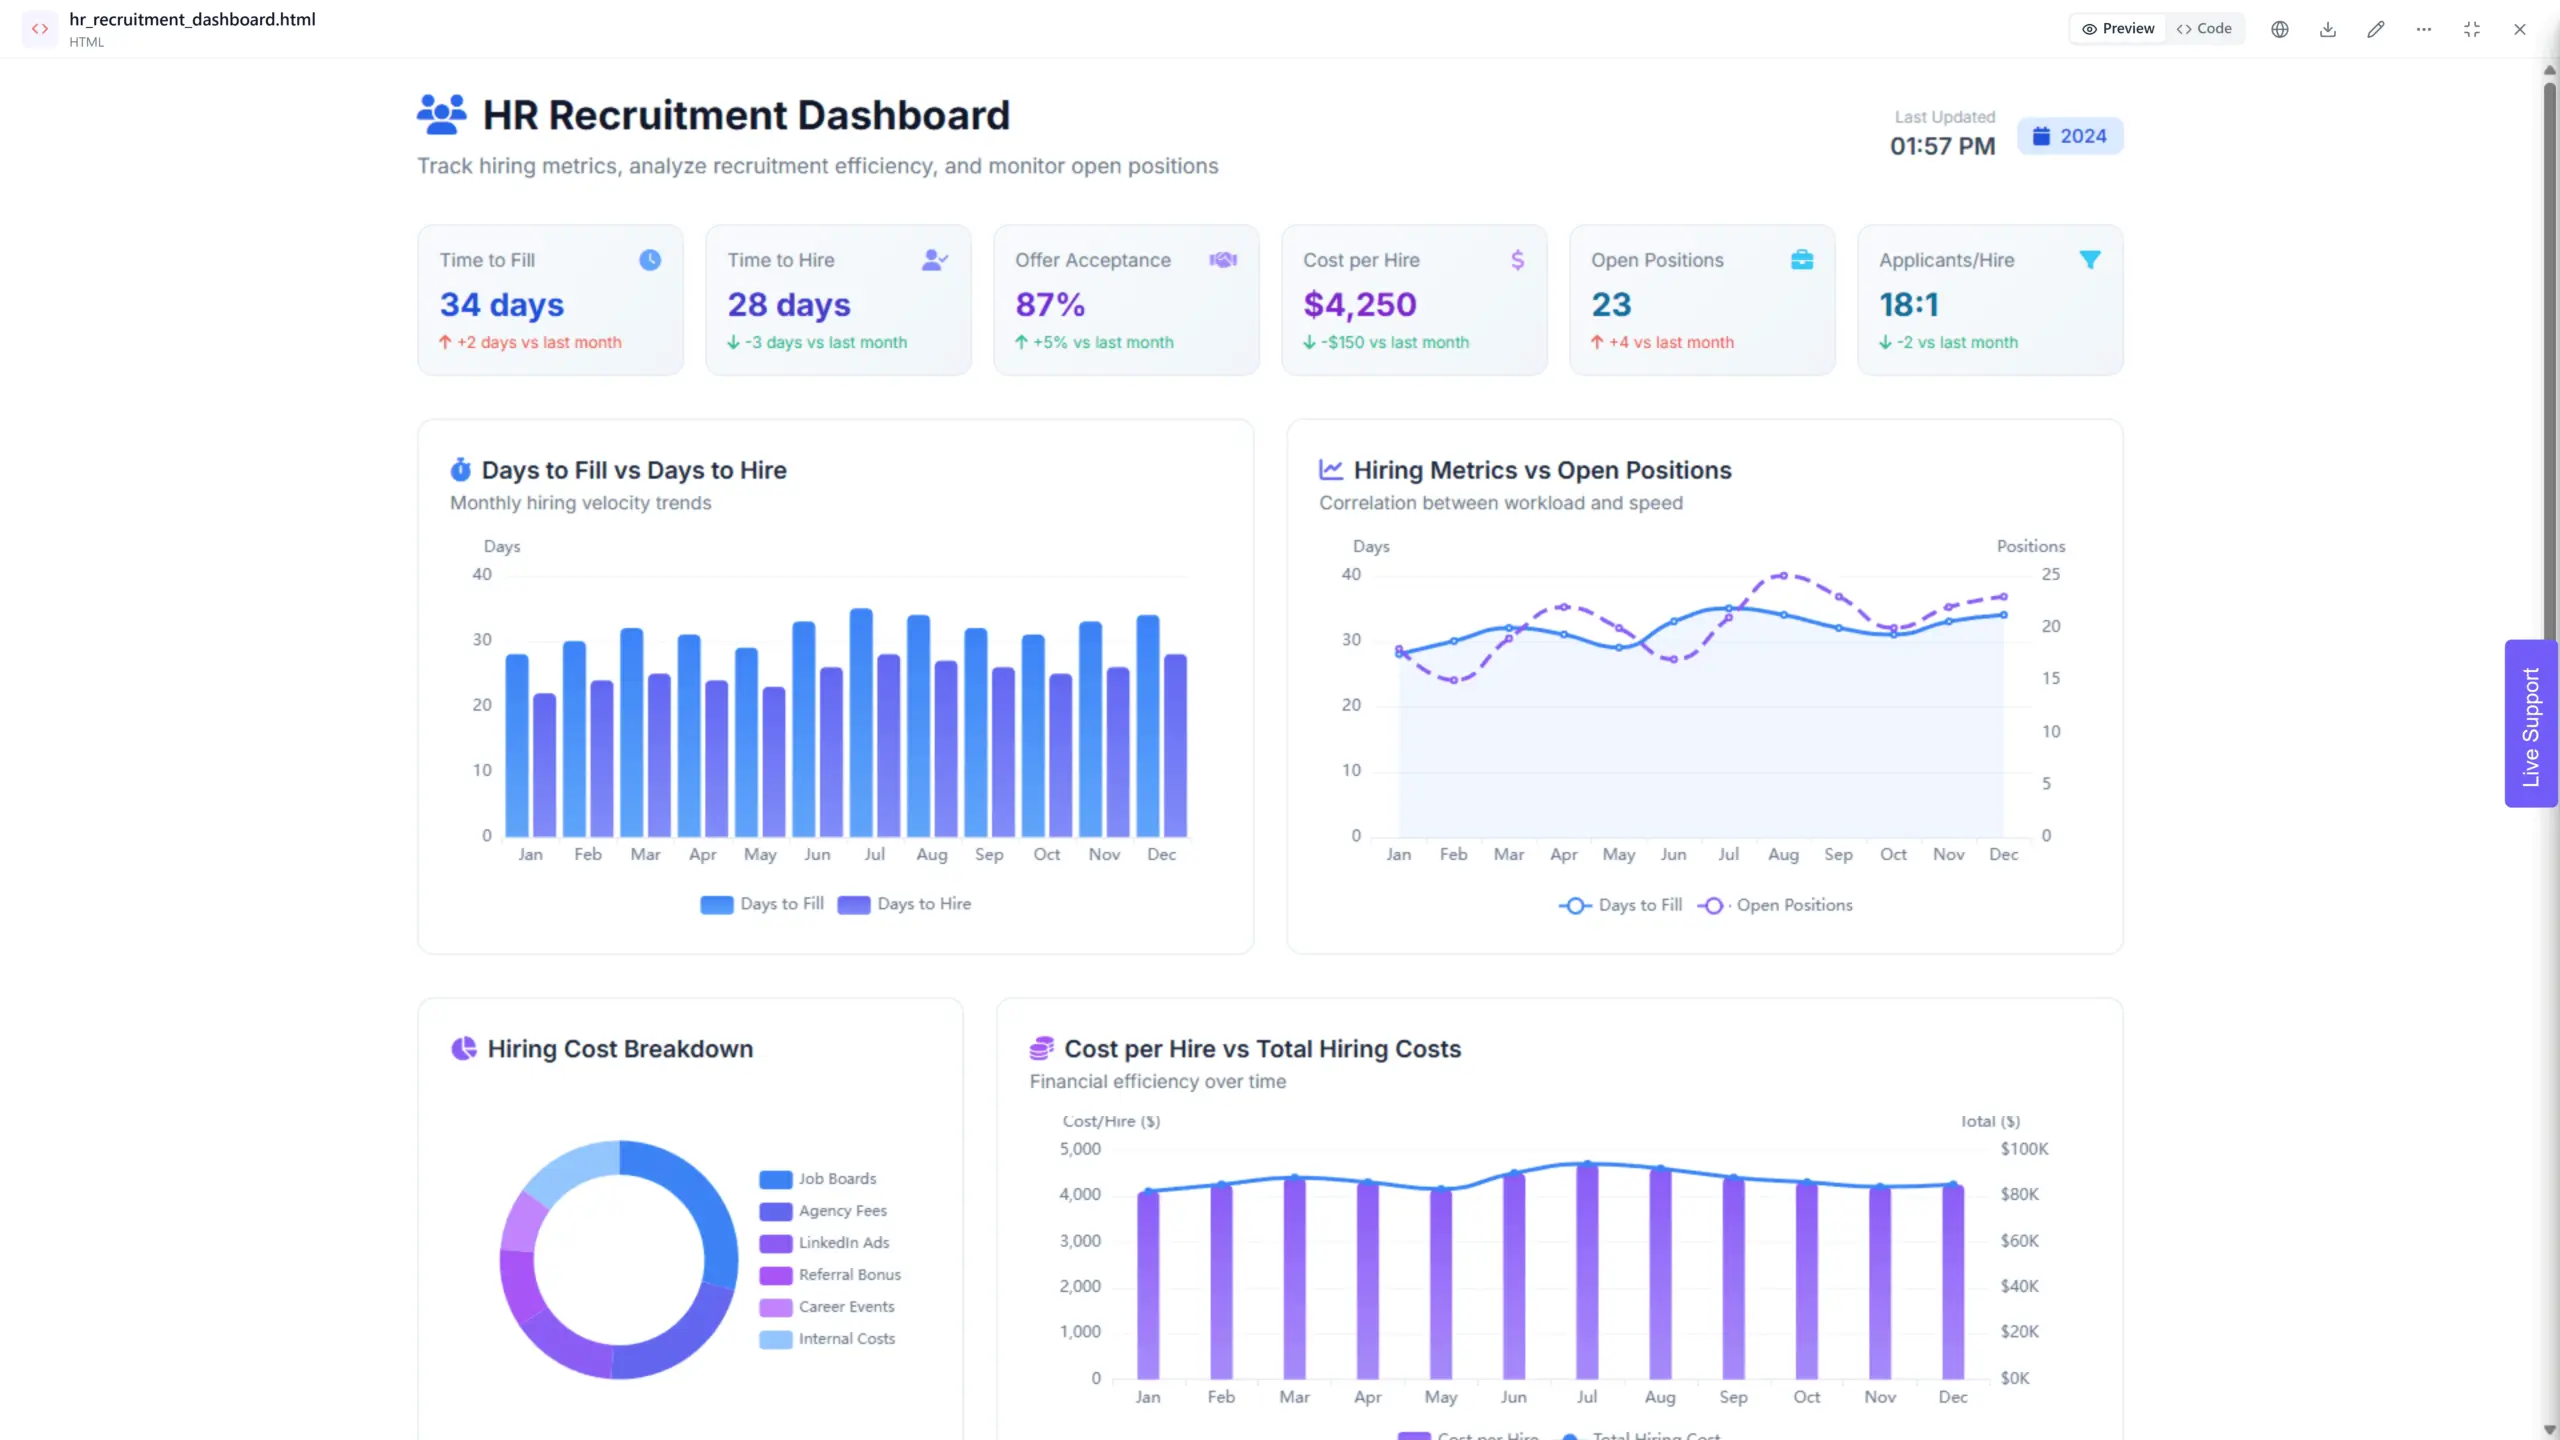
HR recruitment dashboard made by Ajelix
Target Users
Ajelix caters to a broad audience, from business analysts to those with no coding experience. Its user-friendly interface makes data analysis accessible.
Strengths
This platform shines in its ease of use and AI agent features. It simplifies complex data analysis tasks and empowers users to generate reports and visualizations quickly.
Key Features
- AI-powered Chart Builder: This innovative feature uses natural language prompts to create data visualizations, eliminating the need for manual chart creation.
- One-Click Reporting: Generate comprehensive reports with a single click, saving time and effort.
- AI for Data Analysis: Get insights into your data with AI.
Ease of Use
Ajelix boasts a beginner-friendly interface. With its intuitive design and AI assistance, even those new to data analysis can create impactful reports.
Pricing
Ajelix offers pricing options that make it accessible for startups, small businesses, and growing teams alike.
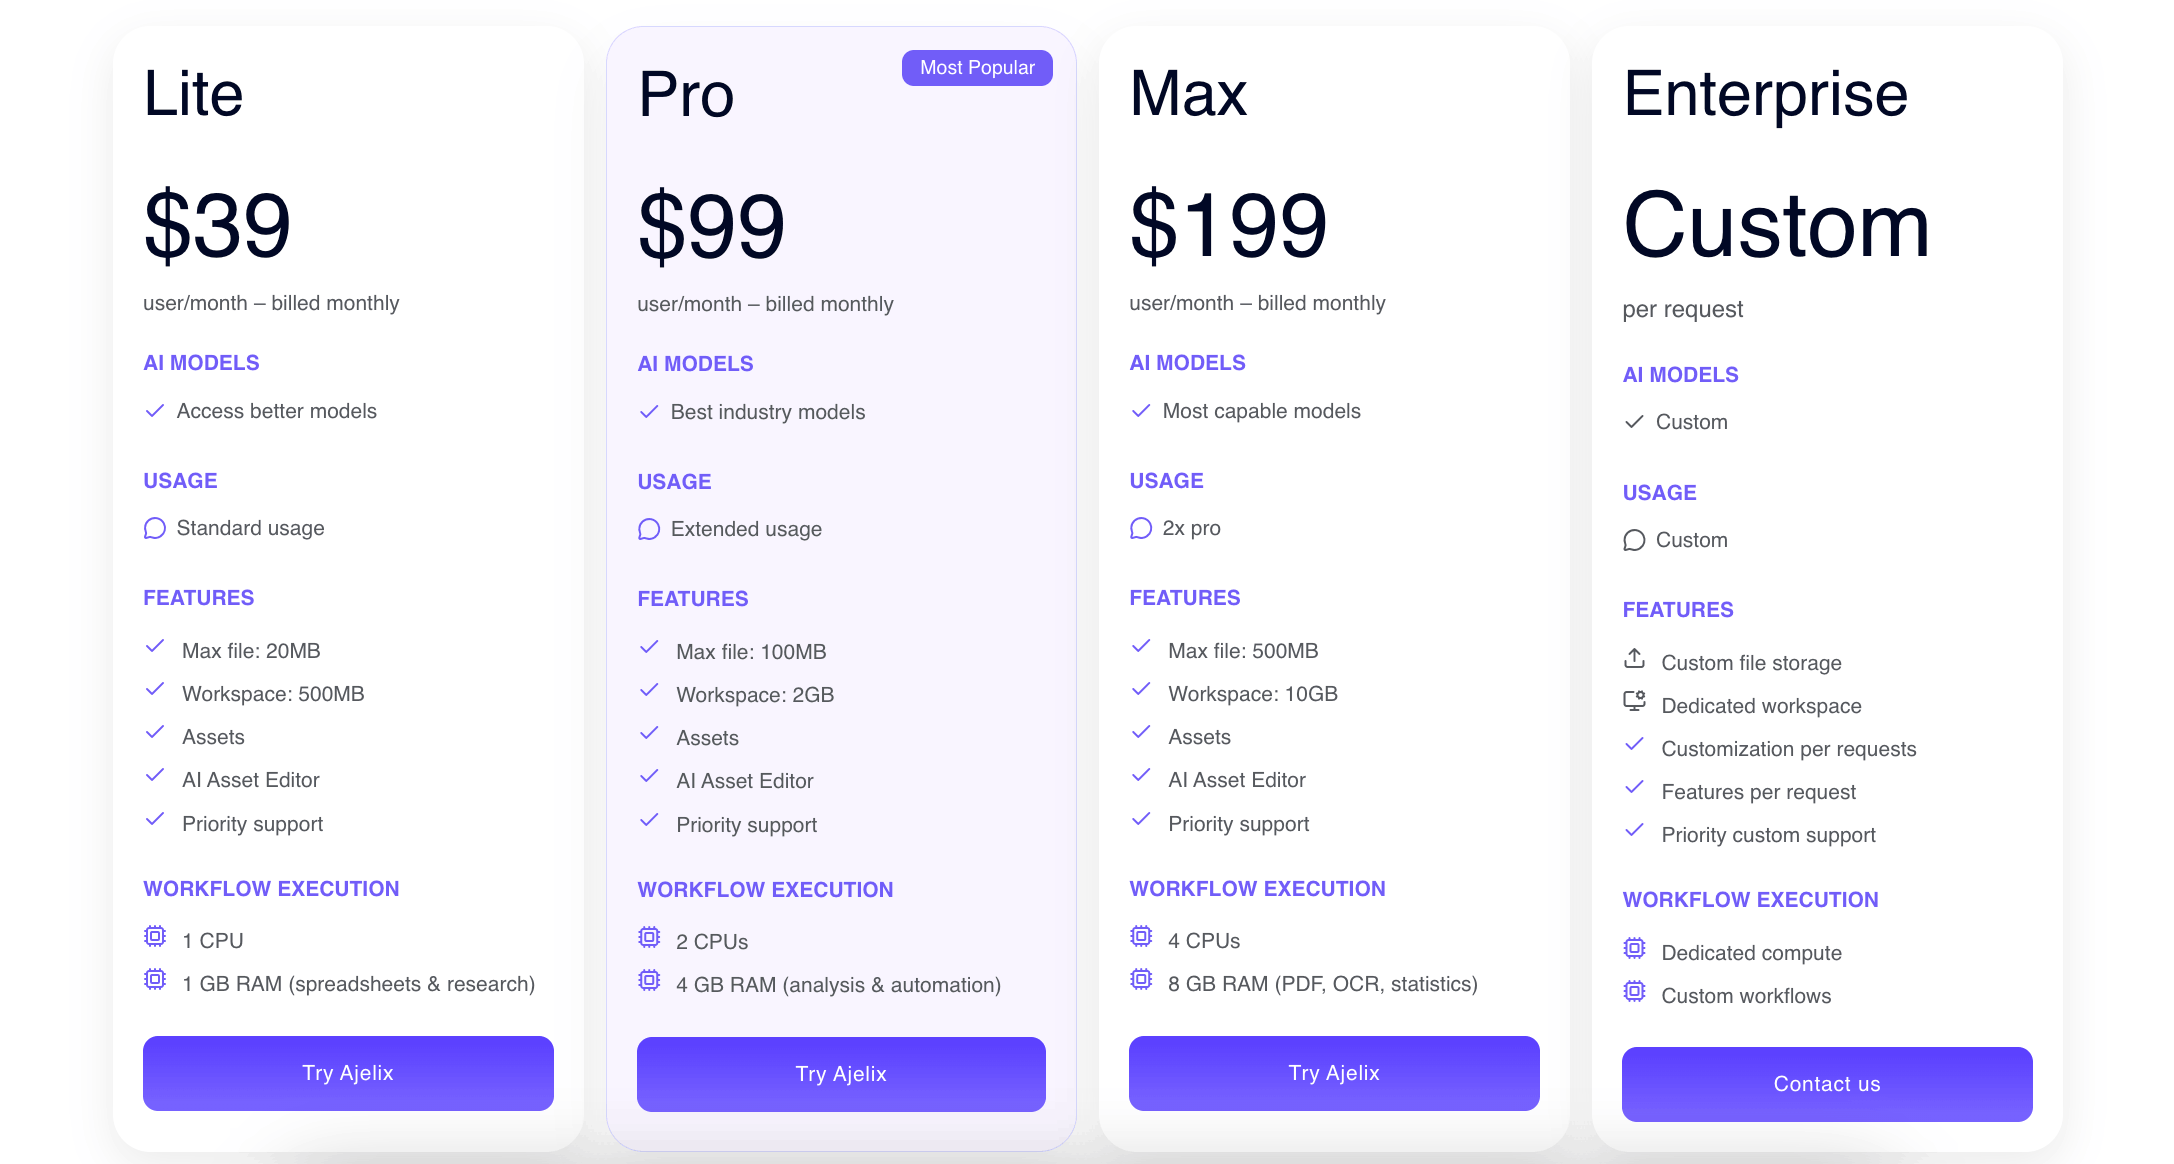
Ajelix pricing plans
Reporting gives you a headache?
Upload your data and create professional reports with agentic AI

Start free
Try free and upgrade whenever
2. Polymer
Polymer Search leverages the power of AI to transform your everyday spreadsheets into meaningful dashboards. This tool specializes in easy report setups without complex setups and steep learning curves.
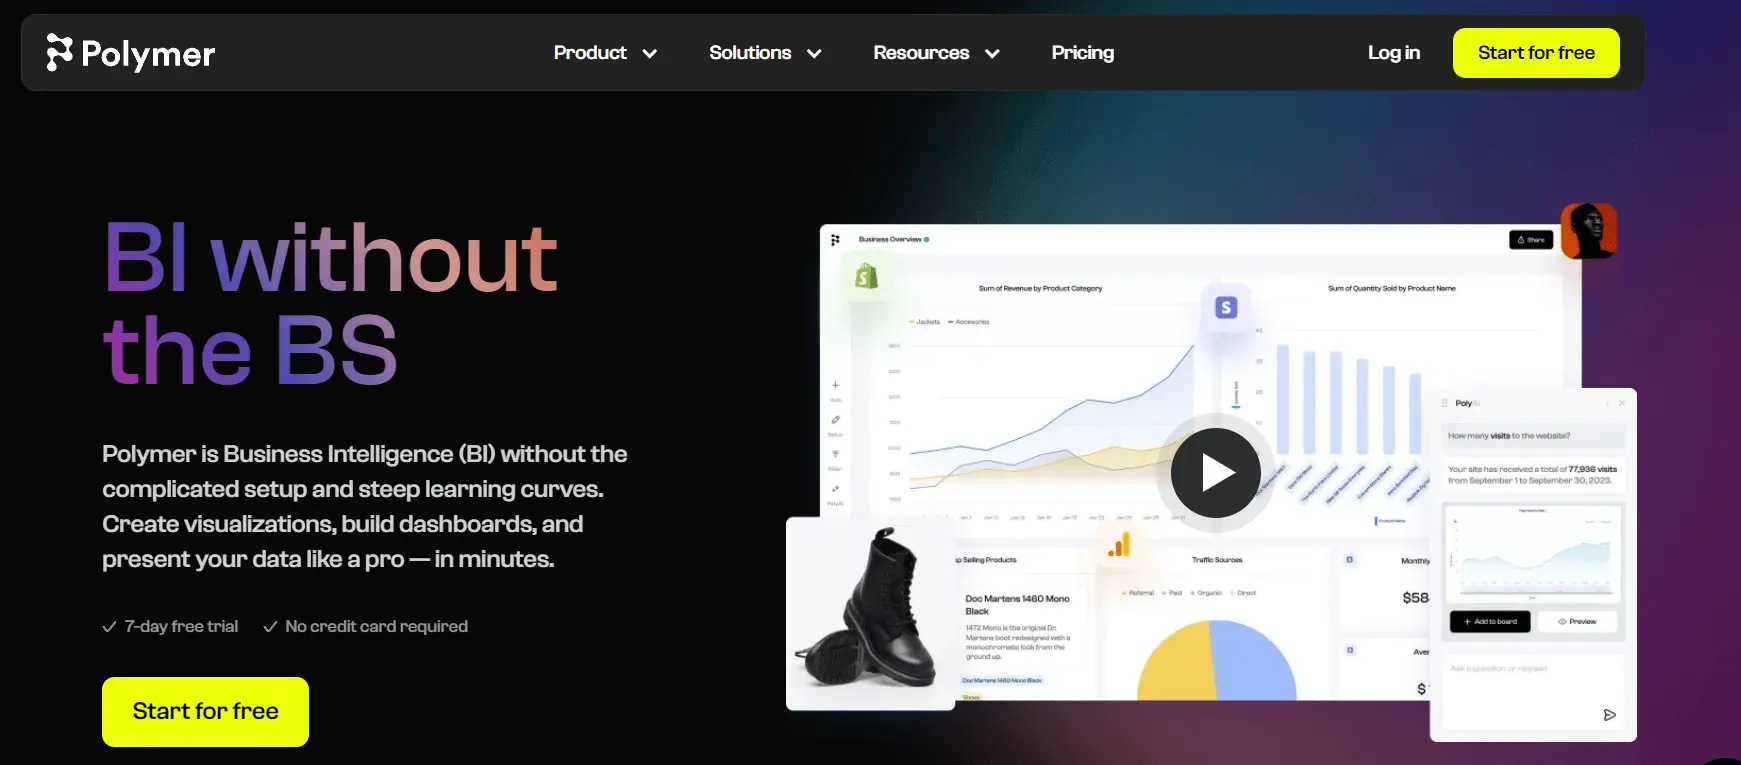
Website screenshot from Polymer, image by author
Target Users
This platform is designed for business users who rely on spreadsheets like Excel and Google Sheets for data analysis. It empowers them to extract deeper insights without extensive coding knowledge.
Strengths
Polymer Search excels at transforming “small data” (spreadsheets) into meaningful insights using AI. It automates data analysis tasks and generates clear visualizations.
Key Features
- AI-powered Insights Engine: Analyze data from various sources like Excel, Google Sheets, and Salesforce. Polymer Search automatically finds patterns and generates insightful reports.
- Interactive Visualizations: Transform your data into clear and compelling charts and graphs, making it easier to understand trends and relationships.
- Data Storytelling: Go beyond raw data. Polymer Search helps you craft data-driven narratives to effectively communicate your findings to stakeholders.
Ease of Use
Polymer offers a user-friendly interface that integrates seamlessly with existing workflows. No coding expertise is required.
Pricing
Polymer Search likely offers a 7-day free trial with several paid plans starting from 50$ per month to 250$ for a team plan.
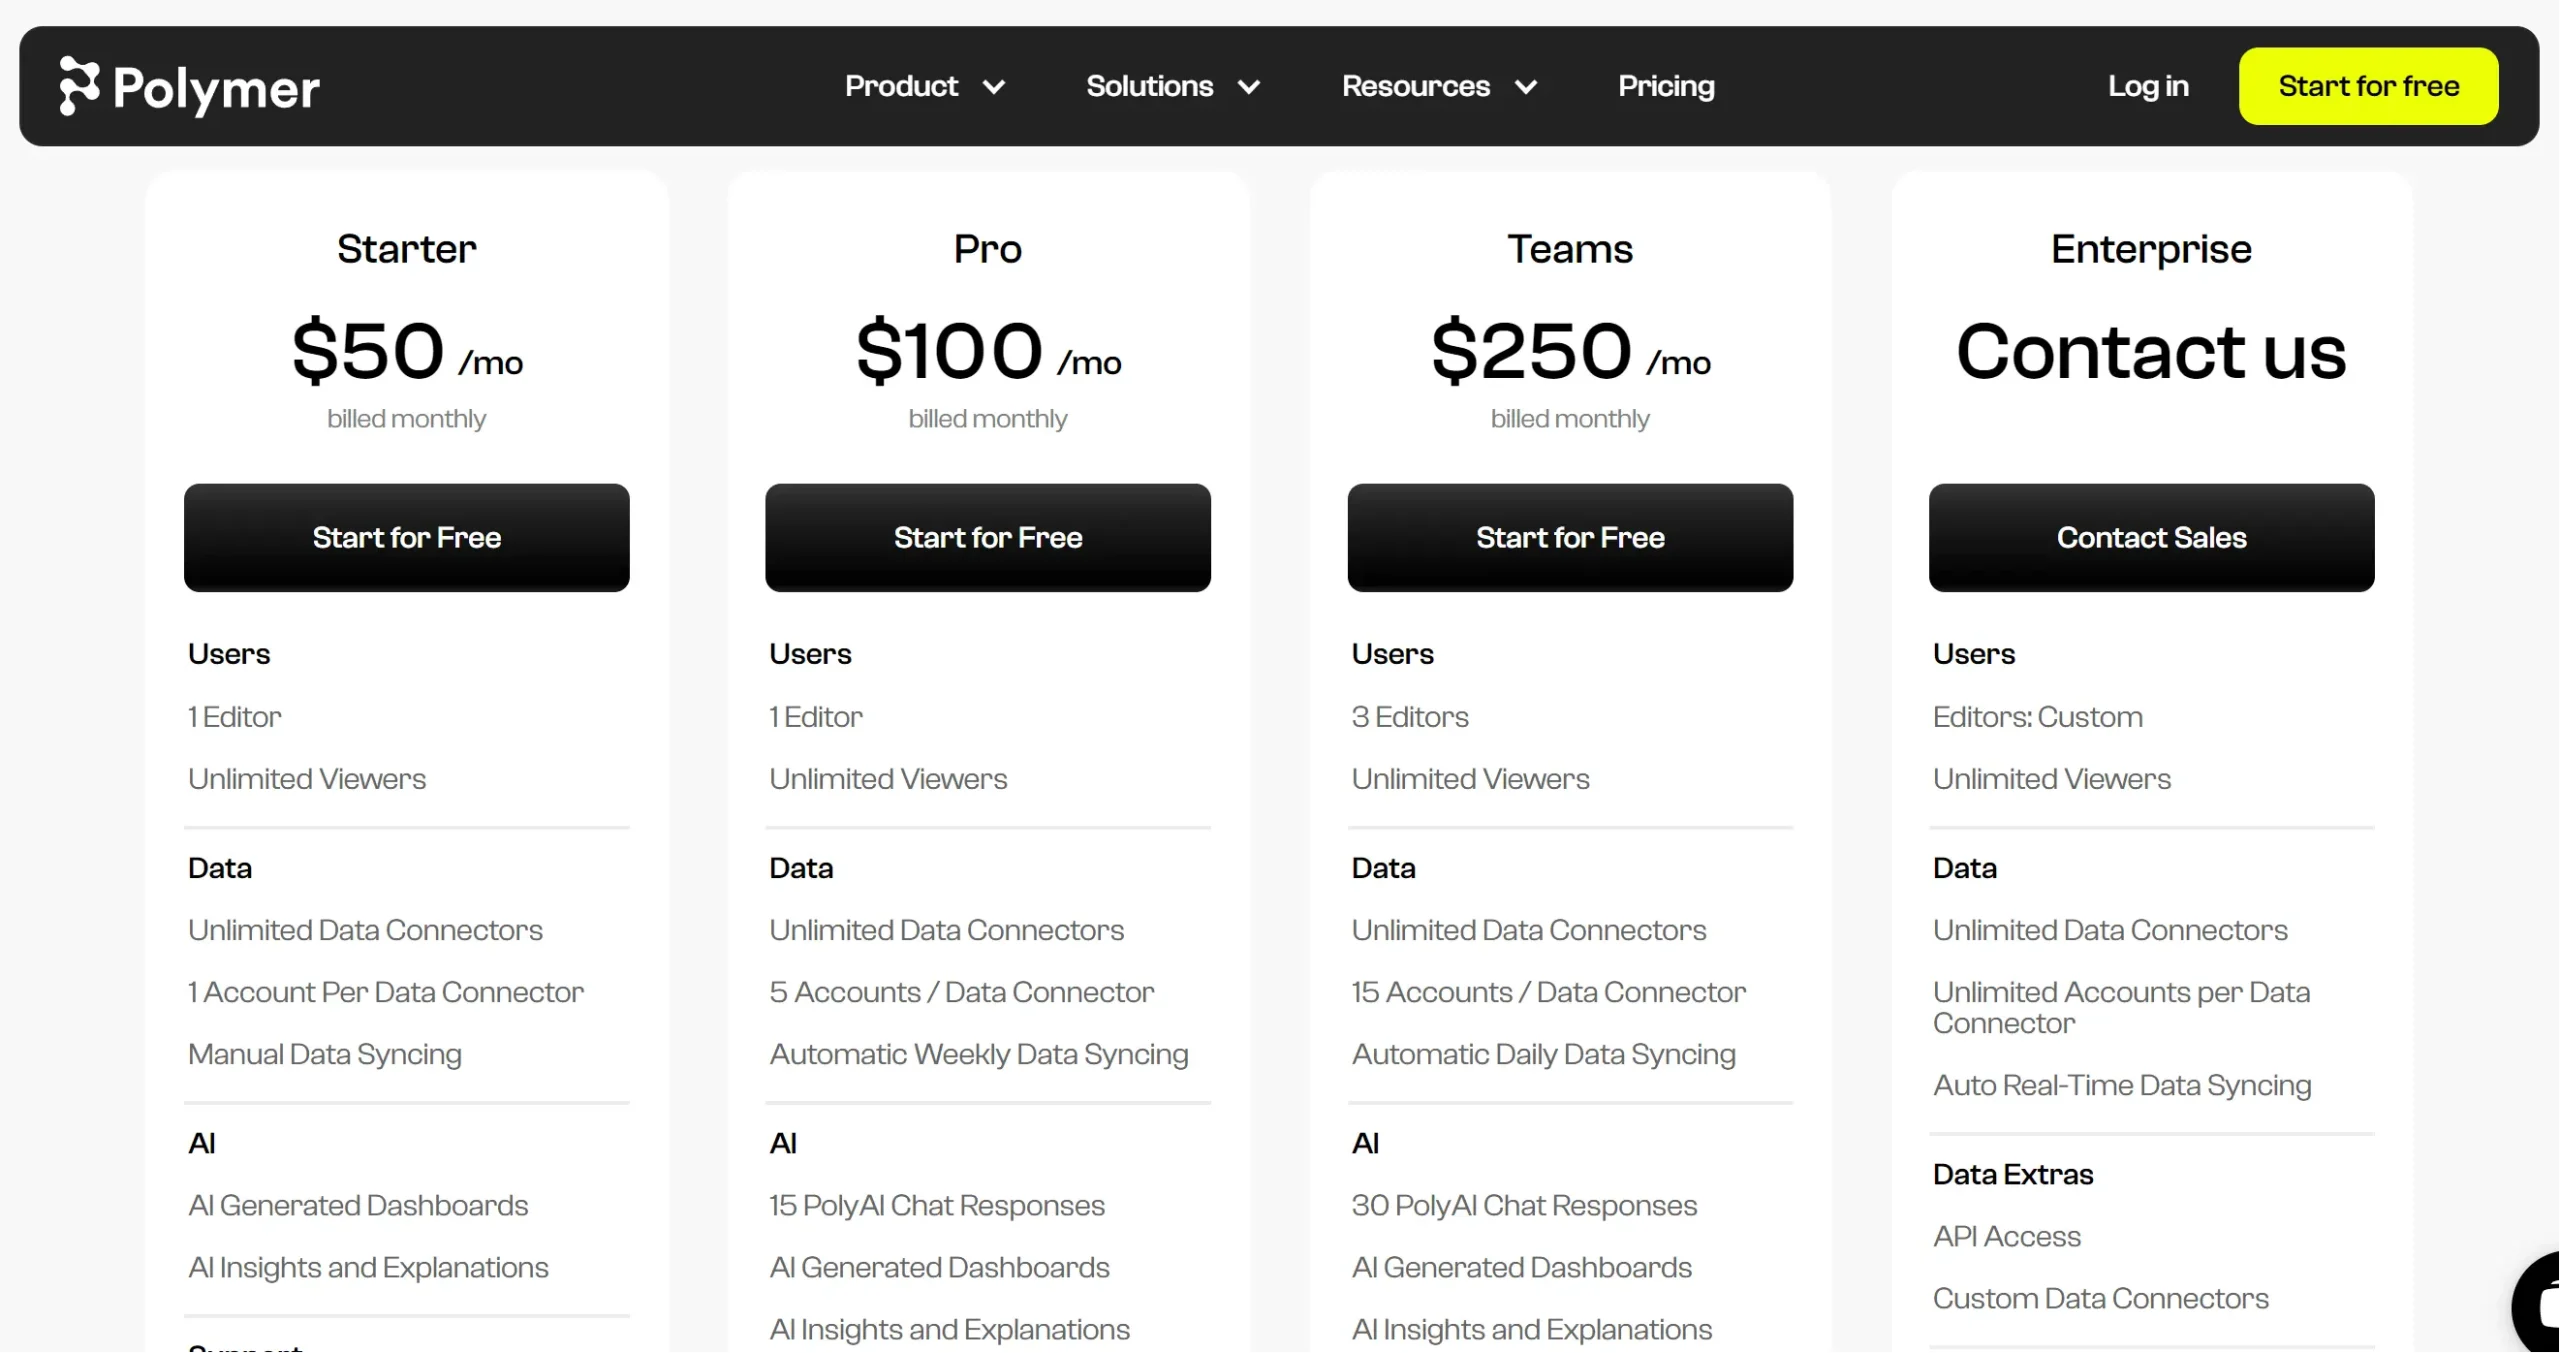
Pricing screenshot from Polymer website, image by author
3. Power BI
Power BI offers a robust suite of tools for data visualization, reporting, and, increasingly, AI-powered functionalities.
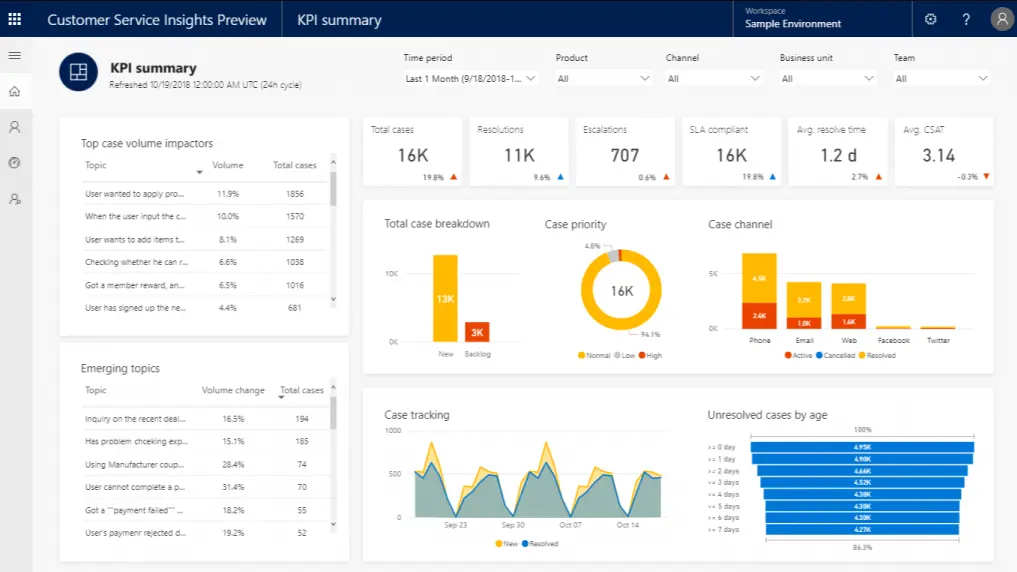
Dashboard example from Power BI website, image by author
Target Users
Power BI caters to users, from business analysts to data scientists. However, beginners might experience a steep learning curve as chart creation requires DAX function knowledge. This platform could be limiting for non-technical users without IT or data analysis knowledge.
Strengths
Power BI shines in its ability to connect to a vast array of data sources and its exceptional data visualization capabilities. AI features further empower users to extract deeper meaning from their data. Check out the detailed pros and cons summary.
Key Features
- AI Insights: Leverage pre-built machine learning models for data cleansing, anomaly detection, and creating intelligent forecasts. No coding is required.
- Q&A Natural Language Search: Ask questions about your data in plain English and receive clear and concise answers with interactive visualizations.
- Smart Narrative Generation: Power BI automatically generates data stories, highlighting key trends and insights for clear communication.
Ease of Use
Power BI offers a user-friendly interface with varying levels of complexity depending on the features used. The basic functionalities are easy to grasp, while advanced features cater to more technical users.
Pricing
Power BI offers a freemium model with limited features. Paid plans cater to individual and enterprise needs starting from 10$ per user a month.
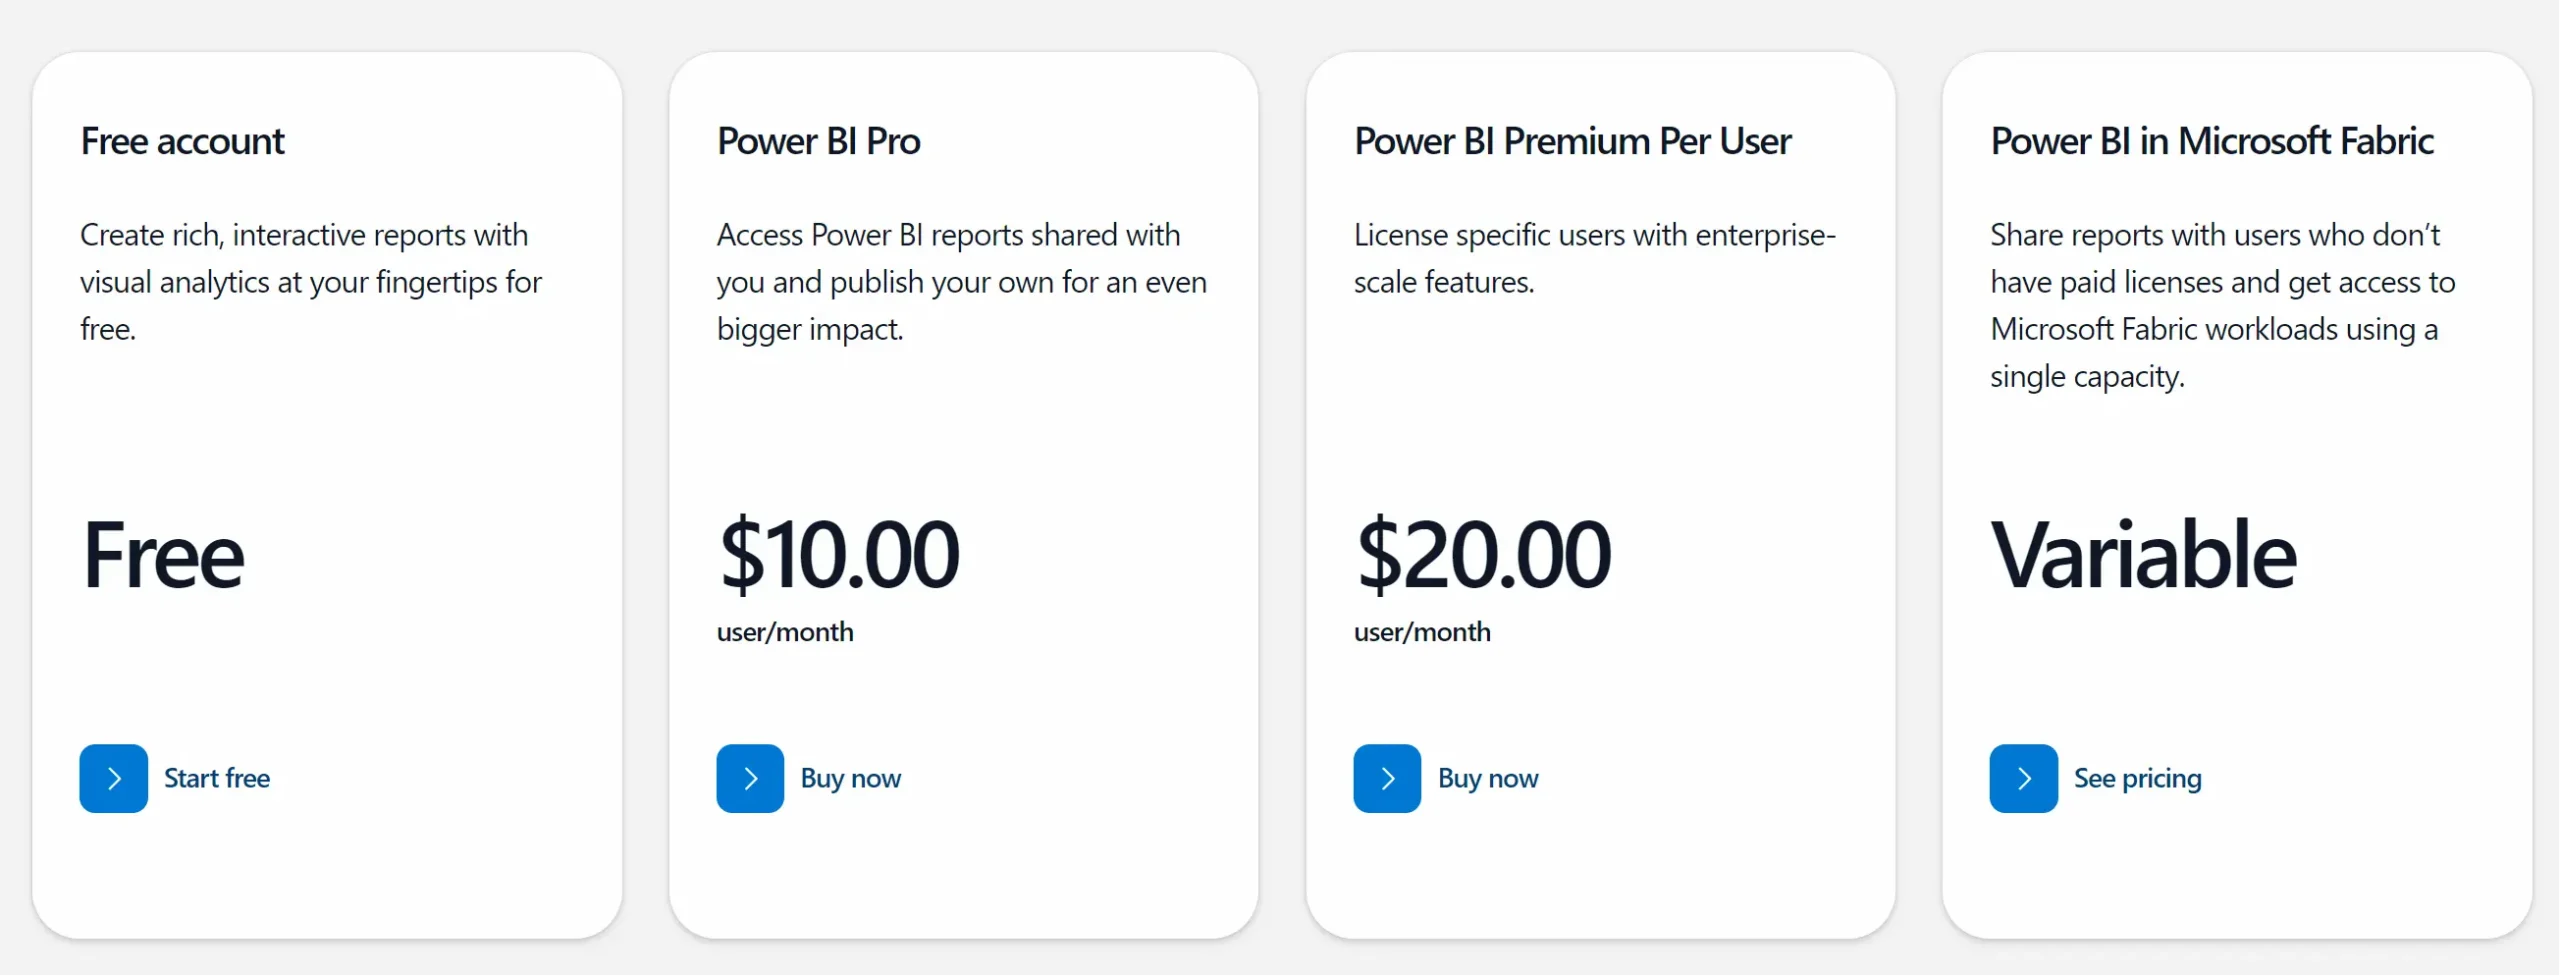
Pricing plan for Power BI, screenshot by author
4. Tableau
Tableau is a widely recognized leader in data visualization, offering tools to create stunning and informative dashboards and reports. Recently, Tableau has incorporated a suite of AI features under the umbrella of Tableau AI, further empowering users to uncover hidden insights.
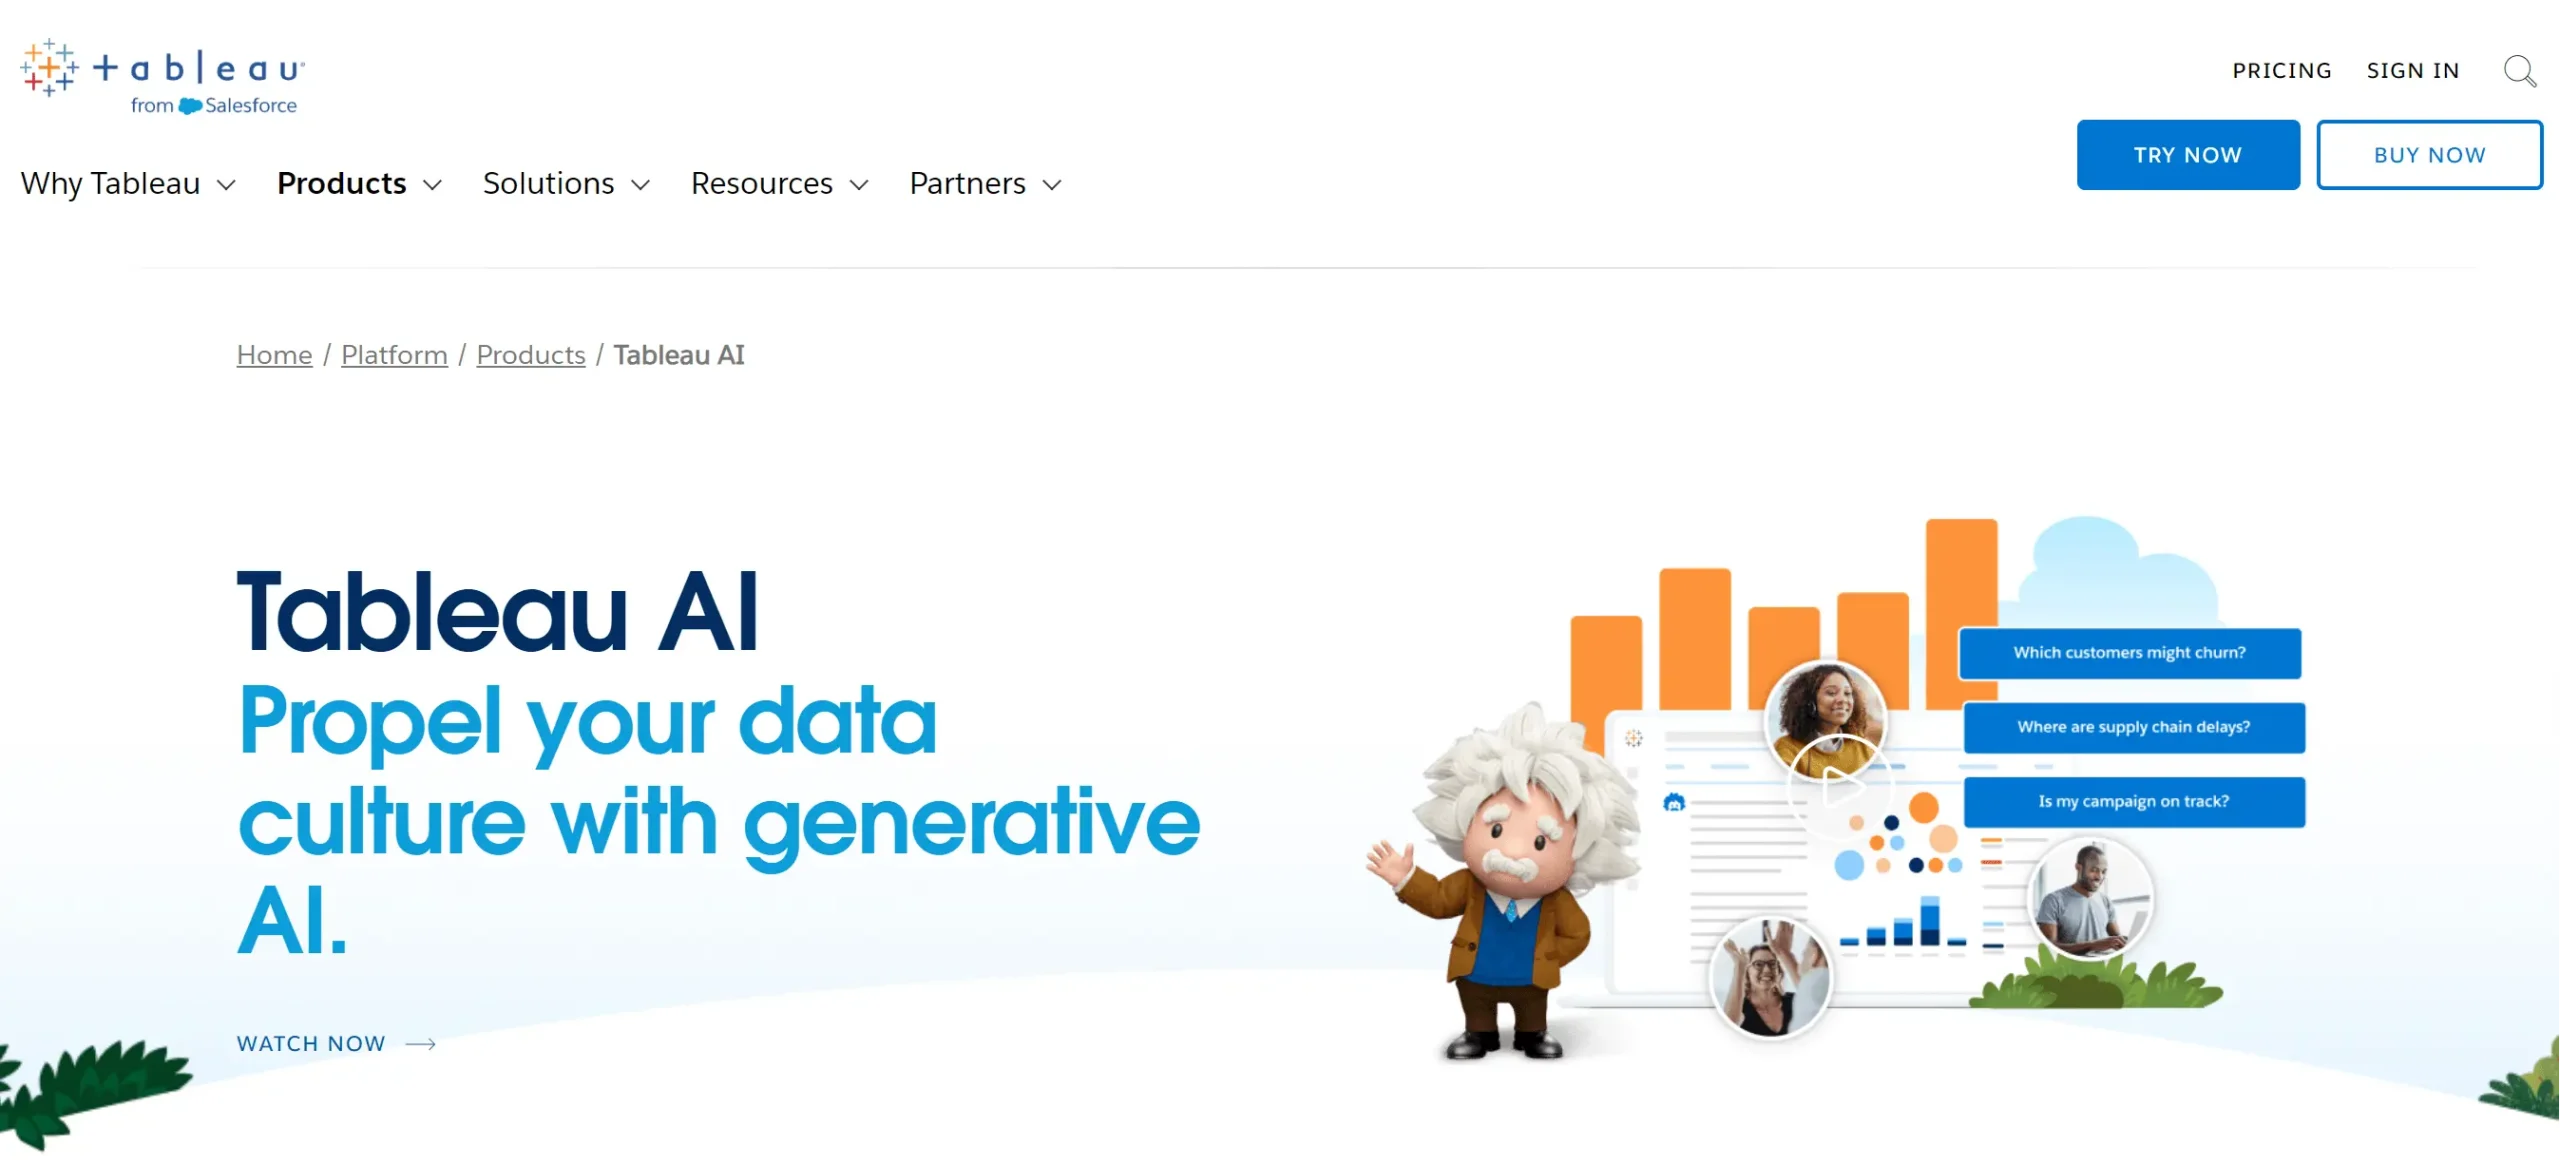
Website screenshot from Tableau website, screenshot by author
Target Users
Tableau is one of the most advanced analytics platforms therefore the usability for non-technical users can be very limiting. This platform is for data scientists and experienced data analytics experts with some IT knowledge. Anyone can start using this platform, however you should consider a steep learning curve.
Strengths
Tableau excels in transforming complex data into clear and compelling visuals. The recent addition of Tableau AI empowers users with intelligent automation and deeper data analysis. Learn a detailed guide about Tableau’s cons & pros.
Key Features
- Ask Data in Context: Leverage natural language to ask questions about your data directly within visualizations. Tableau AI surfaces relevant insights and suggests different ways to explore your data.
- Marks Cards & Explainable AI: Gain a deeper understanding of how AI arrives at its conclusions. Marks Cards provide transparency into the factors influencing specific data points.
- Smart Data Discovery: Tableau AI proactively recommends visualizations and insights based on your data, helping you uncover hidden patterns and trends you might have missed.
Ease of Use
Tableau offers a user-friendly interface with a learning curve that depends on the desired level of complexity. Basic functionalities are easy to grasp, while advanced features cater to experienced users.
Pricing
Tableau offers a freemium model with limited features. Paid plans cater to individual and enterprise needs.
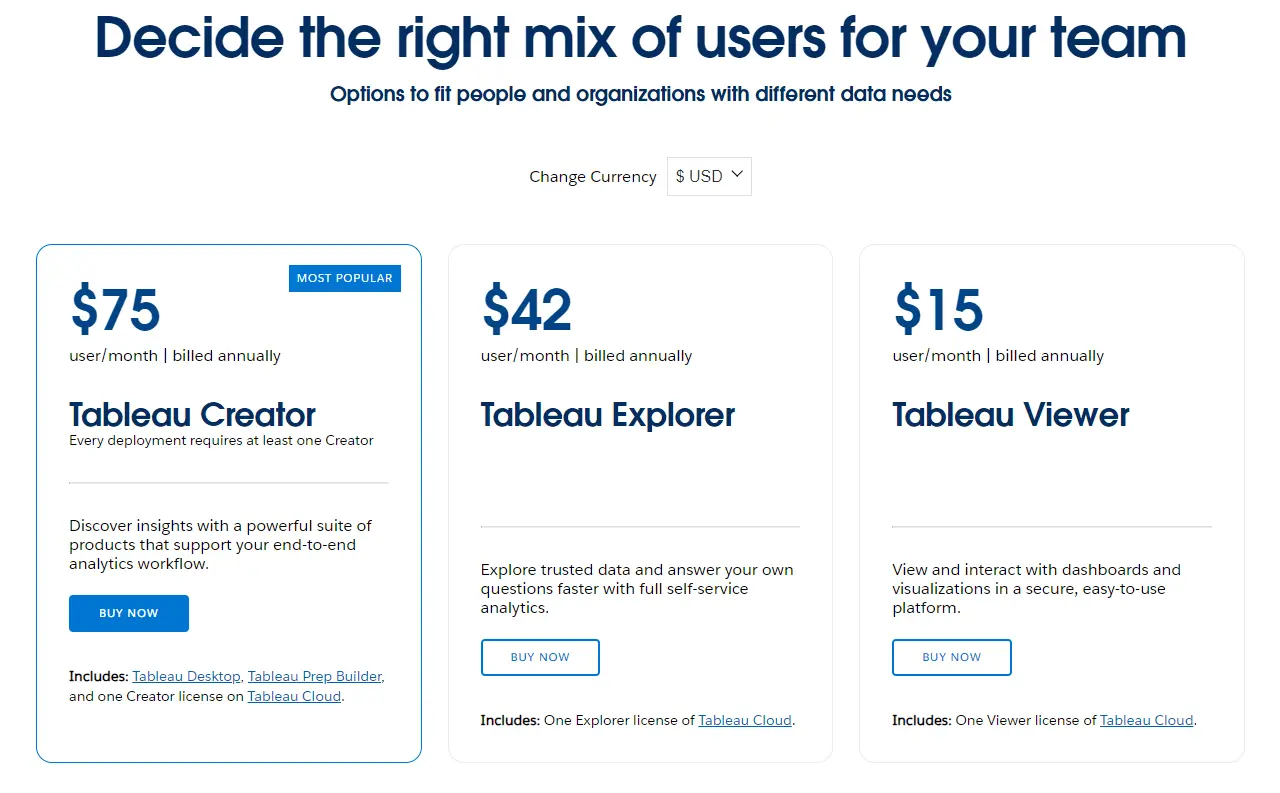
Screenshot with Tableau pricing plans from their website, image by author
5. Akkio
Akkio provides a user-friendly platform that leverages machine learning to automate tasks, identify patterns, and uncover hidden trends within your data. This platform stands apart from other tools as it’s specifically made for agencies and their clients.
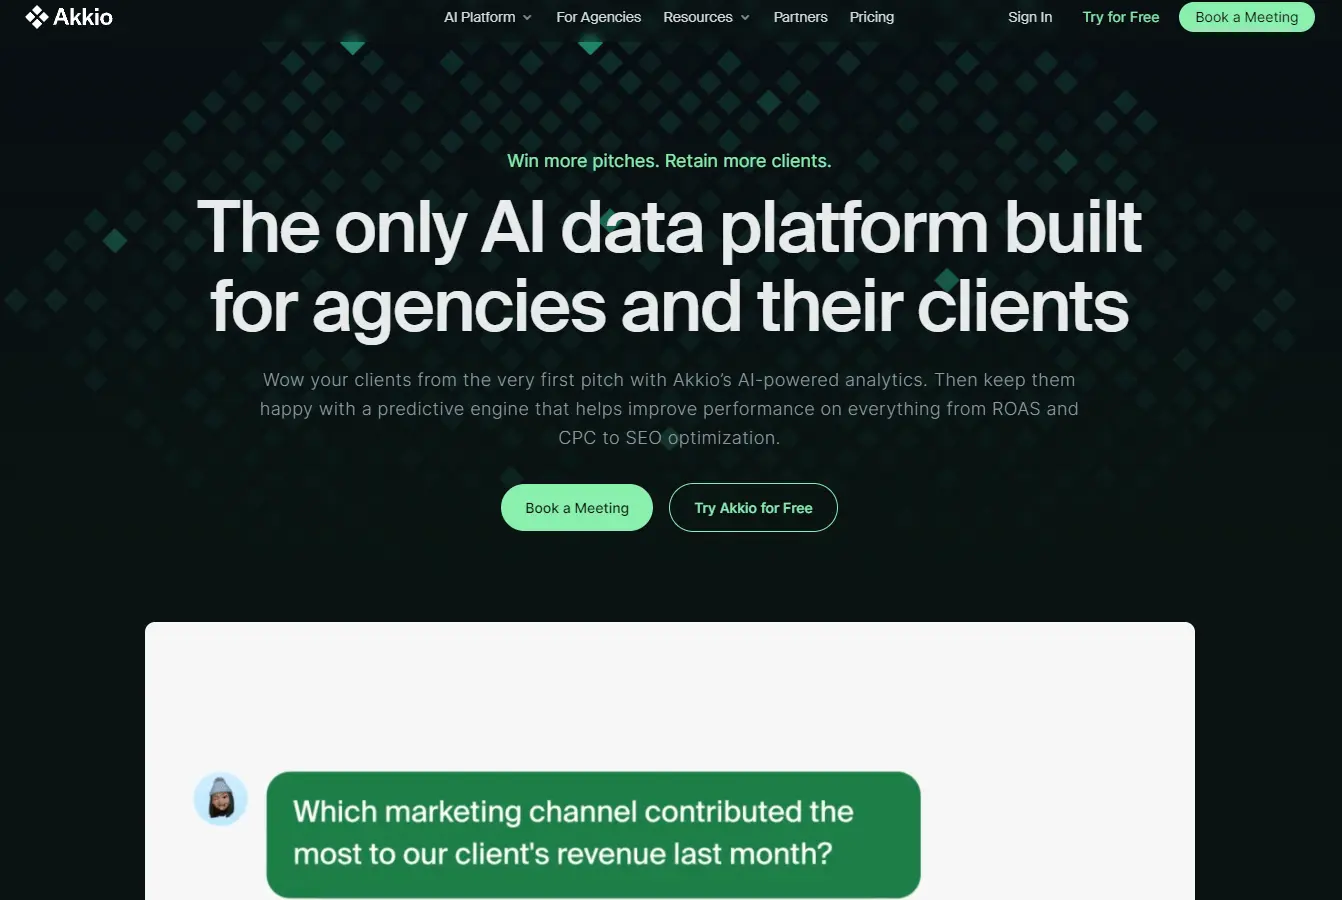
Website screenshot from Akkio website, image by author
Target Users
Akkio empowers marketing professionals, from data analysts to campaign managers. Its user-friendly interface makes it accessible for teams without technical expertise, to explore data with AI.
Strengths
This platform shines in its ability to democratize AI for marketing agencies. The no-code interface removes technical barriers, while the machine learning engine helps uncover hidden patterns that traditional methods might miss.
Key AI Functionalities
- Predictive Modeling: Forecast future campaign performance.
- Anomaly Detection: Identify unexpected trends and data outliers that might indicate potential issues or opportunities.
- Automated Data Cleaning & Preparation: Free yourself from tedious data wrangling and focus on uncovering insights.
- Natural Language Processing: Ask questions about your data in plain English and receive clear, informative visualizations.
Ease of Use
Akkio prioritizes user-friendliness. The no-code interface allows anyone to get started quickly, while the intuitive dashboards and visualizations make it easy to understand complex data.
Pricing
Akkio offers a freemium model with limited functionality. Paid plans cater to individual and agency needs, offering a range of features and data processing capabilities. Starting from 49$ per user a month to 99$.
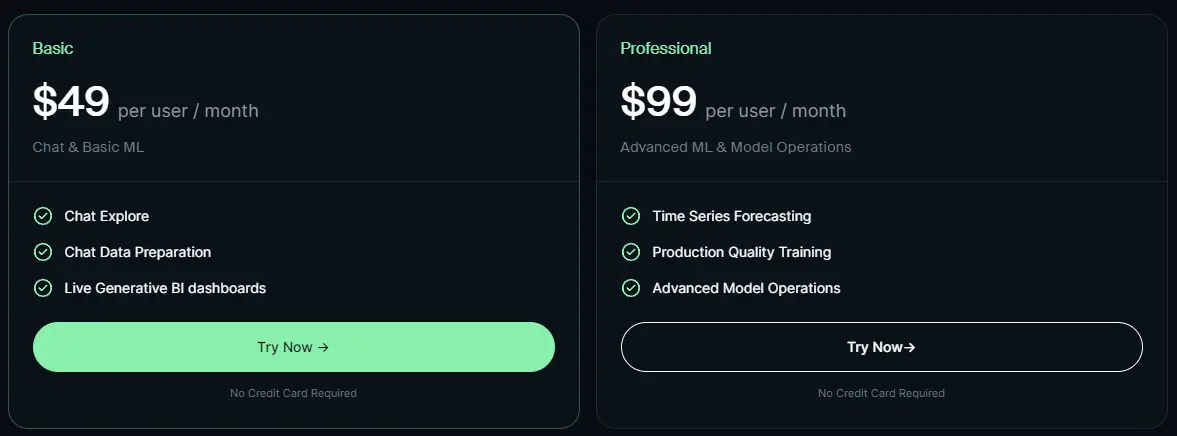
Platform pricing from Akkio website, screenshot by author
6. Luzmo
Luzmo provides an AI-powered platform that integrates, user-friendly dashboards directly within your SaaS application. The platform leverages machine learning to automate data analysis, identify trends, and surface insights without requiring users to be data experts.
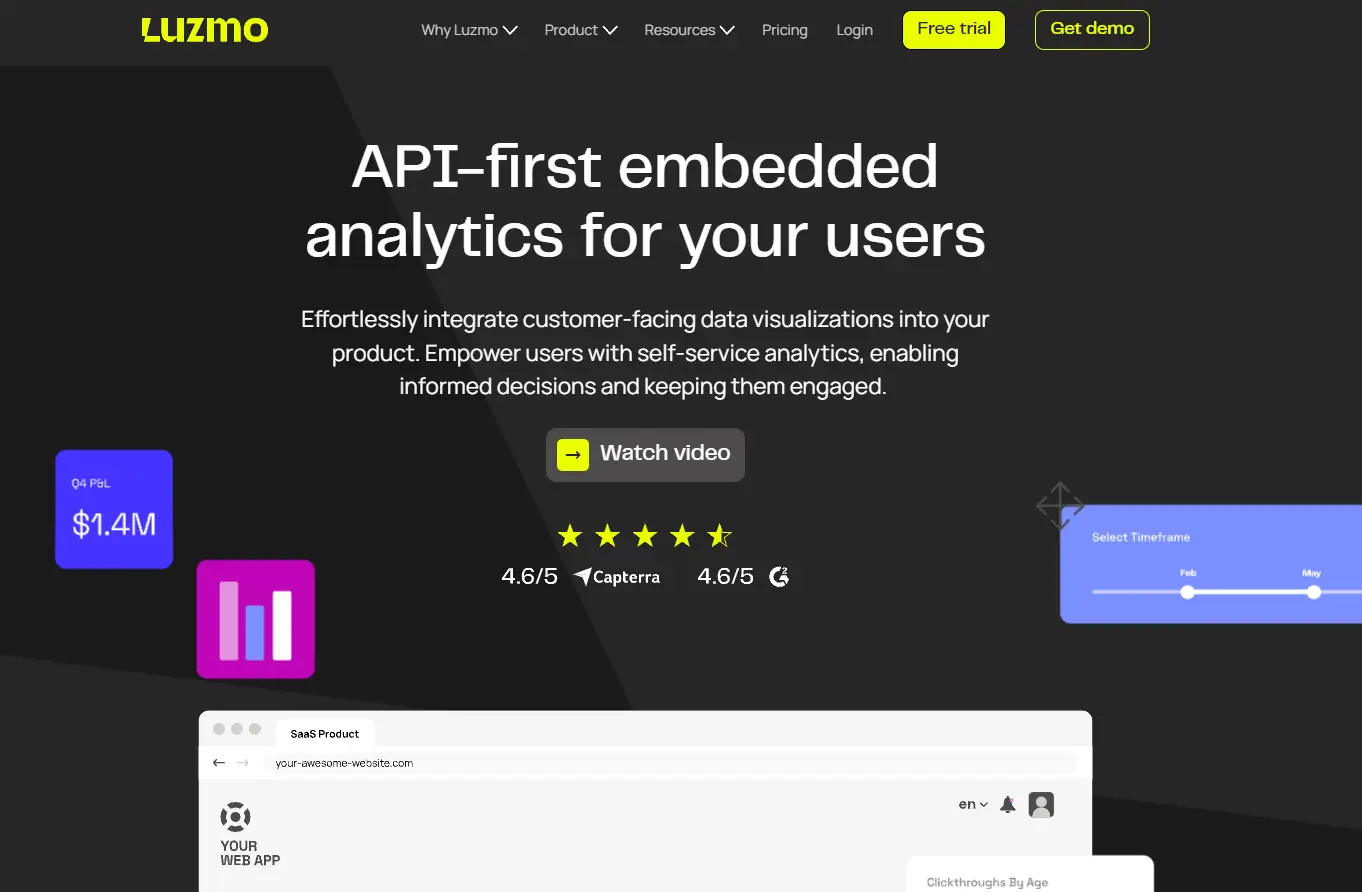
Website screenshot from Luzmo, image by author
Target Users
Luzmo empowers a wide range of users within your SaaS product ecosystem. From product managers gleaning usage insights to sales teams leveraging customer data, Luzmo caters to both technical and non-technical users.
Strengths
The AI-powered platform automates tasks, translates data into clear visuals, and empowers users to ask questions in plain English. This fosters user adoption of data insights and ultimately drives product engagement and value realization for your SaaS offering.
Key Features
- Automated Data Analysis & Anomaly Detection: Luzmo utilizes machine learning to identify trends, patterns, and outliers within the data.
- Natural Language Query: Users can ask questions about their data in plain English, receiving clear and concise visualizations.
- Customizable Dashboards: Tailor dashboards to user roles and needs, ensuring users see the most relevant and actionable data insights.
- Seamless Integration: Luzmo integrates seamlessly within your existing SaaS application, providing a unified user experience for data exploration.
Ease of Use
The no-code interface and natural language capabilities allow anyone to start exploring data instantly. Furthermore, customizable dashboards cater to specific user needs and priorities.
Pricing
Luzmo offers various pricing plans to suit the needs of different SaaS product types and user volumes. Before purchasing you can try the platform for free.
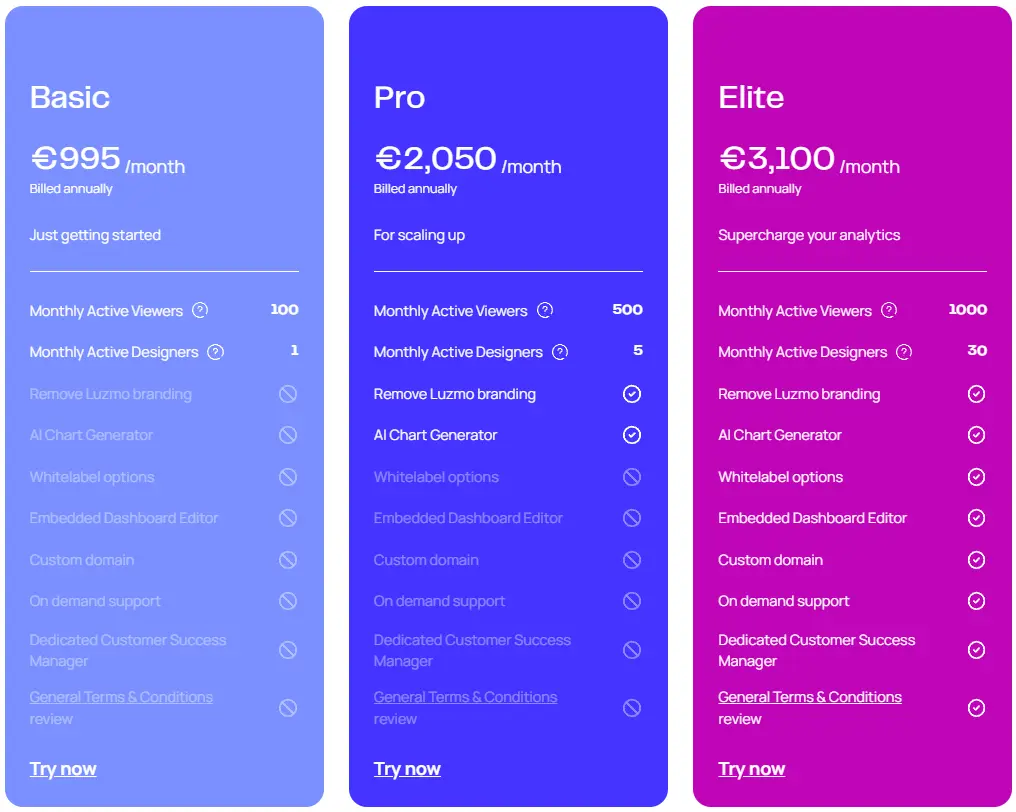
Luzmo pricing plans screenshot from their website, image by author
7. Zoho Analytics
Zoho Analytics provides intuitive dashboards, drag-and-drop report building, and a powerful AI assistant named Zia. Zia leverages natural language processing (NLP) to help with data exploration.
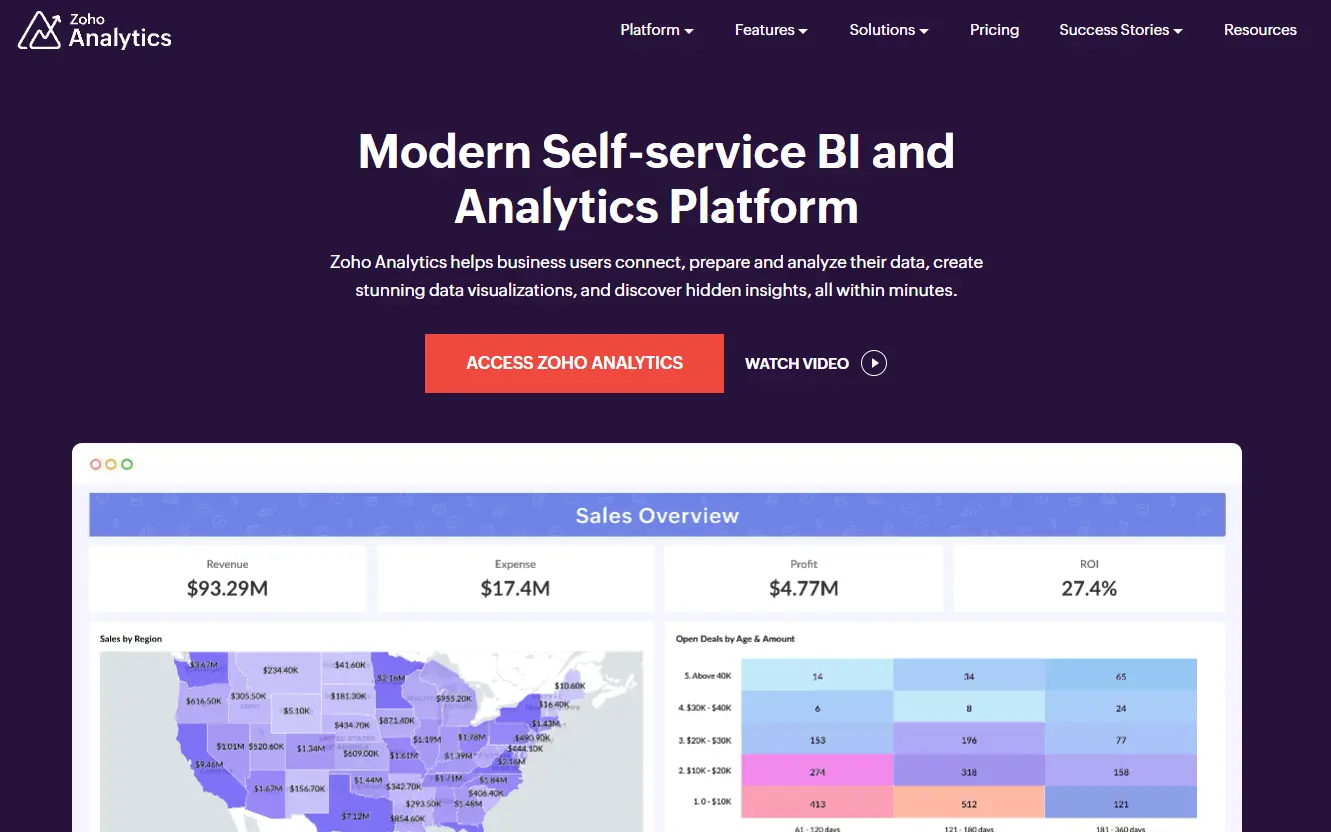
Website screenshot from Zoho Analytics, image by author
Target Users
Zoho Analytics caters to a broad audience, from data analysts and business users to non-technical stakeholders. The intuitive interface and drag-and-drop functionalities make it easy for beginners to get started.
Strengths
The combination of user-friendly tools, self-service analytics, and AI-powered insights makes it easy for everyone to leverage the power of data regardless of technical expertise. Zoho Analytics offers a cost-effective solution compared to some competitors.
Key AI Features
- Ask Zia in Plain English: Uncover insights and ask questions about your data using natural language.
- Smart Data Discovery: Zia proactively surfaces recommendations, visualizations, and insights based on your data.
- AI-Powered Predictions: Leverage machine learning to forecast future trends and make data-driven decisions.
- Automated Insights & Anomaly Detection: Zia automatically identifies anomalies, suggests explanations, and delivers actionable insights.
Ease of Use
The drag-and-drop interface and intuitive functionalities make it easy to get started, while extensive resources and tutorials are available for those seeking deeper exploration. Some users can experience learning curve.
Pricing
Zoho Analytics offers a freemium plan with limited features, perfect for individual users or small teams. Paid plans cater to businesses of all sizes, prices starting from 30EUR per month.
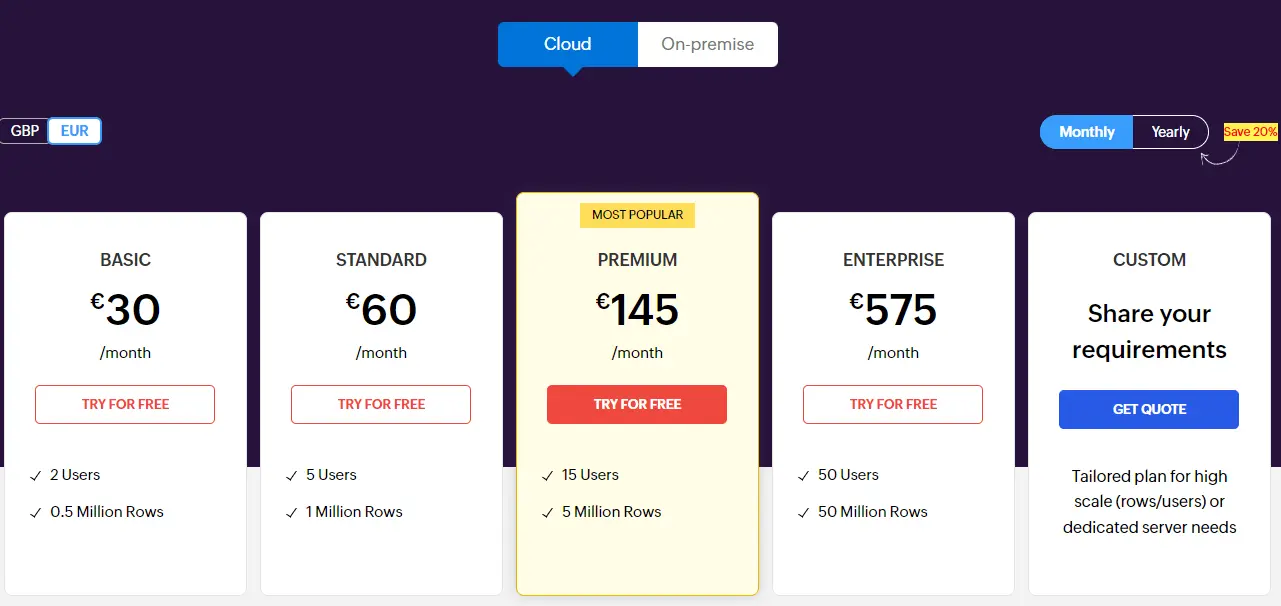
Screenshot with pricing plans from Zoho Analytics website, image by author
Conclusion
AI data analysis is the process of using artificial intelligence techniques to extract insights from large and complex datasets. It automates tasks, finds hidden patterns, and generates conclusions that would be difficult or impossible for traditional methods.
Businesses are using AI to optimize processes, gain deeper customer insights, and make data-driven decisions. To stay on top of the industry and competitors organization should use AI to achieve higher efficiency.
We encourge users to try different AI for analysis tasks and see how it can help in daily operations.
FAQ
AI-powered data analysis leverages machine learning and other artificial intelligence techniques to automate tasks, identify patterns, and uncover hidden insights within your data.
There are 7 tools that can help with data analysis Ajelix, Tableau, Polymer, Power BI, Zoho Analytics, Luzmo, and Akkio.
Ready to try Ajelix AI agent for Data Analysis?
From data to report in one minute or less with Ajelix AI Agents


