Generative AI For Data Analytics: What You’re Missing Out
Organizations across all industries are turning to data analytics to inform strategic decisions, optimize processes, and gain a competitive edge. But what happens when the data itself becomes a hurdle?
Limited datasets, time-consuming manual tasks, and hidden patterns within complex data can all act as bottlenecks, hindering the full potential of data analytics.
Gartner predicts that by 2026 more than 80% of enterprises will have used or deployed generative AI or APIs. Generative AI changes how organizations approach data analysis by helping ease tasks and changing data exploration and discovery.
Change the way you work with agentic AI
One-click dashboards,KPI tracking, and AI-powered insights—for work that actually gets done.

What is Generative AI?
Generative AI, or generative artificial intelligence, is a branch of AI that focuses on creating entirely new content. This content can come in many forms, like text, images, music, and videos.
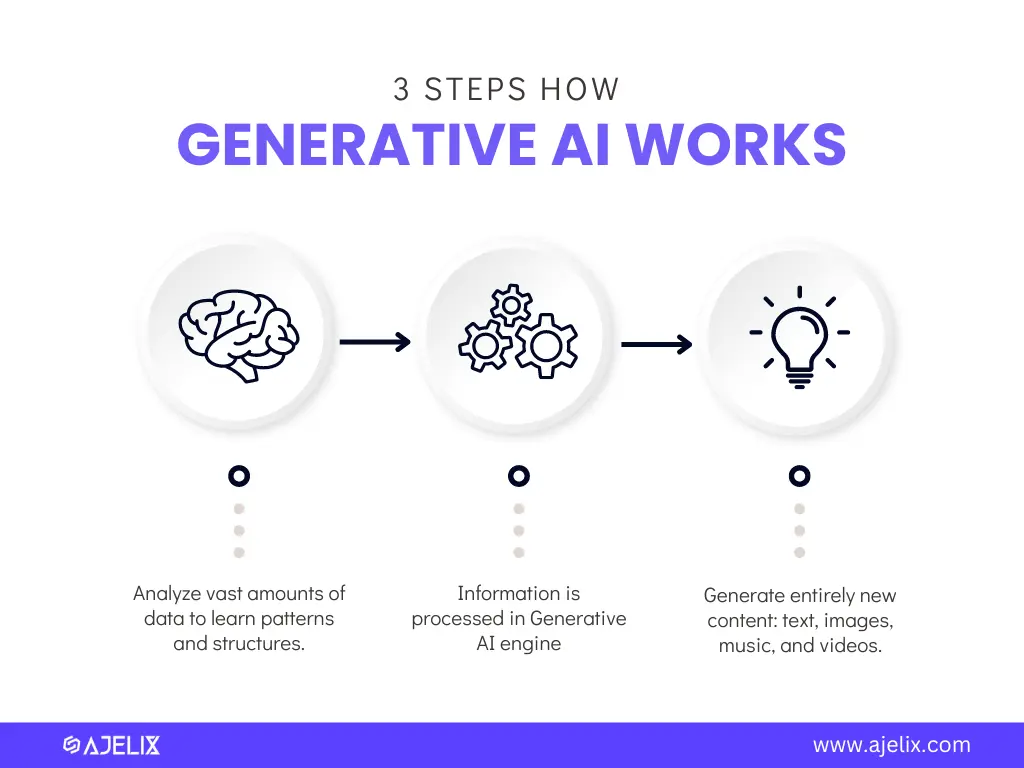
3 steps on how generative AI works, infographic by author
Generative AI examples:
- Think of it as creative AI: Generative AI models, such as AI video maker tools, are trained on massive amounts of existing data. They learn the patterns and structures within this data and use that knowledge to generate new things that resemble the data they were trained on.
- New isn’t always identical: The cool thing is, generative AI isn’t just copying and pasting. It’s like a creative remix machine. It uses its understanding of the data to produce new original content that relates to what it learned.
- Examples all around us: Generative AI is already being used in a surprising number of ways. For instance, it can create new product designs, write creative text formats, and compose music. According to an MIT Technology Review, AI can even turn people’s memories into pictures.
How Generative AI For Data Analytics Work?
Generative AI is becoming a game-changer in data analytics by offering new ways to analyze data and overcome limitations. Here are a few ways how it works:
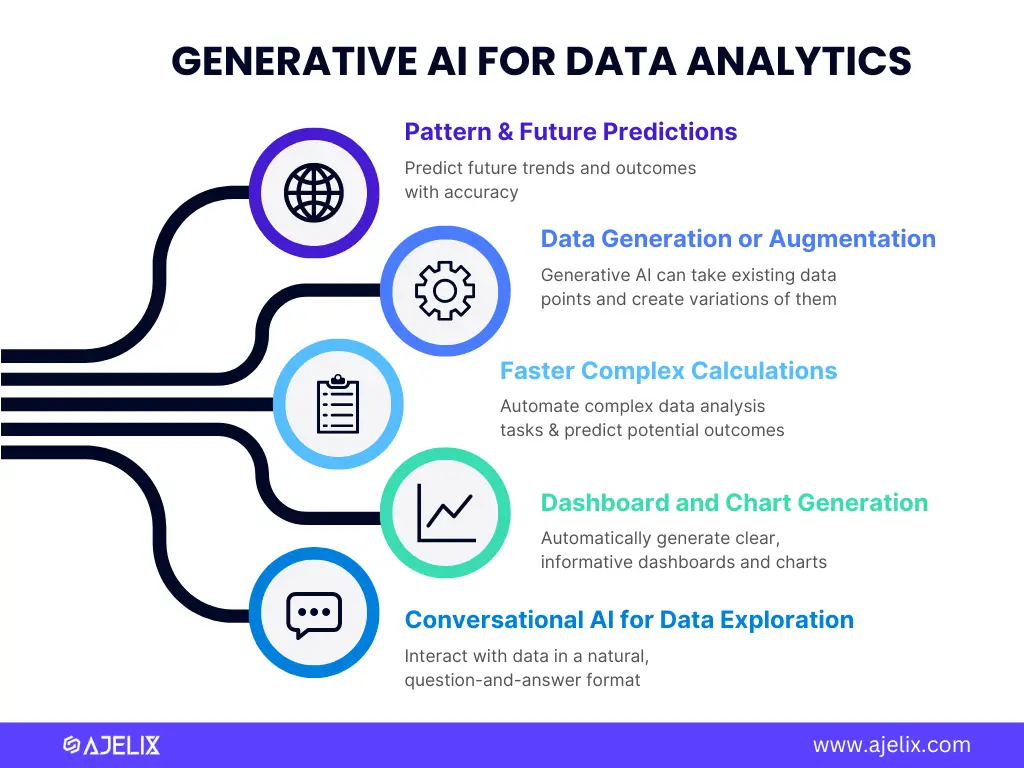
5 ways how to use generative AI for data analytics tasks, infographic by author
1. Pattern Powerhouse & Future Predictions
Generative AI excels at finding patterns in data. It chews through massive datasets, uncovering hidden structures and relationships. It allows generative AI to predict future trends and outcomes with surprising accuracy for any business needs.
2. Data Generation: Breaking Through Barriers
Instead of creating entirely new data, generative AI can also take existing data points and create variations of them. This is called data augmentation. By exposing machine learning models to a wider range of scenarios (thanks to these variations), it helps them become more robust and effective.
3. Faster Complex Calculations
Faster & More Complex Calculations: Generative AI can automate complex data analysis tasks, significantly reducing processing time. This typically requires access to powerful GPU resources, and comparing cloud GPU pricing can help businesses choose cost-effective infrastructure to support these workloads. This frees up data analysts to delve deeper into the data and explore intricate relationships they might have missed.
Simulating the Future: Scenario Planning Generative AI can simulate various scenarios and predict potential outcomes. This is a game-changer for businesses, allowing them to test different marketing strategies or product concepts before real-world implementation. For example, using AI for social media engagement allows brands to adjust their strategies and create stronger connections with their audience.
4. Automatic Dashboard and Chart Generation
Automatic Dashboards: Generative AI can analyze data and automatically generate clear, informative dashboards and charts. This saves data analysts precious time and ensures consistency in data visualization.
Tailored Insights at a Glance: Generative AI can personalize dashboards and charts based on user preferences or specific areas of interest. Allowing users to quickly grasp the most relevant insights without wading through mountains of data. This is also what Ajelix provides, you can check it out here.
Real-time Updates, Always in the Loop: Generative AI can make charts create dashboards and charts that update automatically as new data becomes available.
5. Conversational AI for Data Exploration
Ask Your Data Anything: Generative AI can power conversational interfaces that allow users to interact with data in a natural, question-and-answer format. Furthermore, LLM red teaming can be applied to ensure these conversational AI systems are robust against biased or misleading responses, improving trustworthiness. This makes data exploration more accessible, even for those without extensive data analysis experience.
Uncover Hidden Gems: By using natural language processing, generative AI can understand complex questions and identify relevant data points that might be overlooked in traditional analysis methods.
Democratizing Data Insights: Conversational AI empowers a wider range of people within an organization to access and understand data, fostering a more data-driven culture.
The Data Analytics Challenge
Data analytics holds immense power for organizations, but unlocking that power comes with its own set of hurdles. Here, we’ll delve into three of the most common challenges data analysts face:
1. Data Scarcity: The Quest for More
- Limited Datasets: Often, the data readily available isn’t enough for comprehensive analysis. Datasets might be incomplete or lack the specific variables needed to answer critical questions.
- Privacy Concerns: Data privacy regulations can restrict access to certain datasets, hindering the scope and depth of analysis.
- Data Silos: Data may be scattered across different departments or systems within an organization, making it difficult to gather and consolidate for analysis.
2. The Manual Marathon: Time vs. Insights
- Repetitive Tasks: Data analysts often spend a significant amount of time on repetitive tasks like data cleaning, formatting, and preparation. This cuts into the time available for actual analysis and uncovering insights.
- Complex Calculations: Certain data analysis tasks involve intricate calculations that can be time-consuming and error-prone when done manually.
3. Finding the Needle in the Data Haystack: Pattern Blind Spots
- Hidden Relationships: Large and complex datasets can obscure underlying patterns and relationships that hold valuable insights. Traditional analysis methods might not be sophisticated enough to reveal these hidden gems.
- Data Bias: Biases within the data itself can skew results and lead to misleading conclusions. Identifying and mitigating these biases can be a significant challenge.
The Widening Gap: Need vs. Availability
These challenges are further compounded by a widening gap between the ever-growing demand for data analysis and the limited pool of highly skilled data analysts available. This creates a bottleneck, hindering organizations from fully capitalizing on the potential of their data. Source: Northeastern University
Making Data Analytics Accessible
There’s a critical need to make data analytics tasks easier and more accessible. This not only frees up data analysts to focus on higher-level analysis but also empowers non-technical teams to leverage the power of data within their roles. Generative AI, with its ability to automate tasks and generate insights, is emerging as a game-changer in bridging this gap. Platforms like Skale’s Generative Engine Optimization services extend these benefits even further by turning data insights into scalable, optimized content that drives visibility and growth.
Applications of Generative AI in Data Analytics
The power of generative AI in data analytics isn’t just theoretical. It’s already making waves across various industries, transforming how organizations approach data analysis and extract valuable insights. Here are a few compelling examples:
Finance: Charting the Course to Financial Success
- Predicting Market Trends: Financial institutions are leveraging GAI to analyze vast amounts of financial data, including historical trends, news sentiment, and social media chatter. This allows them to generate more accurate predictions about future market movements, informing investment strategies and mitigating risks.
- Optimizing Investment Portfolios: GAI can be used to create personalized investment recommendations based on an individual’s risk tolerance and financial goals. By analyzing vast datasets of financial instruments, GAI can identify potential investments that align with a user’s specific profile.
Healthcare: Personalized Medicine and Expedited Drug Discovery
- Personalized Medicine: The healthcare industry is embracing GAI to create personalized treatment plans for patients. By analyzing a patient’s medical history, genetic data, and lifestyle factors, GAI can predict how they might respond to different treatments, paving the way for more personalized healthcare solutions.
- Drug Discovery on Fast Forward: The traditional drug discovery process is often lengthy and expensive. GAI is accelerating this process by analyzing vast molecular datasets and identifying potential drug candidates with higher accuracy. This can significantly reduce the time and resources needed to bring new life-saving drugs to market.
Retail: Tailoring the Shopping Experience
- Customer Segmentation: Retailers are using GAI to segment their customer base into distinct groups with similar characteristics and buying behaviors. This allows for targeted marketing campaigns that resonate more effectively with each customer segment, leading to increased sales and customer satisfaction.
- Predictive Inventory Management: GAI can analyze past sales data and customer trends to predict future demand for specific products. This empowers retailers to optimize their inventory levels, preventing stockouts and minimizing the risk of holding excess inventory that could lead to losses.
Manufacturing: Keeping the Wheels Turning
- Predictive Maintenance: Imagine being able to predict when a machine is likely to fail before it actually happens! GAI is making this possible in the manufacturing sector. By analyzing sensor data from machines, GAI can identify anomalies and predict potential equipment failures. This allows for proactive maintenance, minimizing downtime, and ensuring smooth production processes.
- Optimizing Production Processes: GAI can analyze historical production data and identify areas for improvement. This allows manufacturers to optimize their production processes, leading to increased efficiency and cost savings.
These are just a few examples of how generative AI is revolutionizing data analytics across various industries. As GAI technology continues to evolve, we can expect even more innovative applications to emerge, pushing the boundaries of what’s possible in the exciting world of data-driven decision-making.
Conclusion
The landscape of data analytics is undergoing a significant transformation. The challenges that once hindered progress – limited data, time-consuming tasks, and hidden patterns – are being tackled head-on by the innovative power of generative AI (GAI).
From data to report in one minute or less with Ajelix AI Agents


