Data Analytics For Manufacturing Industry Best Examples

Imagine a factory floor humming with not just the whir of machines, but with the quiet hum of data. Sensors embedded in robots whisper tales of their health, production lines transmit whispers of efficiency, and customer feedback echoes through the digital landscape. 💻
This isn’t science fiction, it’s the reality of modern manufacturing, where data analytics is the new production line.
For manufacturers navigating today’s competitive landscape, the challenges are real: rising costs, complex global supply chains, and ever-demanding customer expectations.
These pressures squeeze margins and threaten growth. But within the seemingly overwhelming data deluge lies the answer: powerful insights, waiting to be unlocked by the magic of data analytics.
Change the way you work with agentic AI
One-click dashboards,KPI tracking, and AI-powered insights—for work that actually gets done.

How do manufacturers use analytics?
- Predict equipment failures before they happen, preventing costly downtime.
- Ensure consistent product quality by catching defects before they leave the factory.
- Optimize their supply chains, ensuring the right parts are in the right place at the right time.
- Forecast demand with laser precision, avoiding stockouts and overproduction.
- Develop innovative products tailored to their customers’ exact needs.
Get ready to witness the transformation of the factory floor, where data is no longer just a byproduct, but the fuel for success. Buckle up, and let’s dive into the world of data-driven manufacturing!
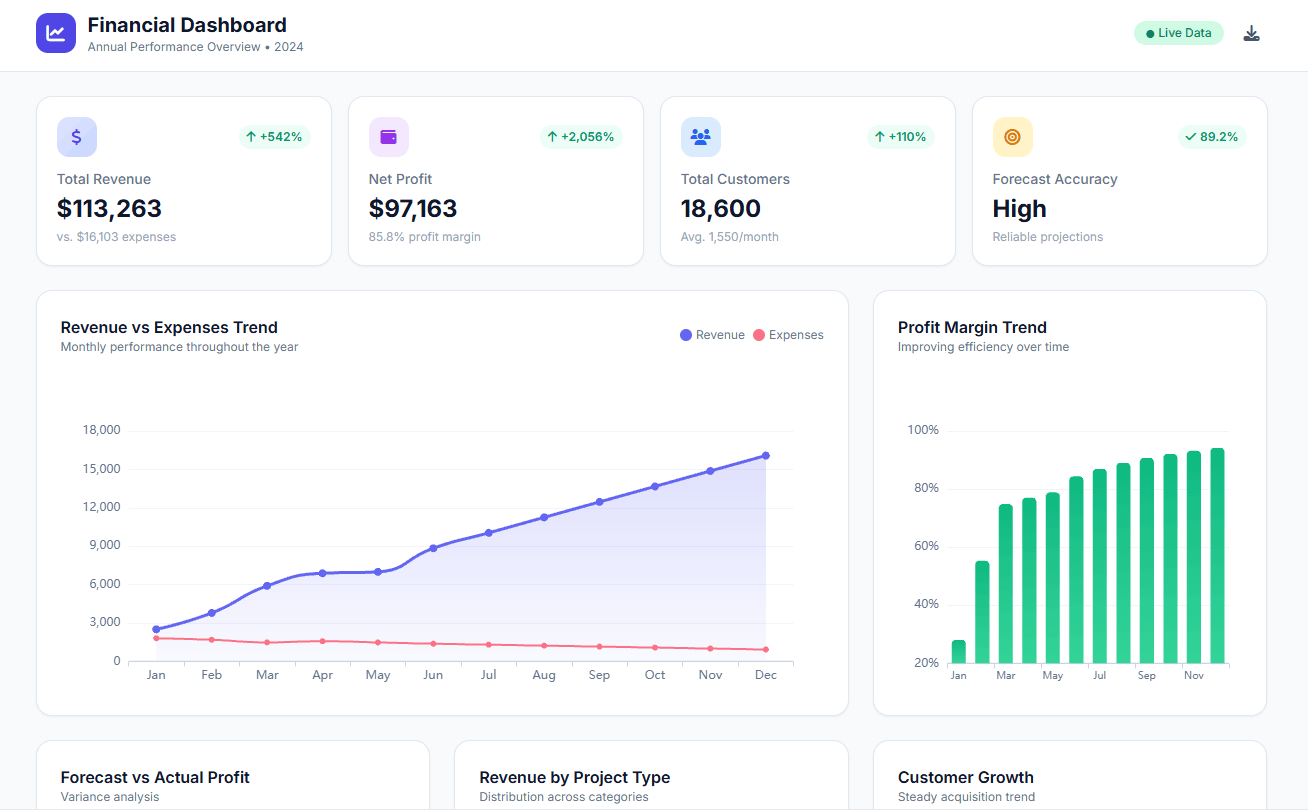
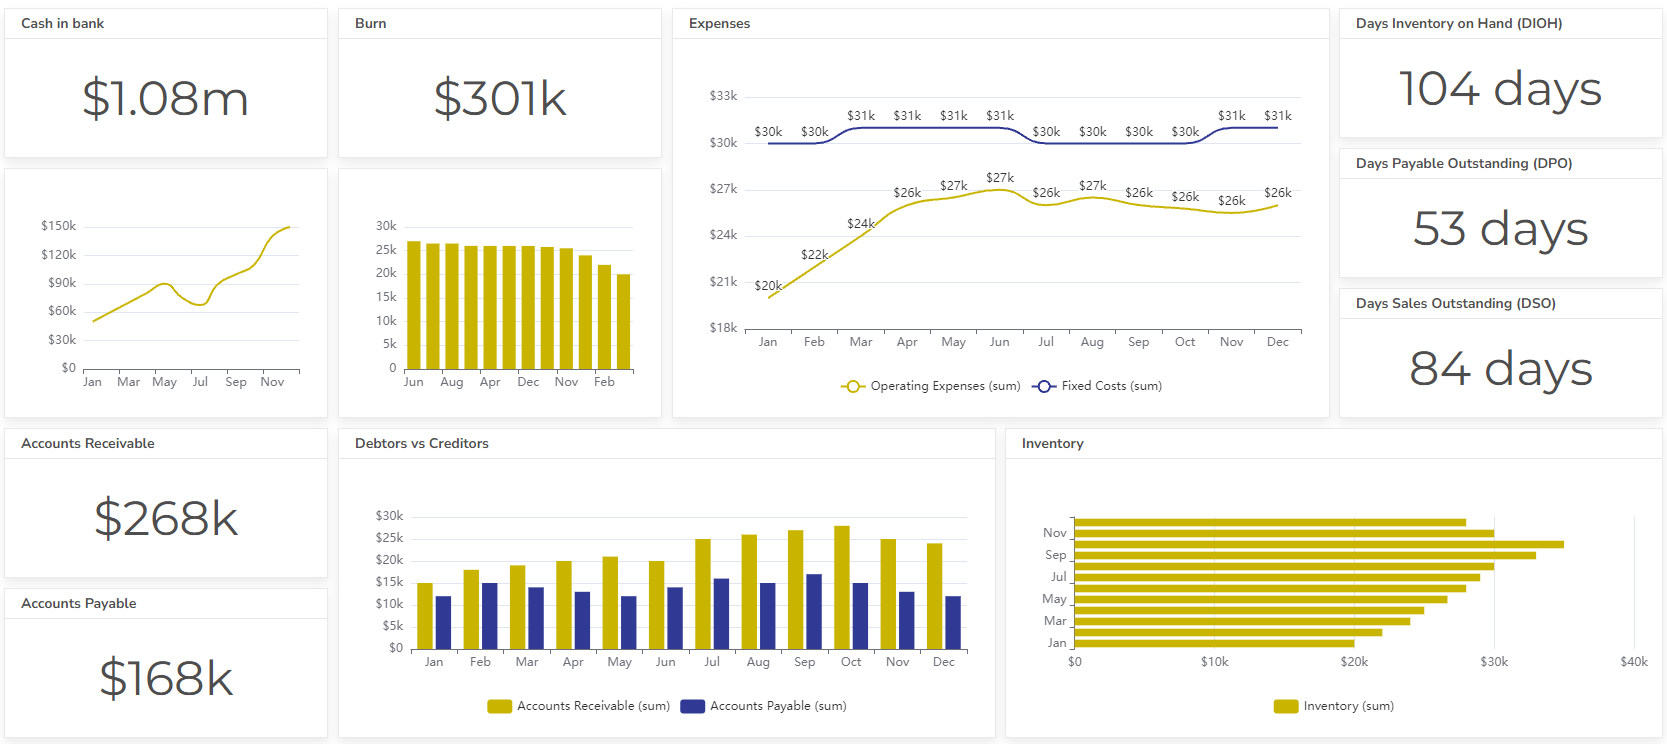
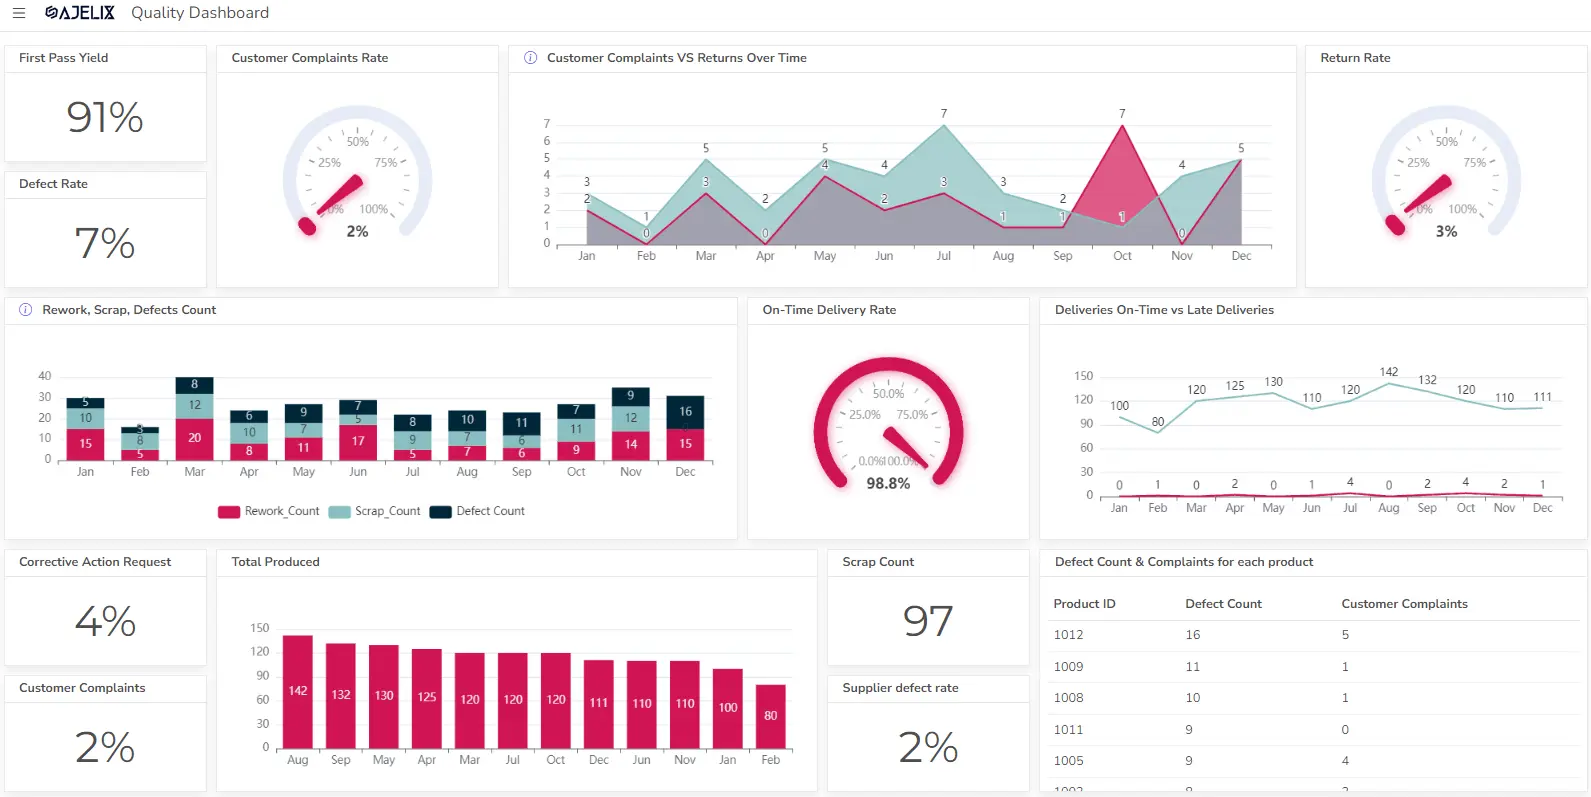
Dashboard Creation For KPI Tracking
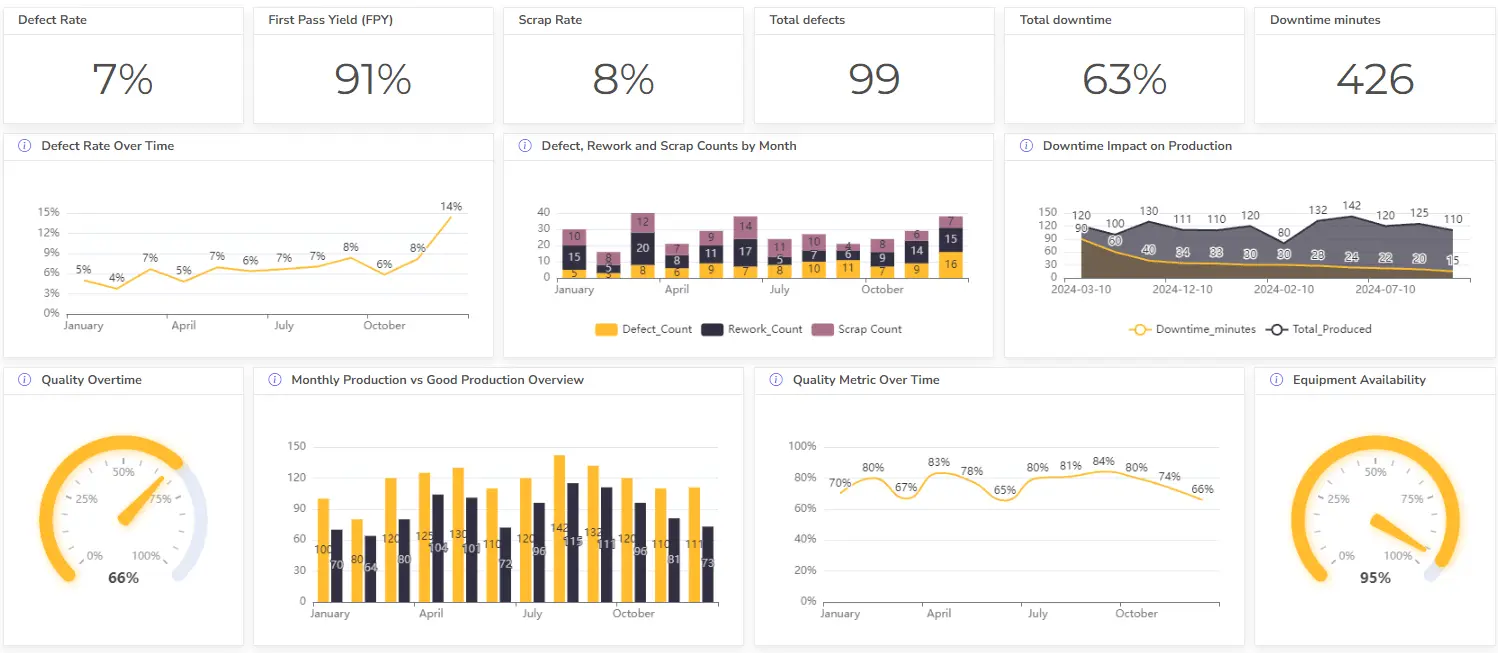
In the manufacturing industry, tracking Key Performance Indicators (KPIs) is essential for maintaining high quality standards, optimizing production, and improving operational efficiency.
Dashboards are powerful tools that help operators monitor manufacturing KPIs in real-time, offering a visual, centralized view of data that enables better decision-making.
Struggling with manual calculations & tiring setups?
Let agentic AI do the heavy lifting.
Start free
Fast sign up & easy setup
How Manufacturing Companies Can Benefit from Analytics?
The factory floor is no longer just a realm of whirring machines and assembly lines. Today, it’s a data-driven landscape, where information holds the key to unlocking efficiency, optimizing operations, and gaining a competitive edge.
But how exactly can manufacturing companies benefit from data analytics? Let’s delve into the key areas where data holds the power to transform:
- Preventative Equipment Maintenance
- Flow Optimization and Efficiency
- Demand Forecasting
- Data-Driven Decisions
- Innovation Driven by Data
1. Preventative Equipment Maintenance
Instead of scrambling to fix equipment failures that halt production, you could predict problems before they happen. Data analytics, powered by sensor data and machine learning algorithms, can analyze equipment health and usage patterns, flagging potential issues before they escalate into costly downtime.
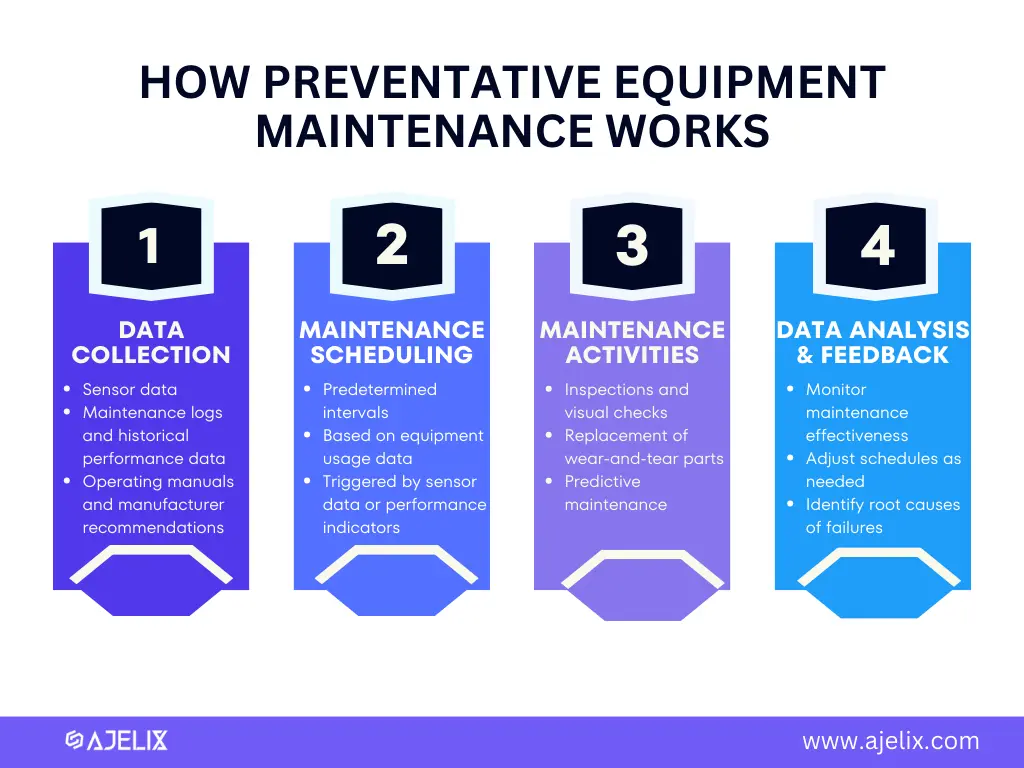
Infographic how preventative equipment maintenance works using data analytics, made by author
How data analytics can help with preventative equipment maintenance:
- Data collection:
- Sensor data from equipment (vibration, temperature, etc.)
- Maintenance logs and historical performance data
- Operating manuals and manufacturer recommendations
- Maintenance scheduling:
- Time-based: Routine maintenance at predetermined intervals.
- Usage-based: Maintenance based on equipment usage data.
- Condition-based: Maintenance work planning can be triggered by sensor data or performance indicators.
- Maintenance activities:
- Inspections and visual checks
- Lubrication and minor adjustments
- Replacement of wear-and-tear parts
- Predictive maintenance using technology like vibration analysis
- Data analysis and feedback:
- Monitor maintenance effectiveness and adjust schedules as needed
- Identify root causes of failures to prevent future occurrences
- Continuously improve the PEM program based on insights
This proactive approach saves money, boosts productivity, and ensures smooth operations. There are several services that provide preventative maintenance implementation.
2. Flow Optimization and Efficiency
Data analytics doesn’t just crunch numbers; it unlocks hidden insights, revealing bottlenecks, identifying inefficiencies, and guiding businesses towards smarter, data-driven decisions. Here’s how data analytics can optimize flow and efficiency across various business functions:
2.1. Supply Chain Optimization:
- Demand forecasting: Analyze historical sales data, market trends, and external factors to predict demand with accuracy. This ensures you have the right inventory at the right time, avoiding costly stockouts and overstocking.
- Route optimization: Analyze location data and traffic patterns to plan efficient delivery routes, reducing transportation costs and delivery times.
- Supplier performance monitoring: Track supplier performance metrics like delivery times and quality to identify and address potential issues proactively.
2.2. Customer Order Processing:
- Order fulfillment optimization: Analyze order patterns and resource availability to optimize order fulfillment processes, reducing processing times and delivery delays.
- Fraud detection: Analyze customer data and transaction patterns to identify and prevent fraudulent activities, protecting your business and customers.
- Personalized customer experiences: Analyze customer behavior and preferences to personalize communication and offers, improving customer satisfaction and loyalty.
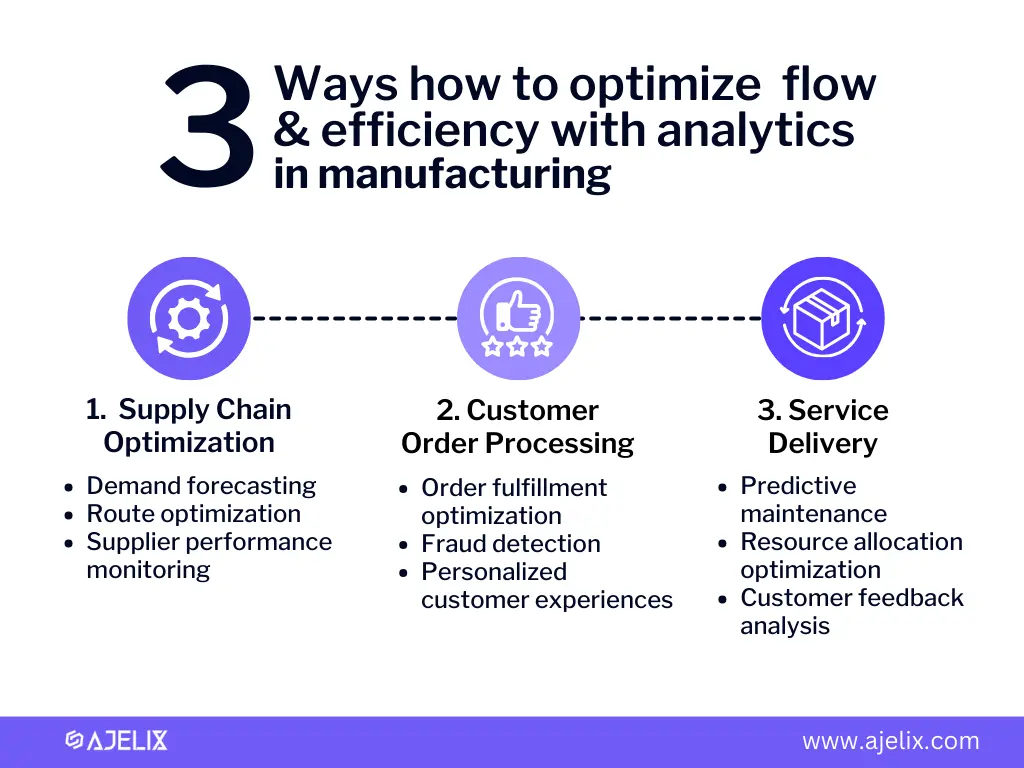
3 ways how to use data analytics to improve efficiency in manufacturing, infographic by author
2.3. Service Delivery:
- Predictive maintenance: Analyze equipment data to predict potential failures before they occur, minimizing downtime and maintenance costs.
- Resource allocation optimization: Analyze service requests and technician skills to optimize resource allocation, ensuring timely and efficient service delivery.
- Customer feedback analysis: Analyze customer feedback to identify areas for improvement and adapt service offerings to better meet customer needs.
3. Demand Forecasting
Accurately predicting customer demand is a constant challenge for manufacturers. By analyzing historical sales data, market trends, and even social media sentiment, data analytics can offer reliable demand forecasts.
This allows you to plan production effectively, avoid stockouts and overproduction, allocate resources efficiently. Here are 4 principles how to implement demand forecasting in your manufacturing process:
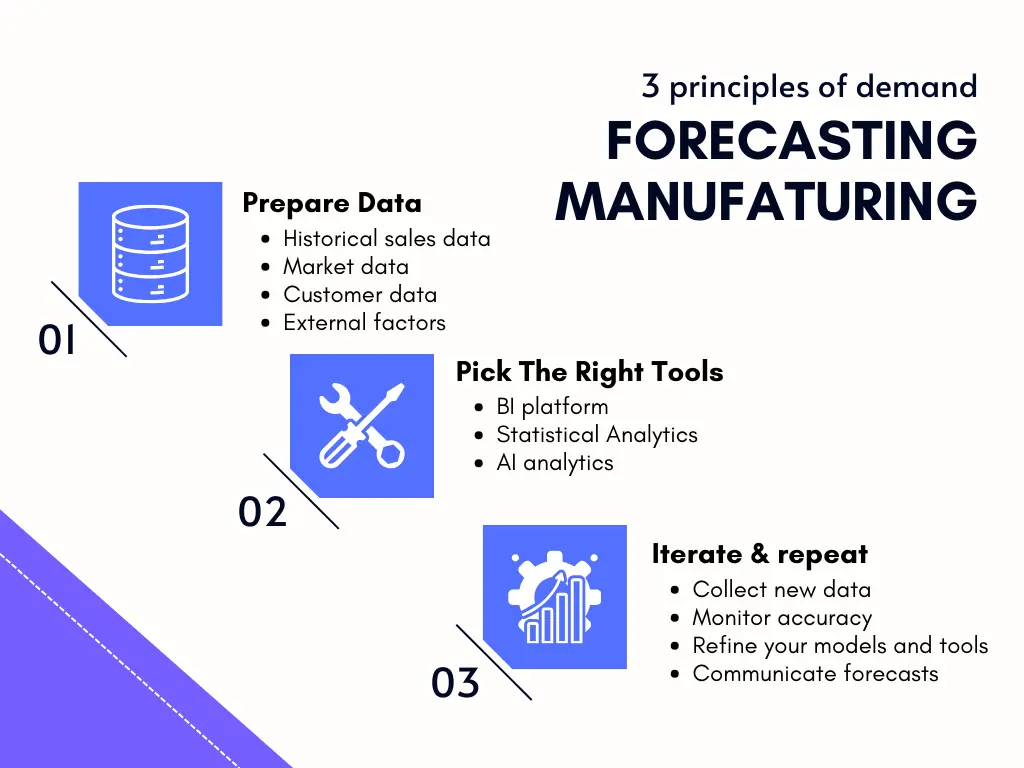
3 principles of demand forecasting implementation in manufacturing, infographic by author
3.1. Prepare Data
The foundation of accurate forecasting lies in comprehensive data collection. This includes:
- Historical sales data: Analyze past sales trends to identify patterns and seasonality.
- Market data: Consider economic indicators, competitor activity, and industry trends.
- Customer data: Leverage demographics, purchase history, and customer preferences.
- External factors: Include weather patterns, holidays, and social media sentiment.
By gathering this diverse data, you paint a more complete picture of your customer base and the factors influencing their purchasing decisions.
3.2. Pick The Right Tools
Data alone isn’t enough; you need the right tools to unlock its potential. Here are some powerful players:
- Statistical forecasting: Leverage traditional methods like moving averages and exponential smoothing for basic predictions.
- Machine learning algorithms: Many BI tools offer AI-powered analytics that learns from your data to identify complex patterns and make more precise forecasts.
- Text analytics: Analyze customer reviews, social media buzz, and online searches to gauge demand sentiment.
Selecting the right tools depends on your specific needs, data availability, and desired level of sophistication.
3.3. Make it an iterative process
Demand forecasting is an iterative process. Here are some key practices:
- Continuously collect and integrate new data
- Monitor and evaluate the accuracy of your forecasts
- Refine your models and tools based on new insights
- Communicate forecasts effectively to different departments
What Are The Benefits Of Demand Forecasting?
Demand forecasting offers various advantages:
- Reduce stockouts and overstocking: Optimize inventory levels to avoid costly stockouts and unnecessary storage expenses.
- Plan production effectively: Align production schedules with projected demand, ensuring product availability and efficient resource allocation.
- Improve financial planning: Accurately forecast revenue and expenses for better budgeting and cash flow management.
- Make data-driven decisions: Identify and capitalize on emerging trends and market opportunities.
Remember, data analytics is a powerful tool, but it’s not a crystal ball. Unexpected events can occur. However, by embracing data-driven forecasting, you gain a significant advantage in anticipating customer needs, navigating market fluctuations, and achieving sustainable business growth.
4. Data-Driven Decisions
Gut feeling and intuition have their place, but in today’s data-rich world, informed decisions are crucial. Data analytics provides the evidence you need to make strategic choices with confidence.
Analyze marketing campaign performance, track ROI on investments, and measure the impact of new initiatives. Data empowers you to move beyond guesswork and steer your company toward sustainable growth.
5. Innovate With Data
What if you could design products that perfectly meet your customer’s needs and preferences? Data analytics makes this a reality. By analyzing customer feedback, purchase history, and even social media interactions, you can gain deep insights into customer preferences and market trends.
This fuels innovation, allowing you to develop products that resonate with your target audience and stay ahead of the competition.
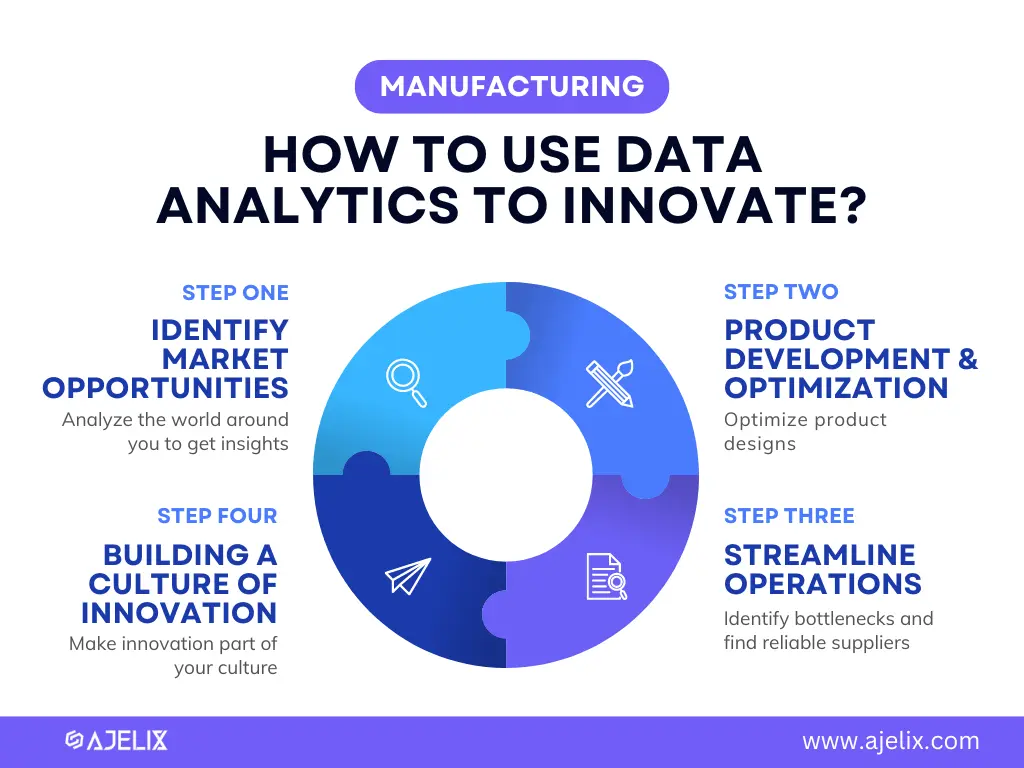
How manufacturing companies use data to innovate, infographic made by author
How do manufacturing Companies use data analytics to innovate?
- Identifying Market Opportunities
- Analyzing customer data: Understand customer needs, preferences, and pain points to design products that truly resonate.
- Social media listening: Gauge customer sentiment and emerging trends to spot new market opportunities.
- Competitor analysis: Analyze competitor products and strategies to identify gaps and develop differentiated offerings.
- Product Development and Optimization
- Sensor data analysis: Leverage data from prototypes and testing to optimize product design for performance and efficiency.
- Machine learning: Use algorithms to design and iterate on products faster, exploring a wider range of possibilities.
- Streamlining Operations and Supply Chains
- Production line analysis: Identify bottlenecks and inefficiencies to optimize production processes and resource allocation.
- Supplier performance monitoring: Analyze supplier data to identify reliable partners and optimize procurement strategies.
- Building a Culture of Innovation
- Data-driven decision making: Replace intuition with evidence-based decisions, fostering a culture of experimentation and calculated risk-taking.
- Collaboration and knowledge sharing: Empower teams to access and analyze data, encouraging cross-functional collaboration and innovative thinking.
- Continuous learning and improvement: Regularly evaluate results and adapt strategies based on data insights, creating a dynamic and innovative environment.
Examples how manufacturing companies use data to innovate
- GE Aviation: Uses sensor data and machine learning to predict engine failures and recommend preventive maintenance, reducing downtime and saving airlines millions.
- BMW: Analyzes customer data and social media trends to identify popular features and develop personalized car configurations.
- Siemens: Leverages data analytics to optimize production lines, reducing waste and increasing efficiency by 20%.
Data analytics isn’t just a buzzword; it’s a powerful tool that can transform your manufacturing operations. By embracing data-driven decision-making, you can unlock efficiency, optimize processes, and gain a significant competitive edge.
5 Data analytics tools for manufacturing companies
Here are 5 popular data analytics tools specifically designed for or suited to manufacturing companies:
- Ajelix BI: for basic data visualization, analytics tasks and AI insights.
- Siemens MindSphere: This cloud-based platform offers Industrial IoT (IIoT) solutions and connects machines, devices, and systems to analyze data from the shop floor.
- PTC ThingWorx: This platform focuses on digital twins, creating virtual representations of physical assets and processes.
- SAS Visual Data Discovery: This interactive tool makes data exploration and analysis accessible to users with various skill levels.
- OSIsoft PI System: This platform focuses on real-time data management and analysis. It connects to diverse data sources, provides tools for data cleansing and visualization.
- Dataiku: This open-source platform offers a comprehensive suite of data analytics tools, including data preparation, machine learning, and predictive modeling.
Reporting gives you a headache?
Upload your data and create professional reports with agentic AI

Start free
Try free and upgrade whenever
Conclusion
Data analytics is the new production line in modern manufacturing, providing powerful insights to unlock efficiency, optimize operations, and gain a competitive edge. Manufacturers can predict equipment failures, optimize supply chains, forecast demand, and develop innovative products tailored to their customers’ exact needs.
This proactive approach saves money, boosts productivity, and ensures smooth operations. So make sure to implement data analytics in your operation process.
Get help with simple analytics tasks from Ajelix BI
From data to report in one minute or less with Ajelix AI Agents


