7 Business Intelligence Trends (BI) 2026
This year, Business intelligence trends are all about harnessing the power of technologies like Generative AI and Natural Language Processing (NLP) to unlock deeper insights from your data. Another important trend this year is empowering non-technical users using self-service analytics. 🦾
Change the way you work with agentic AI
One-click dashboards,KPI tracking, and AI-powered insights—for work that actually gets done.

We’ll delve into the top 7 trends shaping BI in 2026, exploring how these trends can empower you to make smarter decisions, optimize processes, and achieve tangible results.
Summary
BI is undergoing a rapid transformation. Key trends driving this change include generative AI, NLP, and cloud computing.
The benefits are significant:
- Enhanced decision-making: Predictive analytics and actionable insights.
- Improved efficiency: Automated tasks and simplified data access.
- Data-driven culture: Empowered users and collaborative BI.
However, challenges remain:
- Data quality and governance: Ensuring data accuracy and security.
- Talent shortage: Finding and retaining skilled data professionals.
By addressing these challenges and leveraging these trends, organizations can:
- Gain a competitive edge.
- Optimize operations.
- Drive innovation.
Top BI Trends 2026
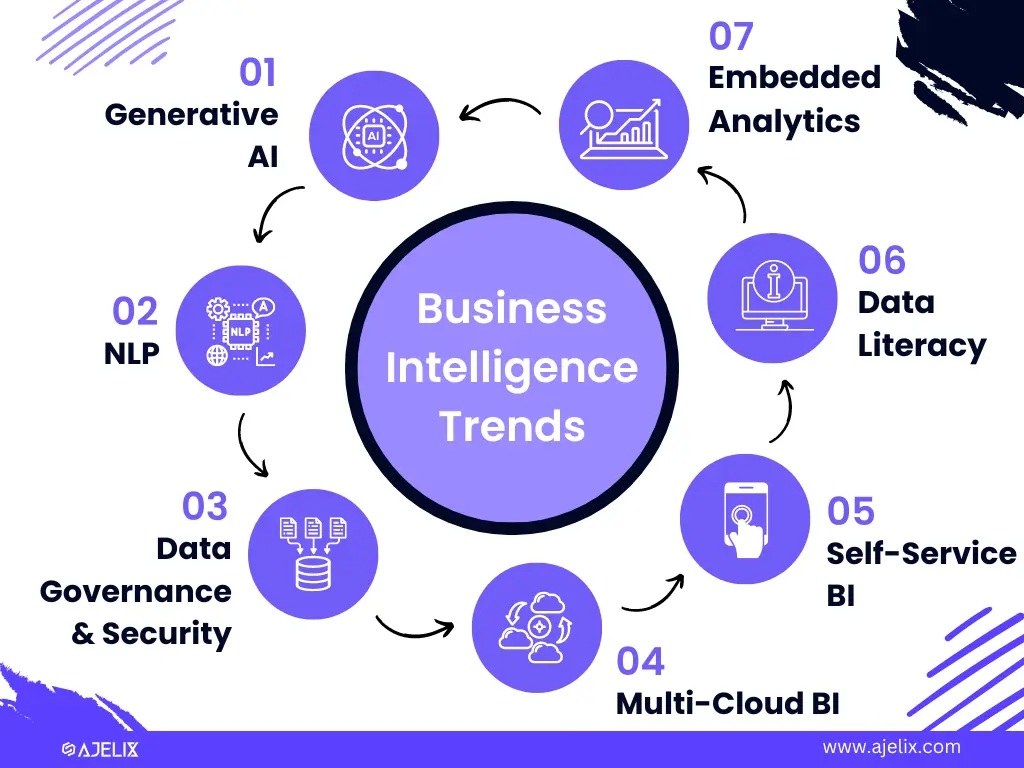
- Generative AI
- AI ChatBots & Virtual Assistants
- Data Governance and Security
- Multi-Cloud BI
- Self-Service BI
- Data Literacy
- Prescriptive and Embedded Analytics
1. Generative AI and BI Changes
Business Intelligence (BI) is on the cusp of a transformative era, driven by the capabilities of Generative AI. In essence, Generative AI refers to a subfield of Artificial Intelligence that focuses on creating entirely new data, be it text, code, images, or music. This technology is changing the way we approach data analysis within BI.
Traditionally, BI has relied on historical data to identify trends and patterns. However, Generative AI can go beyond the past. It can create realistic simulations of future scenarios based on existing data sets.
Imagine a retail marketing company wanting to predict consumer demand for a new product launch. Generative AI can analyze past sales data, customer demographics, and market trends to create simulated scenarios with varying price points and marketing strategies.
Generative AI tools can automate tasks like data cleaning, and feature engineering, and even generate reports with clear visualizations and actionable insights.
Example: Generative AI in Healthcare
Generative AI can analyze patient data to create simulated models of potential drug interactions or disease progression. This allows doctors to personalize treatment plans and predict potential risks more accurately. Additionally, AI-powered BI tools can generate comprehensive reports highlighting key trends in patient demographics and treatment outcomes. Many healthcare providers are also leveraging generative AI as a service to streamline data analysis and enhance their decision-making processes.
Source: Forbes
2. AI ChatBots & Virtual Assistants
Remember the days of wrestling with complex queries to get insights from your data? Thanks to Natural Language Processing (NLP), those days are fading fast.
NLP is a branch of AI that empowers computers to understand and interpret human language. In BI, NLP acts as a translator, bridging the gap between technical jargon and everyday speech. P.S. Ajelix can help you explain your data charts into insights and trends.
This is a game-changer for non-technical users. Imagine asking your BI tool a question in plain English, like “What were our top-selling products last quarter, broken down by region?” With NLP, that’s exactly what you can do. No more struggling to translate your business questions into complex queries. Simply ask, and NLP takes care of the rest, delivering the data you need in an easily digestible format.
This user-friendly approach isn’t just about convenience; it empowers a wider range of people to leverage BI. Business leaders, marketing managers, and even sales reps can now directly access and analyze data without relying on data analysts or IT support.
Example: Customer Sentiment Analysis with NLP
NLP can analyze thousands of customer reviews, social media posts, and survey responses to gauge overall customer sentiment towards your brand, products, or services. By identifying positive and negative trends, businesses can gain valuable insights to improve customer satisfaction, refine marketing strategies, and develop more targeted product offerings.
3. Data Governance and Security
As organizations collect and store ever-increasing volumes of data, ensuring its quality and consistency becomes paramount. Clean, reliable data is the foundation for accurate insights and effective decision-making in BI.
Author’s note: This topic has been very relevant in 2024 and stays just as important in 2026. Actually, this topic has even increased its relevancy during 2024. With so many AI tools and modules businesses are trying to keep up with the changes. Just take a look at the Deloitte survey regarding data safety concerns.
Here’s the catch: data quality and data security are intricately linked. Inaccurate or inconsistent data can lead to misleading insights, compromising security posture. Imagine a scenario where customer data is riddled with errors – exposed email addresses or misplaced phone numbers. Not only does this undermine customer trust, but it also creates vulnerabilities that hackers can exploit.
That’s why robust data governance practices are crucial. Data governance establishes clear guidelines for data collection, storage, access, and usage. It ensures that data is accurate, complete, and consistent across the organization.
But data governance is just one piece of the puzzle; you can’t forget about security. Encryption, access controls, and regular security audits are essential to safeguard sensitive data. Additionally, staying informed about the latest cyber threats and implementing proactive security measures is critical to staying ahead of the curve.
4. Multi-Cloud BI
Businesses are increasingly embracing multi-cloud strategies, and BI is no exception. In a nutshell, a multi-cloud approach involves utilizing multiple cloud services from different providers. This allows businesses to create a more flexible and cost-effective BI environment.
For example, a retail company experiencing peak sales during holidays. A traditional cloud setup might struggle to handle the sudden surge in data traffic. However, a multi-cloud strategy allows the company to seamlessly scale its BI resources using another cloud provider during peak periods.
The benefits of multi-cloud aren’t limited to scalability. For instance, one cloud provider might excel in data security, while another offers superior data visualization tools. A multi-cloud strategy allows businesses to pick and choose the best-in-class services for their specific BI needs.
Example: Multi-Cloud BI in Manufacturing
Manufacturers often require a combination of real-time data processing for production line monitoring and historical data analysis for optimizing supply chains. A multi-cloud approach allows them to leverage a cloud service with exceptional real-time processing capabilities for their factory floor data while utilizing another cloud provider for historical data analytics.
5. Self-Service BI
The days of data being siloed away in the hands of IT specialists are fading. Collaborative BI and self-service analytics give data access to non-technical teams to become data-driven decision-makers.
Collaborative BI fosters a culture of information sharing and teamwork around data analysis. Imagine a scenario where marketing and sales teams can work together on a single platform, combining customer data insights to develop targeted marketing campaigns. Collaborative BI tools provide shared workspaces, real-time updates, and annotation features.
Author’s Note: Although self-service is popular throughout different industries, there are some concerns. As any department can create dashboards it can get confusing for business decision makers which dashboard to use. There’s a need for analytics experts to create one big picture. More on this topic read here about self-service pitfalls.
Self-service analytics puts the power of data exploration directly in the hands of business users. Think of it as handing them the keys to the data kingdom. With user-friendly interfaces and intuitive drag-and-drop functionalities, self-service analytics tools empower business users to explore data independently, identify trends, and generate reports without relying solely on IT support. This frees up IT resources and fosters a sense of ownership and accountability.
The combined force of collaborative BI and self-service analytics empowers business users across all departments to unlock the hidden stories within their data. Marketing teams can analyze customer behavior to personalize campaigns, sales reps can gain insights into customer needs to close deals faster, and even finance departments can leverage data to optimize budgeting and forecasting.
With great power comes great responsibility! To ensure effective utilization of these trends data literacy training is becoming crucial.
6. Data Literacy
While cutting-edge tools and innovative trends are transforming BI, there’s a crucial ingredient often overlooked: data literacy. Simply put, data literacy refers to the ability to read, understand, work with, and communicate data in a meaningful way. It’s the bridge between raw data and actionable insights.
Data literacy plays a pivotal role throughout the entire analytics process. It empowers individuals to identify relevant business problems and critically analyze the results. Data literacy can help users to interpret findings accurately, identify potential biases, and draw sound conclusions.
The importance of data literacy cannot be overstated. Misinterpreting data can lead to misleading insights, flawed decisions, wasted resources, and missed opportunities. A lack of data literacy fosters data silos and inefficiencies.
7. Prescriptive and Embedded Analytics
Business intelligence isn’t just about understanding the past and present; it’s about shaping the future. That’s where prescriptive and embedded analytics come in.
Prescriptive analytics goes beyond descriptive reports and visualizations. It leverages advanced algorithms and machine learning to analyze data and predict what might happen.
Imagine a retail store using prescriptive analytics to forecast demand for specific products during a seasonal sale. The system can predict items that will be popular and recommend optimal pricing strategies.
Embedded analytics takes the concept of actionable insights a step further. It seamlessly integrates data visualizations and insights directly within workflows and existing applications. Think of it as having real-time data analysis capabilities embedded right where you need them.
For instance, a customer service representative might have access to a customer’s purchase history and recent interactions embedded within their CRM platform.
Conclusion
The key to success lies in harnessing its power to take decisive action. In this article, we explored the top 7 BI trends that shape the way we use data. Explore the possibilities, test different BI tools, and find the right software to help you stay on top of the trends.
FAQ
Subscribe to publications and blogs focused on BI and data analytics.
BI is becoming increasingly complex and inaccessible to non-technical users. Data security is no longer a major concern in BI. Both of these trends are quite opposite.
Ready to experience BI trends with Ajelix?
From data to report in one minute or less with Ajelix AI Agents


