Differences between Excel and Google Sheets

When it comes to managing data, the debate between Excel and Google Sheets is a hot topic. Both tools offer unique features and functionalities, making them popular choices for creating comparison spreadsheets.
In this article, we will look at 11 differences between Excel and Google Sheets, exploring whether Google Sheets is the same as Excel or if one truly stands out as the better option.
Our comprehensive overview of Google Sheets vs. Microsoft Excel will help you determine which tool is best for you.
Introduction to Excel and Google Sheets
Everyone who has data to manage has heard of the most widely used spreadsheet tools Microsoft Excel and Google Sheets.
Good old Excel is known for its advanced data analysis and automation, making it the go-to for power users. Google Sheets, on the other hand, shines with real-time collaboration and seamless integration with Google services.
While both are essential for managing data, they serve different needs— for example, Excel is often considered more advanced than Google Sheets, as highlighted in the Industry Survey of Analytics Spreadsheet Tools Adoption, which shows Excel’s dominance in job postings.
Pros and cons of each platform
| Feature | Excel | Google Sheets |
|---|---|---|
| Pros | Advanced analytics, powerful automation (VBA), handles large datasets efficiently, extensive charting & formatting options, supports custom-built add-ins. | Real-time collaboration, cloud-based, automatic saving, free for personal use, easy integration with Google services. |
| Cons | Requires a paid subscription, less seamless collaboration, and manual saving is required unless AutoSave is enabled. | Slower performance with large datasets lacks advanced features like Power Pivot and VBA, and limited automation capabilities. |
| Best For | Large datasets, advanced data analysis, automation, business and financial modeling. | Real-time collaboration, cloud-based workflows, lightweight tasks, and team projects. |
11 Main differences between Excel and Google Sheets
We understand – you came here to find out which platform is better. However, we already must warn you that there is no right or wrong in this question.
Both are great (like, really great!) but we can’t just pick one platform since it depends on what you need. While there isn’t a universally correct choice, we can help by sharing 11 main differences between Excel and Google Sheets.
Fingers crossed after reading this article you will find out which tool is best for you!
1. Sharing and Collaboration
Google Sheets excels in real-time collaboration. It is designed for online use, making it easy to share documents with others and collaborate live. Users can see edits in real time, add comments, and assign tasks without additional setup.
Excel, on the other hand, offers collaboration through “co-authoring” and this feature has a few specific requirements. Users must be on Excel for Microsoft 365, Excel for the web, Excel Mobile, or other specified versions to see real-time changes.
Additionally, Google Sheets saves changes automatically but Excel has an “AutoSave” feature which must be enabled manually.
“AutoSave” is located In the left upper corner of your Excel Spreadsheet:
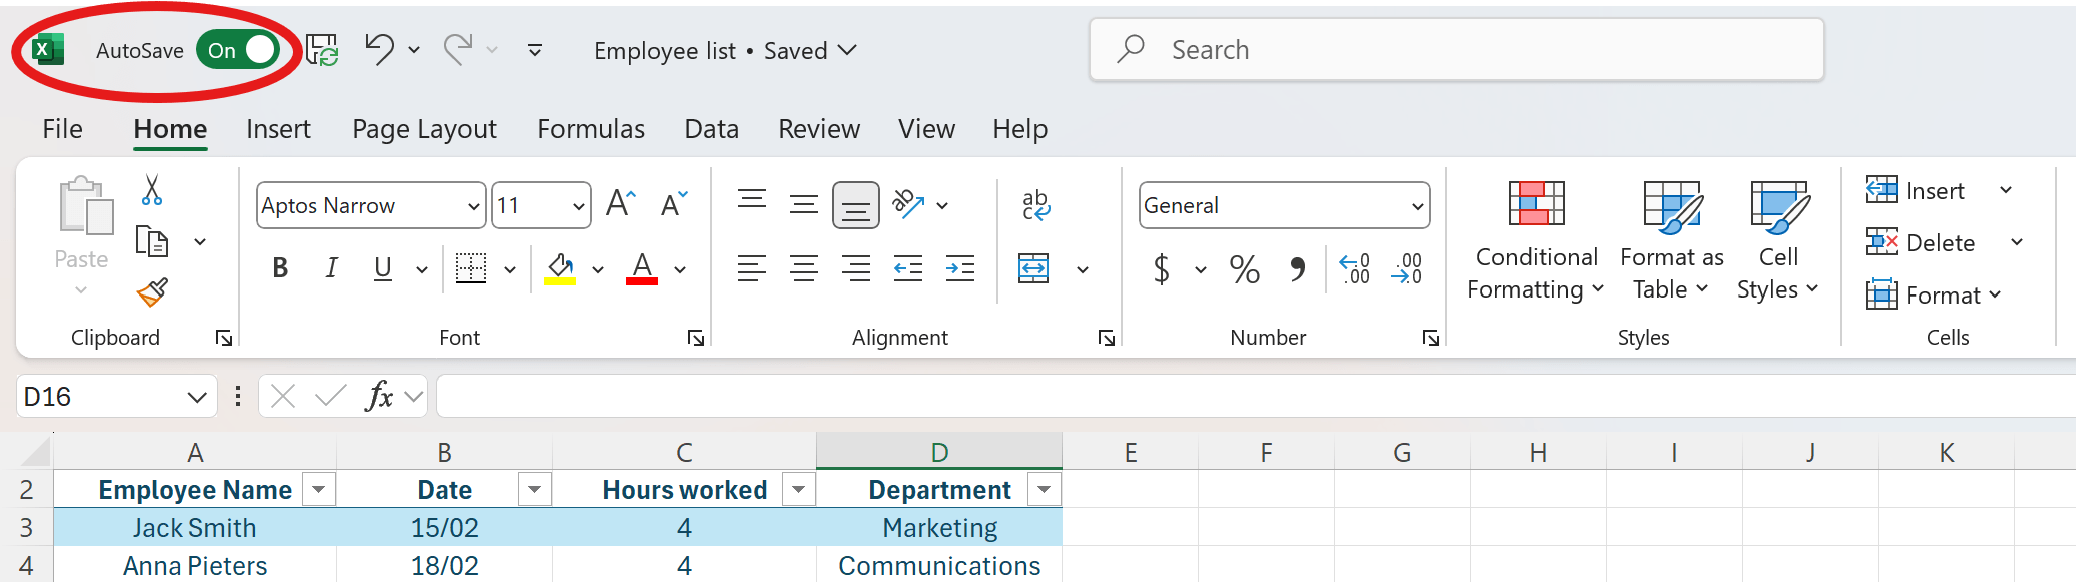
Without it, users rely on manual saving or periodic autosave intervals, which can be a drawback in collaborative environments.
2. Scripting & Automation
Google Sheets uses Google Apps Script, which is based on JavaScript. It supports automation through triggers, which can run even when users are offline. It’s easier to integrate with cloud services.
Excel uses VBA (Visual Basic for Applications), which is more powerful because it can leverage Windows API and advanced libraries. Excel automation tends to be faster and more feature-rich than Google Sheets.
However, there is a “but”: VBA requires a steeper learning curve.
If you don’t have the time & energy for learning, remember it’s 21st Century and there are several AI Tools that can help you.
One of them is the VBA Scripts Generator that generates codes, so you don’t have to:
3. Performance
Google Sheets can struggle with large datasets, slowing down when dealing with complex calculations or thousands of rows. And since it’s cloud-based, your internet speed can be a game-changer. Slow connection? Prepare for lag.
Excel, however, is a data powerhouse. With lightning-fast processing and local performance, it crushes large datasets and complex calculations. Plus, with features like Power Query and Power Pivot, Excel makes managing massive amounts of data a breeze.
If you’re working with large and complex datasets, Excel is your go-to tool.
4. Usage Limitations
When it comes to limitations, Excel is undoubtedly the winner:
| Feature | Excel | Google Sheets |
|---|---|---|
| Row Limit | 1,048,576 rows | 5 million cells per sheet |
| Column Limit | 16,384 columns | 18,278 columns |
| File Size Limit | 2GB per file | 100MB per file |
| Script Execution Limit | No strict limit | 6 minutes per execution |
| API Quota | High | Limited requests per day |
If you want to learn more about additional Google Sheets limitations, check their official Google Sheets API Limits.
5. Plugins & Extensions
Google Sheets has an official marketplace for add-ons: Google Workspace Marketplace. These add-ons extend functionality but have performance constraints.
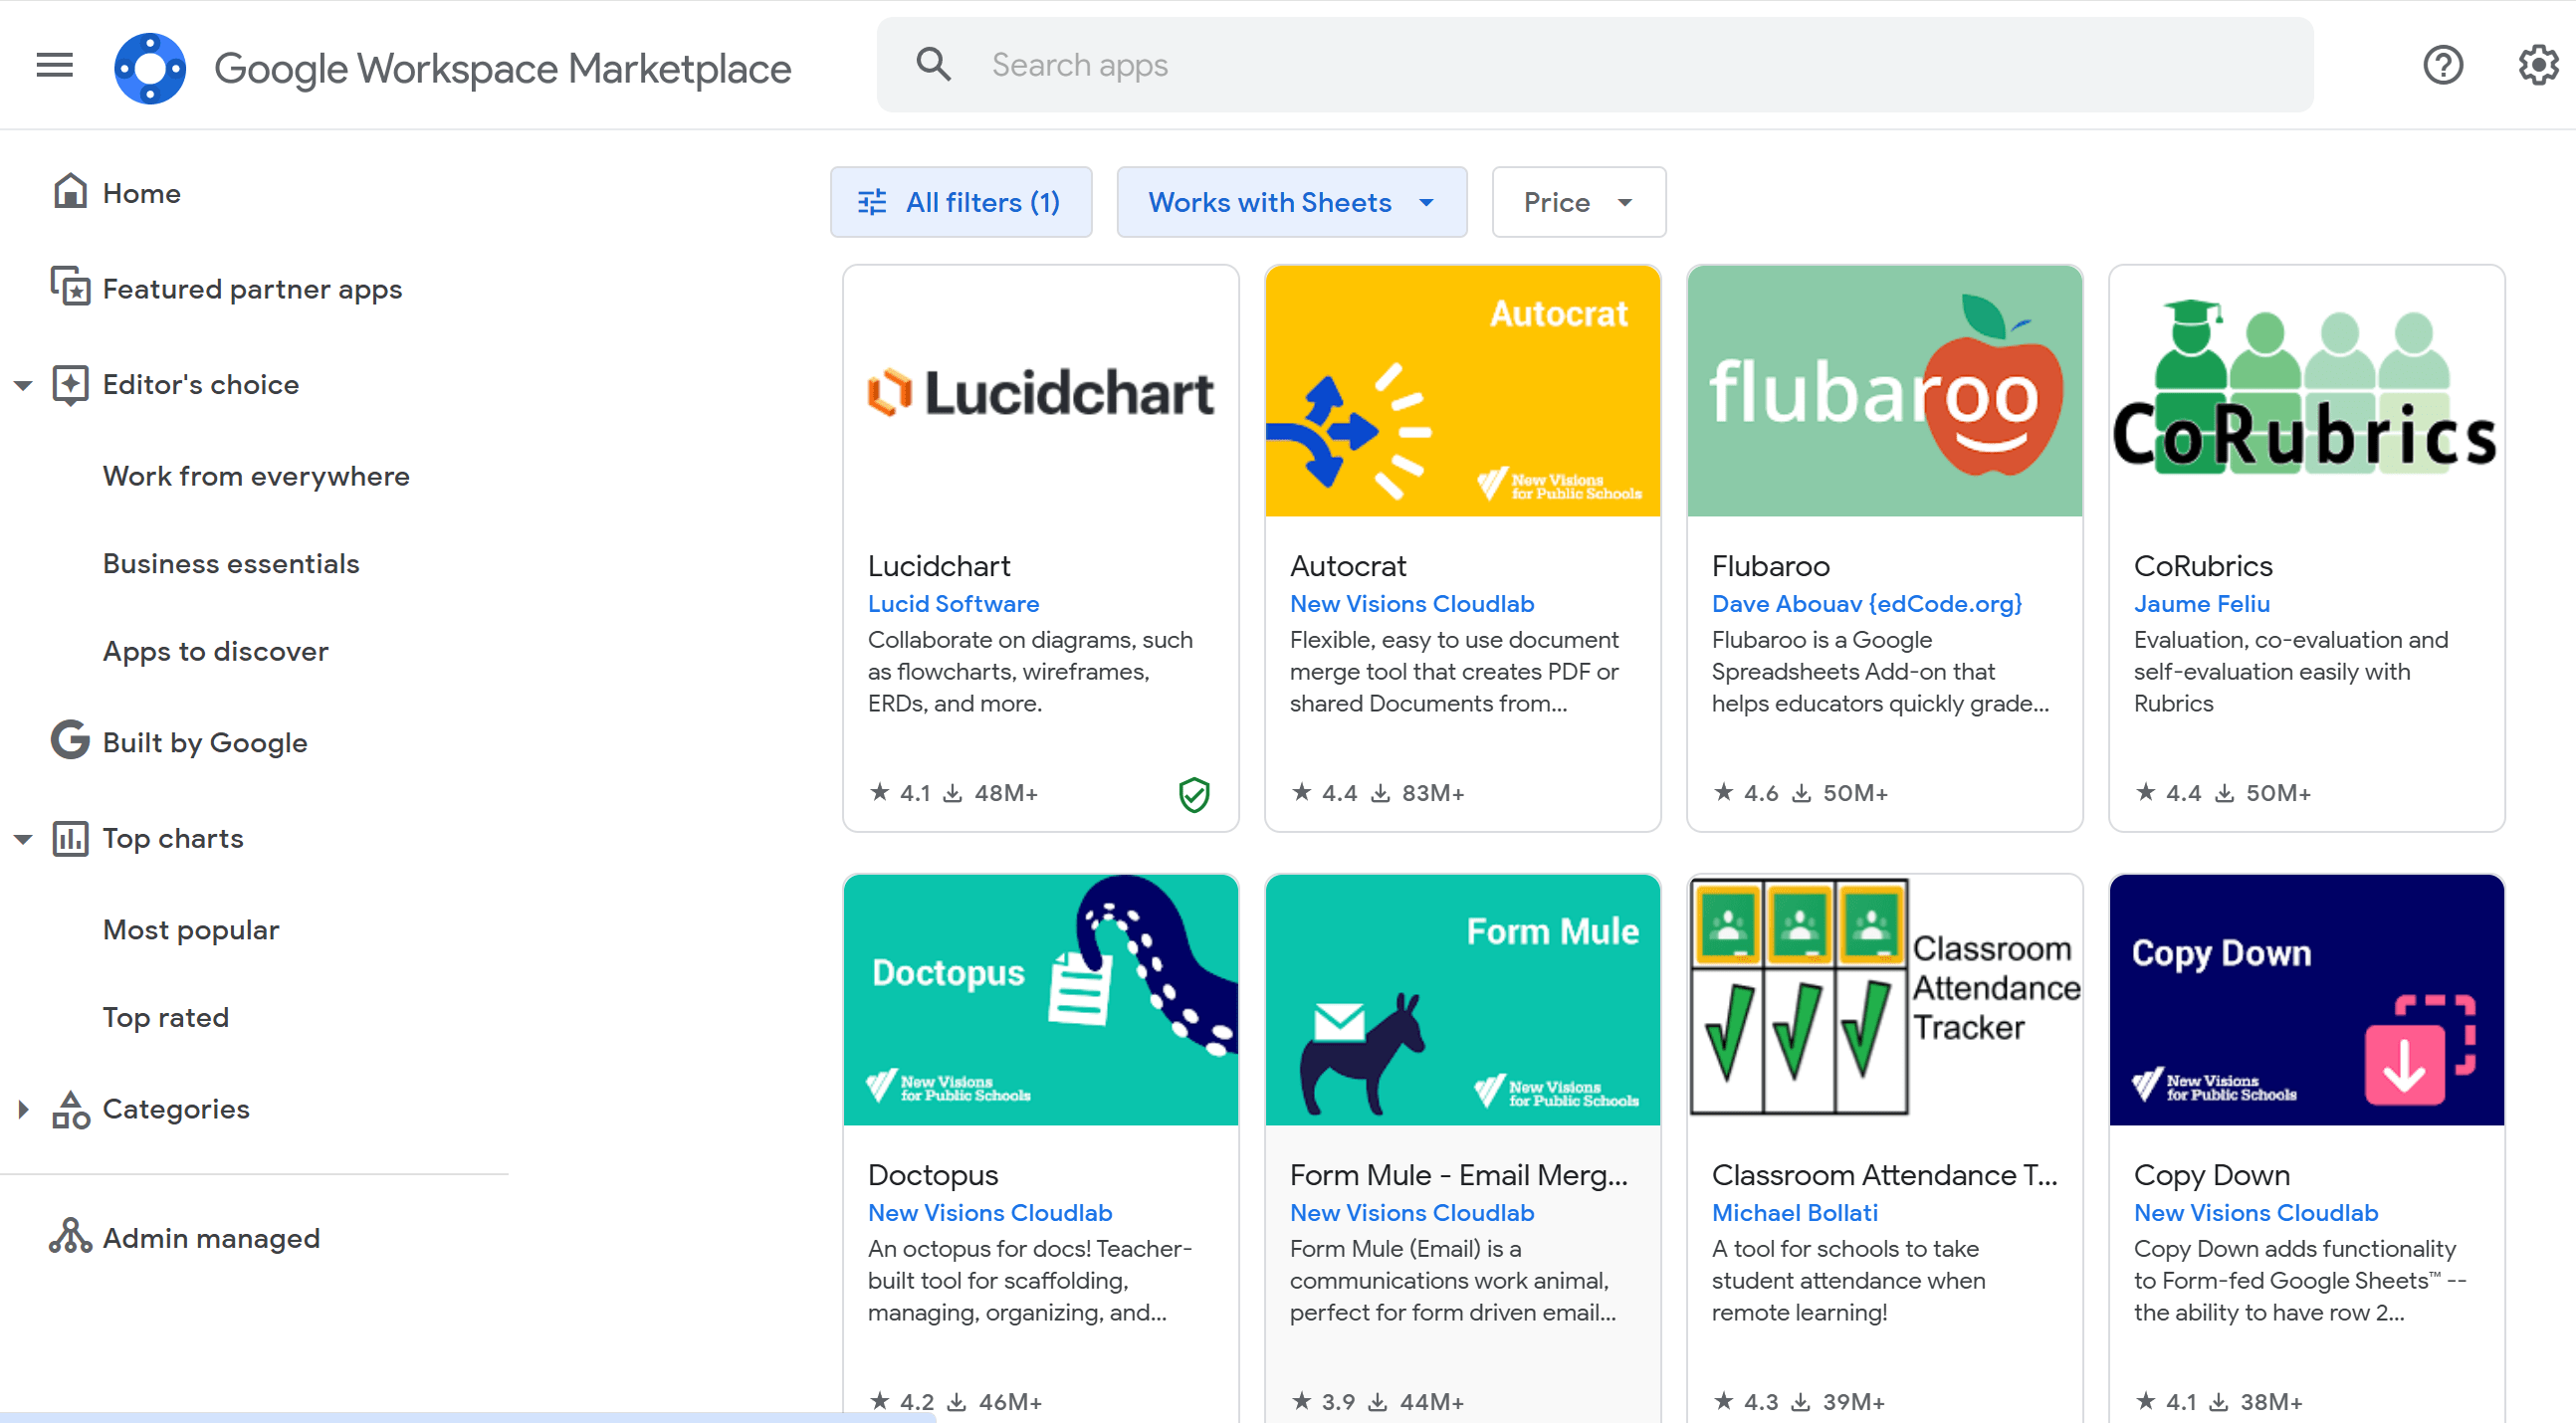
The offered add-ons vary by their function: from Supermetrics for data analytics to Flubaroo for educators’ grading system.
On the contrary, Excel supports custom-built add-ins, many of which are more powerful and can be downloaded from various sources, including Microsoft’s marketplace or third-party websites.
Among the most popular add-ins are Power Query for data transformation, Solver for optimization problems, and Analysis ToolPak for advanced statistical analysis.
These popular add-ins are great but our favorite one is Ajelix Excel Add-in. It’s our Excel assistant that knows everything: starting with complex formulas and ending with translations in different languages.
See our AI friend in action:
6. Security
Both platforms prioritize security but take different approaches:
Google Sheets:
Google Sheets relies on Google’s cloud security, using encryption for data at rest and in transit. With multi-factor authentication (MFA) and customizable access controls, it’s built for safe collaboration. Google also ensures data is backed up and complies with standards like GDPR and HIPAA.
Excel:
Excel offers robust security features, including AES encryption and password protection for files. It can be integrated with enterprise security tools like Microsoft’s Azure Active Directory for added control. Excel also lets users store files locally, giving complete control over sensitive data.
In short, Google Sheets shines in cloud security, while Excel provides deeper, customizable security for local storage and enterprise needs.
7. Export Formats
Google Sheets Export Formats:
Google Sheets offers several export options: XLSX, ODS, PDF, CSV, TSV, HTML, and JSON.
These formats make it easy to share data with others or use it in different applications. Whether you’re exporting to CSV for databases or PDFs for reports, these options cover most needs. However, it may not support the more advanced file types found in Excel.
Excel Export Formats:
Excel provides a wider variety of formats, including XLSX, XLS, CSV, TXT, PDF, XML, and JSON.
This range allows users to export data in many ways, from basic spreadsheets to more complex XML and JSON files for developers. Excel’s ability to handle advanced formats and data manipulation makes it perfect for users needing more control over their exports.
8. Integration with BI platforms
BI platforms in combination with Microsoft Excel or Google Sheets are a win-win. They take your raw data and turn it into powerful, real-time insights with dynamic reports, eye-catching visuals, and automated analysis.
We prefer the easy-to-use Ajelix BI Platform which has become a great help in quick data visualization:
The connection when integrating Google Sheets with the BI platform is live, meaning any changes in your spreadsheet are automatically reflected in the BI platform in real-time—no uploads needed. This makes it much faster and more efficient for getting up-to-date insights.
With Excel, on the other hand, you have to manually upload your files to the platform each time you want to refresh your data.
If you need to make quick decisions based on the latest information, Google Sheets might be a better choice.
9. Pivot Tables & Charts
When it comes to Pivot Tables and Charts, Excel is the true winner. If you’re dealing with complex data, Excel offers unmatched functionality. You can quickly create detailed pivot tables, summarize vast datasets, and even use Power Pivot to combine data from multiple sources.
Excel’s charting tools are highly customizable, giving you full control over your visuals—from formatting to interactivity. For data-heavy tasks or advanced analysis, Excel’s versatility is hard to beat.
You might like: How to create and use Power Pivot
In comparison, Google Sheets is great for basic tasks but lacks the depth needed for serious data manipulation. Its pivot table feature is much simpler, and while it can handle basic summaries, it doesn’t offer the advanced customization and flexibility that Excel’s powerful tools provide.
If you’re looking for professional-grade analysis and visuals, Excel’s advanced pivot tables and charts make it the go-to choice.
10. Formulas
Do Excel formulas work in Google Sheets? Many formulas work in both Excel and Google Sheets, but some are exclusive to each platform.
A common Excel formula like = SUM (A1:A10) works the same in Google Sheets.
However, an Excel-specific function like =XLOOKUP (A1, B1:B10, C1:C10) does not work in Google Sheets, which instead would use = ARRAYFORMULA (IFERROR(VLOOKUP(A1, B1:C10, 2, FALSE))) as an alternative.
You might like: Free Excel Formulas
- Google Sheets Exclusive Formulas: ARRAYFORMULA, GOOGLETRANSLATE, IMPORTRANGE
- Excel Exclusive Formulas: XLOOKUP, FILTER, LET, LAMBDA, and advanced statistical and financial functions
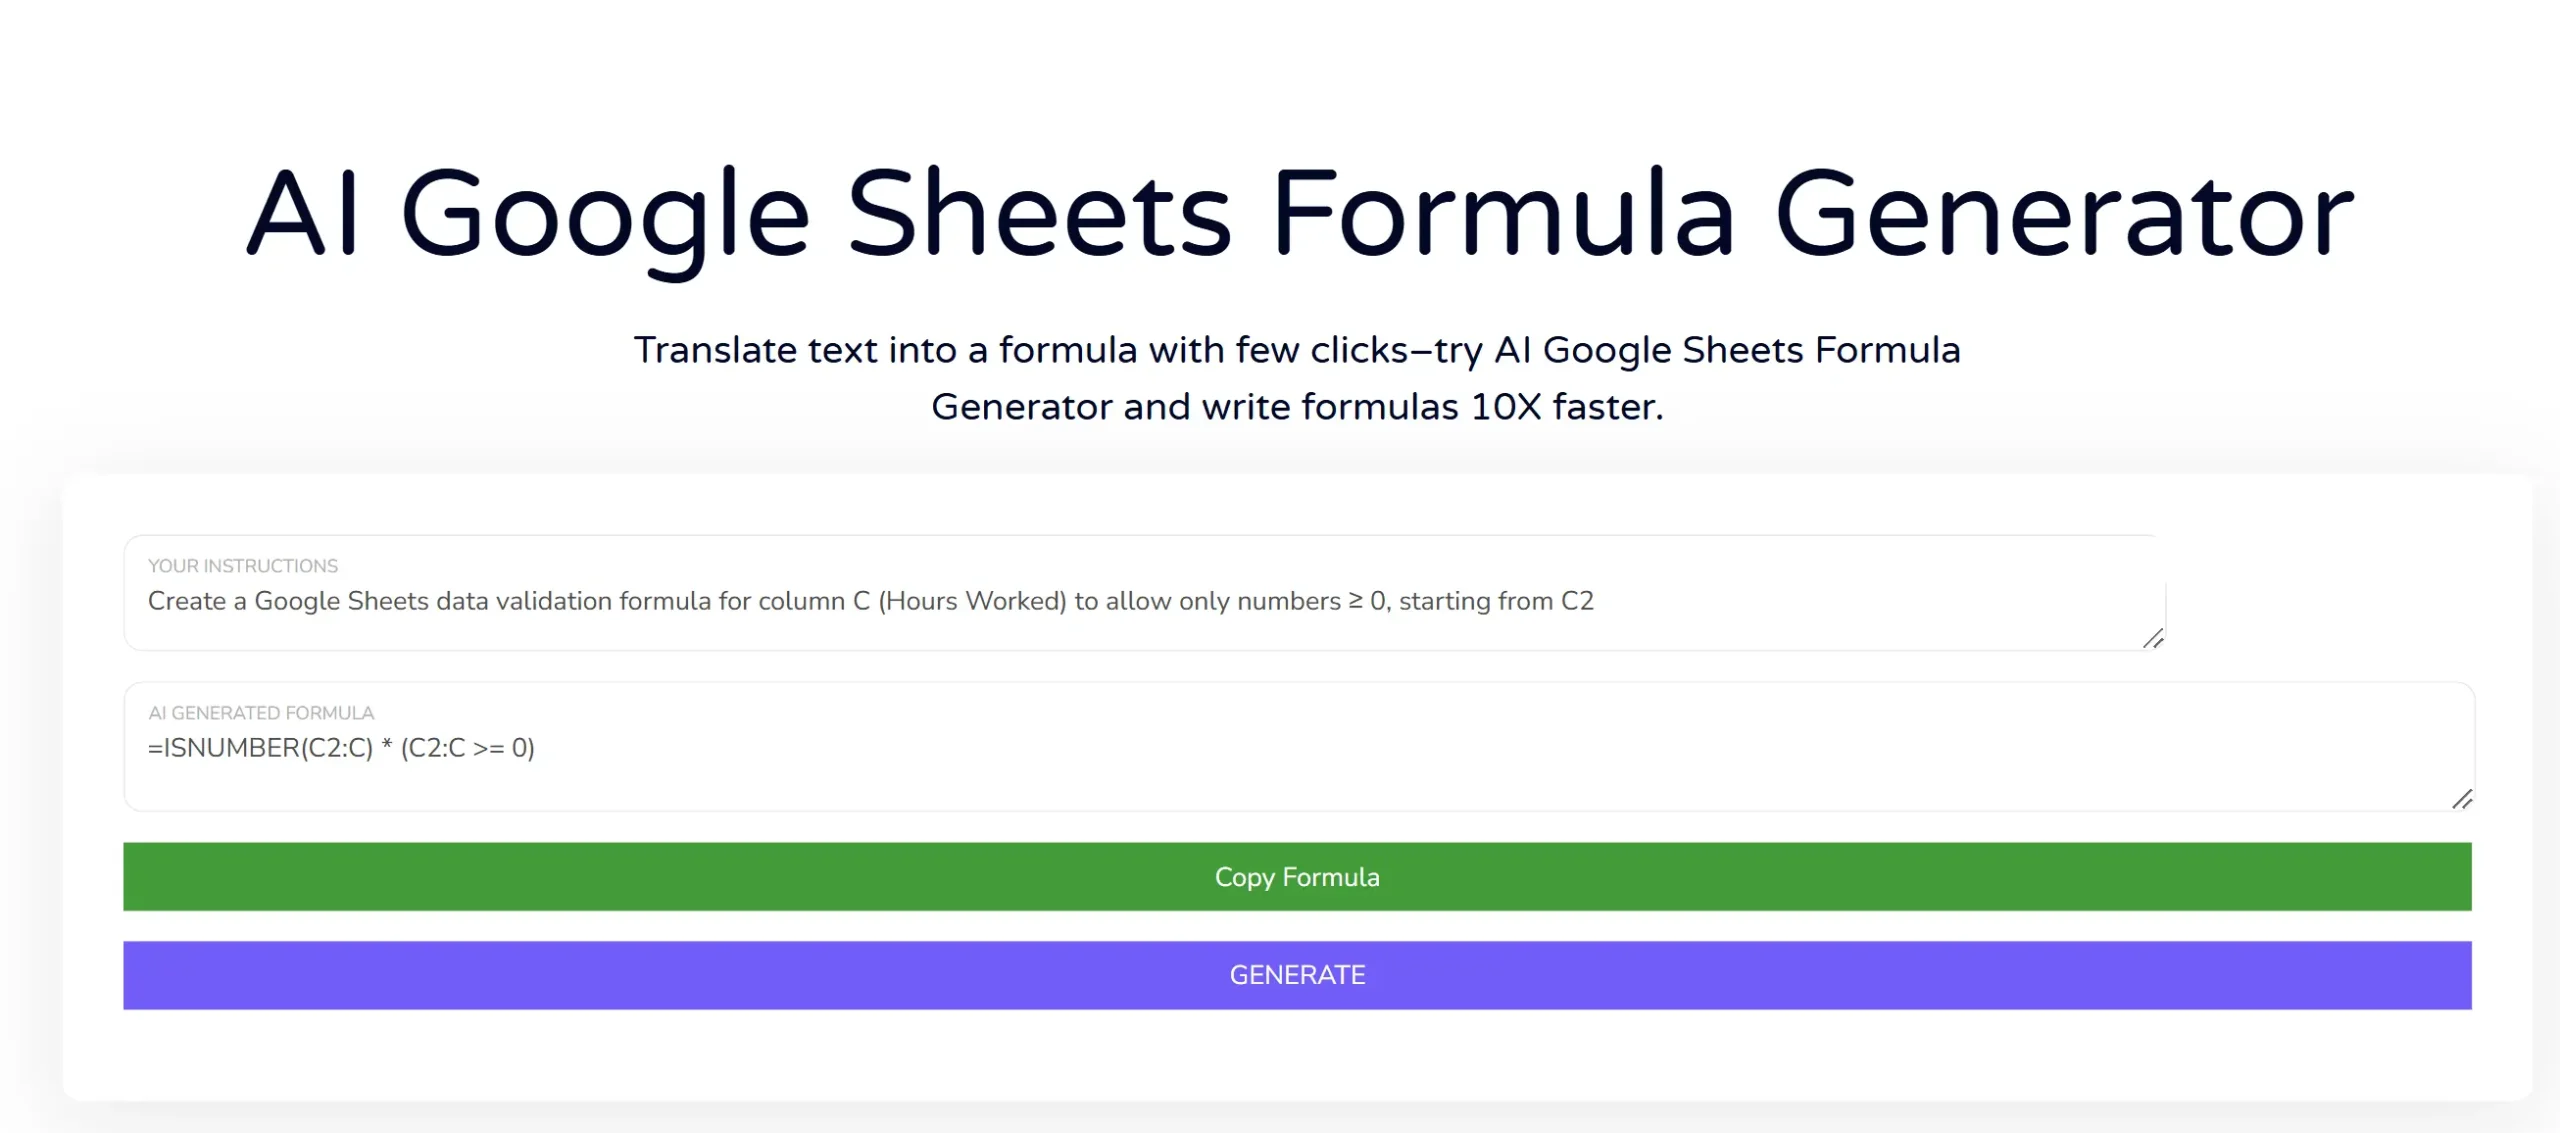
If formulas often cause you a headache, consider using Ajelix AI formula generators designed for Google Sheets and Excel.
You can try both of them for free. No need to register. (An absolute win-win!)
Here’s a screenshot of AI Formula Generator in action:
11. Shortcuts
Excel and Google Sheets also have different shortcut systems.
Excel’s shortcut system is a game-changer for power users. With shortcuts like Ctrl + Arrow keys for fast navigation and Alt + E, S, V to paste values, you can work seamlessly without touching the mouse. Advanced functions like data sorting, formatting, and editing are lightning-fast with just a few keystrokes.
Check out these 7 Excel shortcuts we use to speed up our work:
Google Sheets also has shortcuts, like Ctrl + Shift + V for pasting values, but it doesn’t offer the same level of keyboard-driven efficiency as Excel. Navigating large datasets or executing complex functions requires more mouse use in Sheets.
In short, Google Sheets shortcuts are fine for basic tasks but Excel’s extensive shortcuts are built for users who need to get things done quickly and efficiently.
Conclusion
In the ongoing debate of Google Sheets vs. Microsoft Excel, it’s essential to understand that both serve as great platforms for creating spreadsheets but some differences set these two powerful tools apart.
In short,
- Choose Google Sheets if: You need cloud-based collaboration, lightweight tasks, and automatic saving.
- Choose Excel if: You work with large datasets, and need powerful automation, advanced charting, and superior performance.
Main tip? Don’t focus on the question if Google Sheets is better than Excel but try to determine which is more suited to you and your specific requirements.
No doubt that in the 21st century Excel and Google Sheets must be used alongside AI-driven tools. Consider using AI Template Generator that builds professional templates or AI Formula Generator that translates text into Google Sheets formula.
Learn more about Excel and Google Sheets hacks in our other articles!
Want to stay in the loop and receive more daily tips and tricks? Sure, let’s stay connected.
FAQ
It depends on your needs—Google Sheets is best for teamwork and accessibility, while Excel is better for advanced data analysis and large datasets.
No, Google Sheets is better for collaboration and cloud-based work, while Excel is more powerful for complex data handling and offline use.
Both Excel and Google Sheets make it easy to create basic dropdown lists, but Excel offers more advanced options like dynamic named ranges and better validation features.
Yes, Google Sheets is free with a Google account, whereas Excel requires a paid Office 365 subscription for full access to features.
AI-powered tools can automate repetitive tasks, generate formulas, debug scripts, and enhance productivity by streamlining data management.
Speed up your spreadsheet tasks with Ajelix AI in Excel