15 KPIs For Construction Project: Construction KPIs Examples

Construction KPIs are measurable values that track a project’s performance across various aspects like budget, schedule, safety, and quality. Construction project managers just like any other manager need key performance indicators (KPIs) to follow up on progress and act as their guiding lights. 💡
Tight deadlines, fluctuating budgets, and diverse stakeholder interests create a demanding environment where success hinges on clear visibility and informed decision-making. That’s the life of construction business where the need for metrics is obvious.
In this blog post, we’ll delve into the essential KPIs for construction project management. We’ll explore how they help you:
- Conquer Time and Budget Battles: Stay ahead of the curve and identify deviations before they derail your project.
- Follow budget spending: Make sure the project aligns with the resources.
- Guarantee Quality and Safety: Deliver a flawless structure while keeping everyone safe and sound.
- Boost Communication and Collaboration: Align everyone’s expectations and foster a unified team spirit.
- Prove Your Value and Drive Improvement: Showcase your success and pave the way for future triumphs.
Change the way you work with agentic AI
One-click dashboards,KPI tracking, and AI-powered insights—for work that actually gets done.

List With 15 KPIs for Construction Project Management
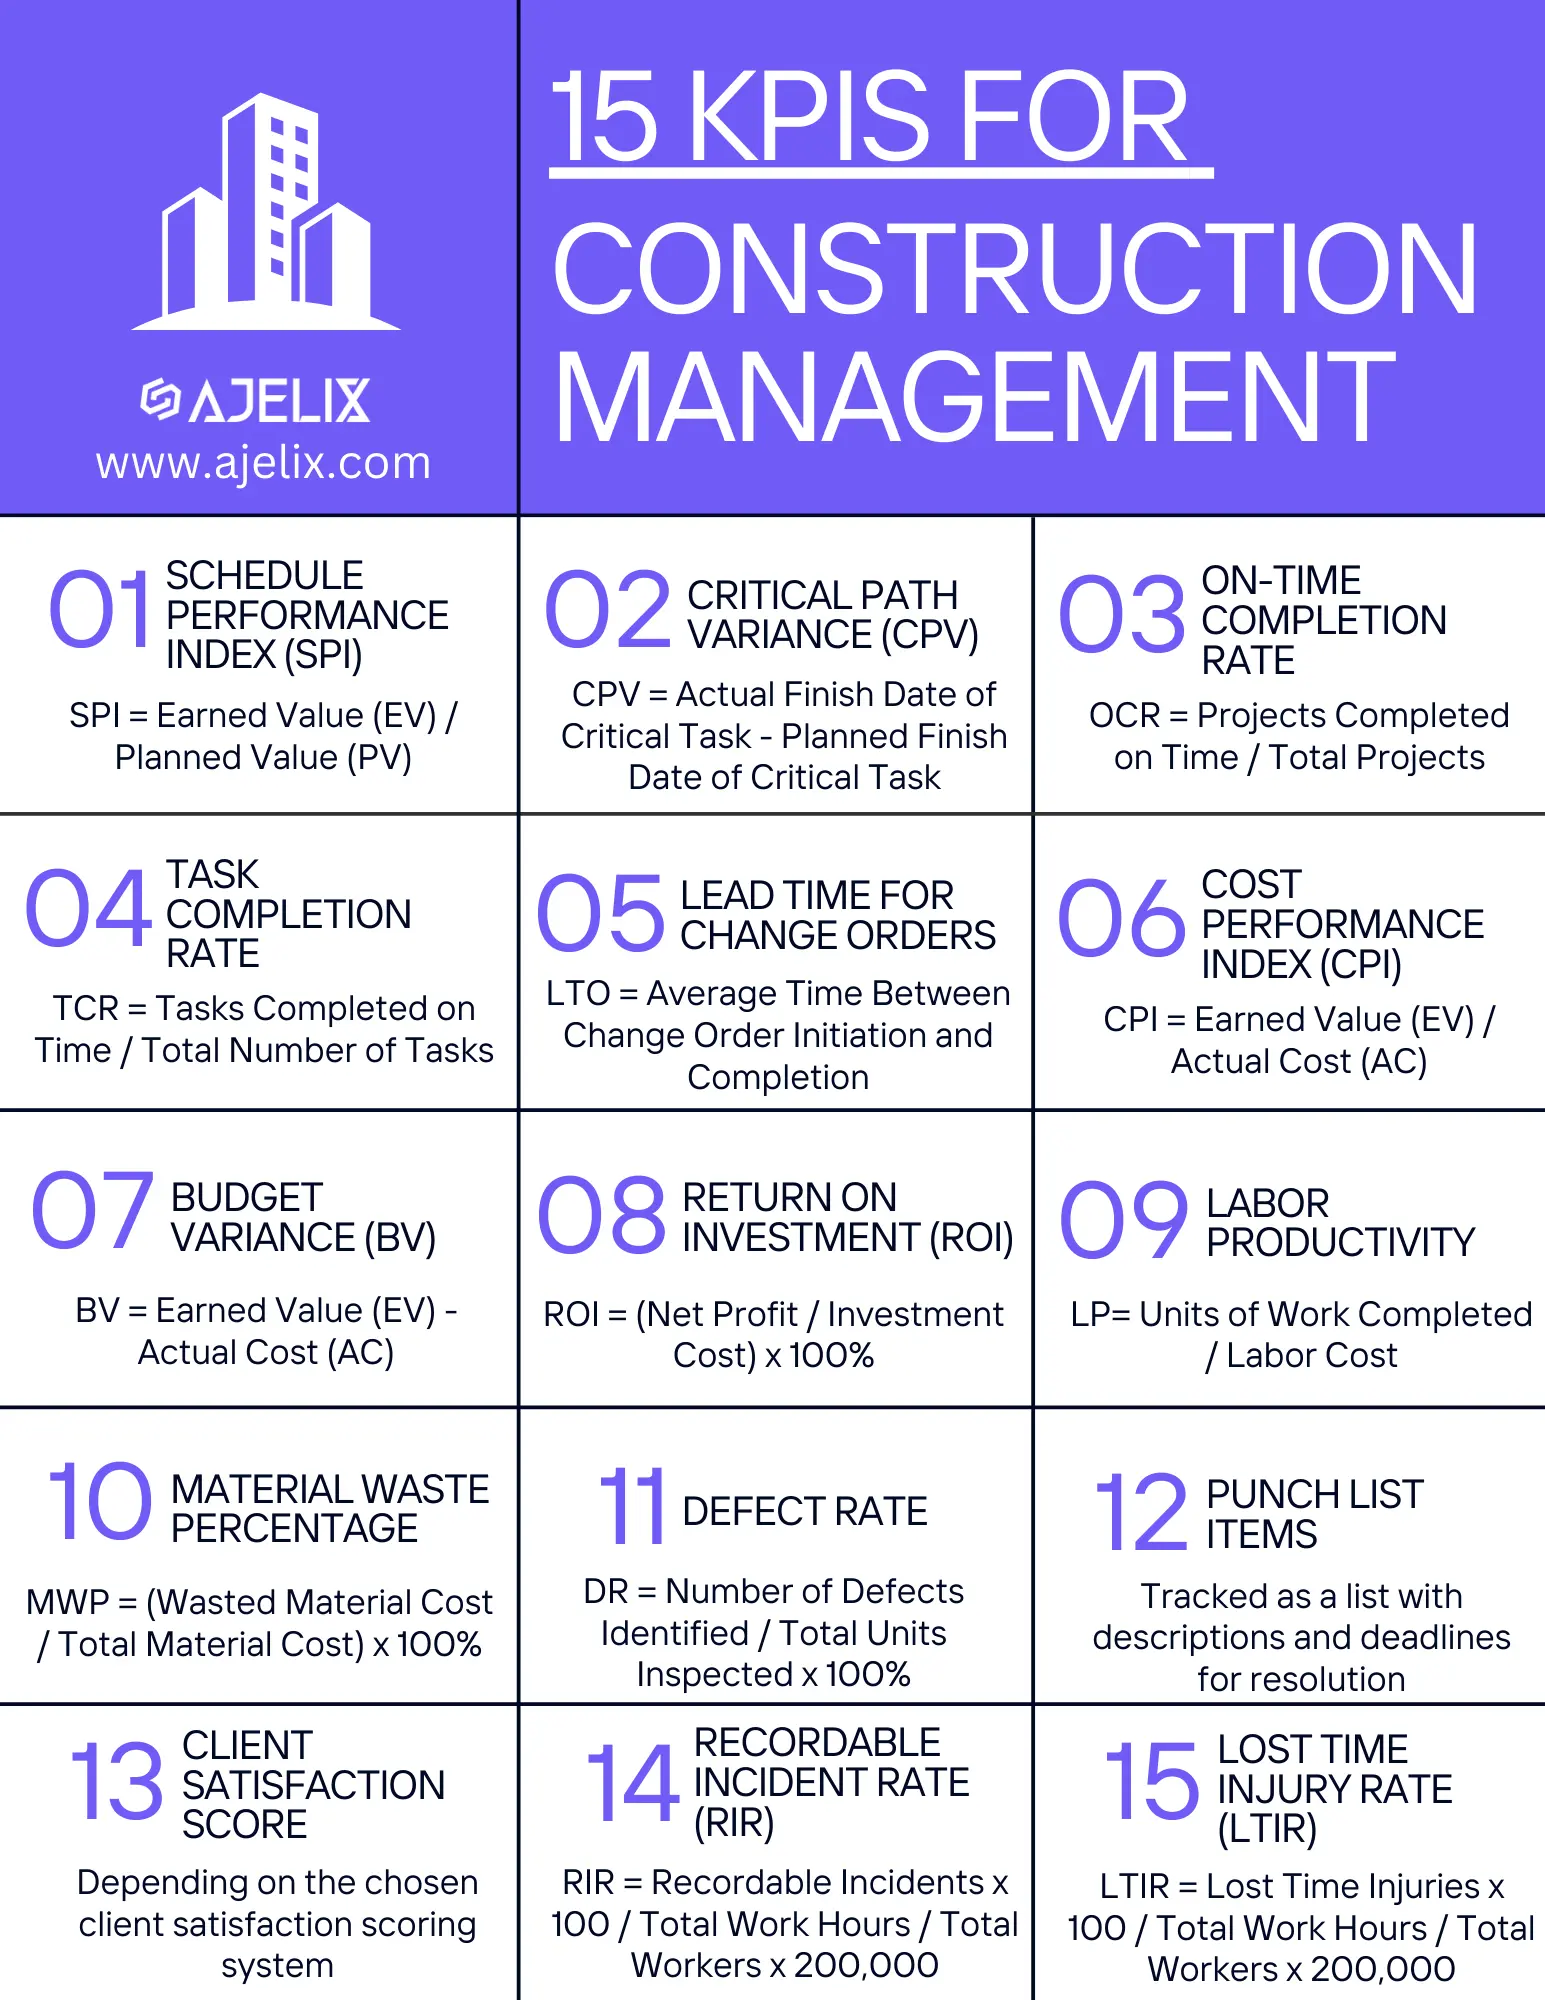
15 KPIs every construction project manager should track, infographic by author
- Schedule Performance Index (SPI): Measures adherence to the planned schedule (above 1 = on track, below 1 = delayed).
- Critical Path Variance (CPV): Tracks progress on critical tasks, highlighting potential delays.
- On-Time Completion Rate: Measures successful project delivery according to the planned timeline.
- Task Completion Rate: Tracks individual task progress and identifies potential bottlenecks.
- Lead Time for Change Orders: Monitors change order processing speed to minimize project disruptions.
- Cost Performance Index (CPI): Evaluates adherence to the project budget (above 1 = under budget, below 1 = over budget).
- Budget Variance (BV): Quantifies cost overruns or underruns, enabling timely corrective actions.
- Return on Investment (ROI): Assesses the project’s profitability and overall financial success.
- Labor Productivity: Measures labor efficiency, highlighting areas for improvement to optimize costs.
- Material Waste Percentage: Tracks material waste to minimize costs and promote sustainable practices.
- Defect Rate: Measures the number of defects identified, allowing for proactive quality control interventions.
- Punch List Items: Tracks unresolved quality issues before final handover, ensuring project completion meets standards.
- Client Satisfaction Score: Gauges client satisfaction with the project’s quality and overall experience.
- Recordable Incident Rate (RIR): Measures work-related injuries and illnesses, highlighting areas for safety improvement.
- Lost Time Injury Rate (LTIR): Tracks the severity of work-related injuries and lost workdays, emphasizing the importance of a safe work environment.
Remember: These are just examples, and the specific KPIs you choose will depend on your project’s unique characteristics and goals.
Struggling with manual calculations & tiring setups?
Let agentic AI do the heavy lifting.
Start free
Fast sign up & easy setup
1. Time Management KPIs in Construction
Time is money in construction, and managing it effectively is crucial for project success. This chapter delves into five key performance indicators (KPIs) specifically designed to monitor and optimize time management in your construction endeavors.
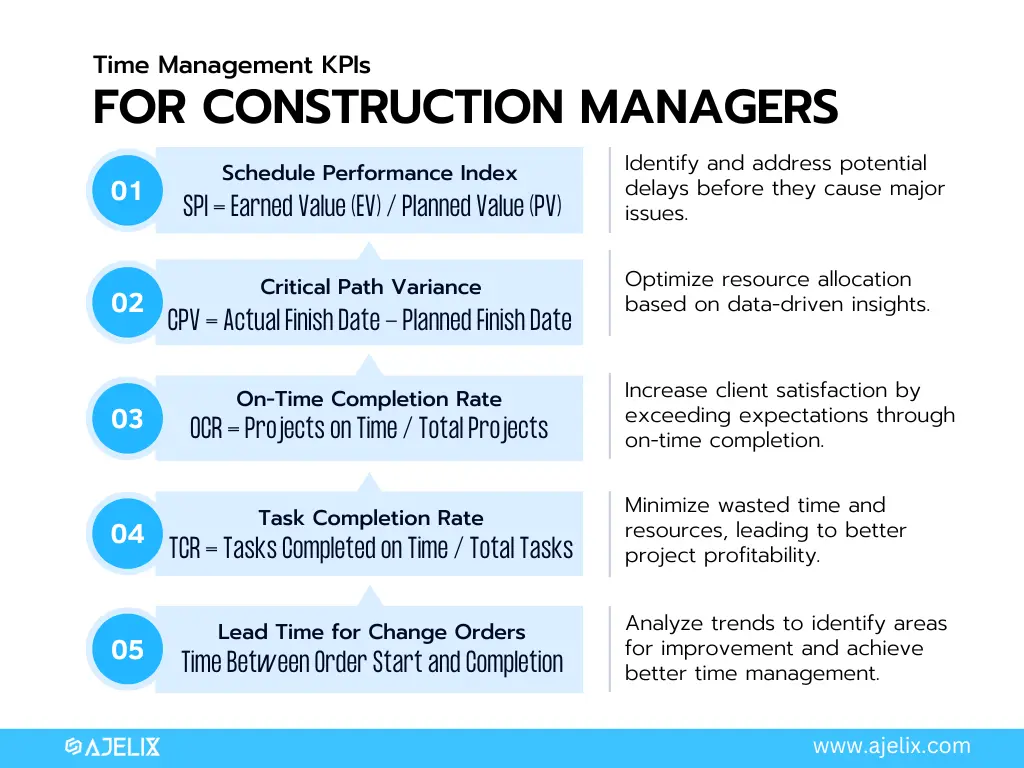
Infographic with 5 KPIs for construction project time management, created by author
1.1. Schedule Performance Index (SPI):
Measures how well the project adheres to the planned schedule. Values above 1 indicate progress ahead of schedule, while values below 1 signify delays.
SPI = Earned Value (EV) / Planned Value (PV)Example: Consider a project with an EV of $50,000 and a PV of $45,000 at a specific point in time. The SPI would be 50,000 / 45,000 = 1.11, implying progress exceeding the schedule.
Industry Benchmark: A “good” SPI varies depending on project complexity and size. Generally, an SPI above 0.95 indicates good schedule adherence, while values below 0.8 raise concerns about potential delays.
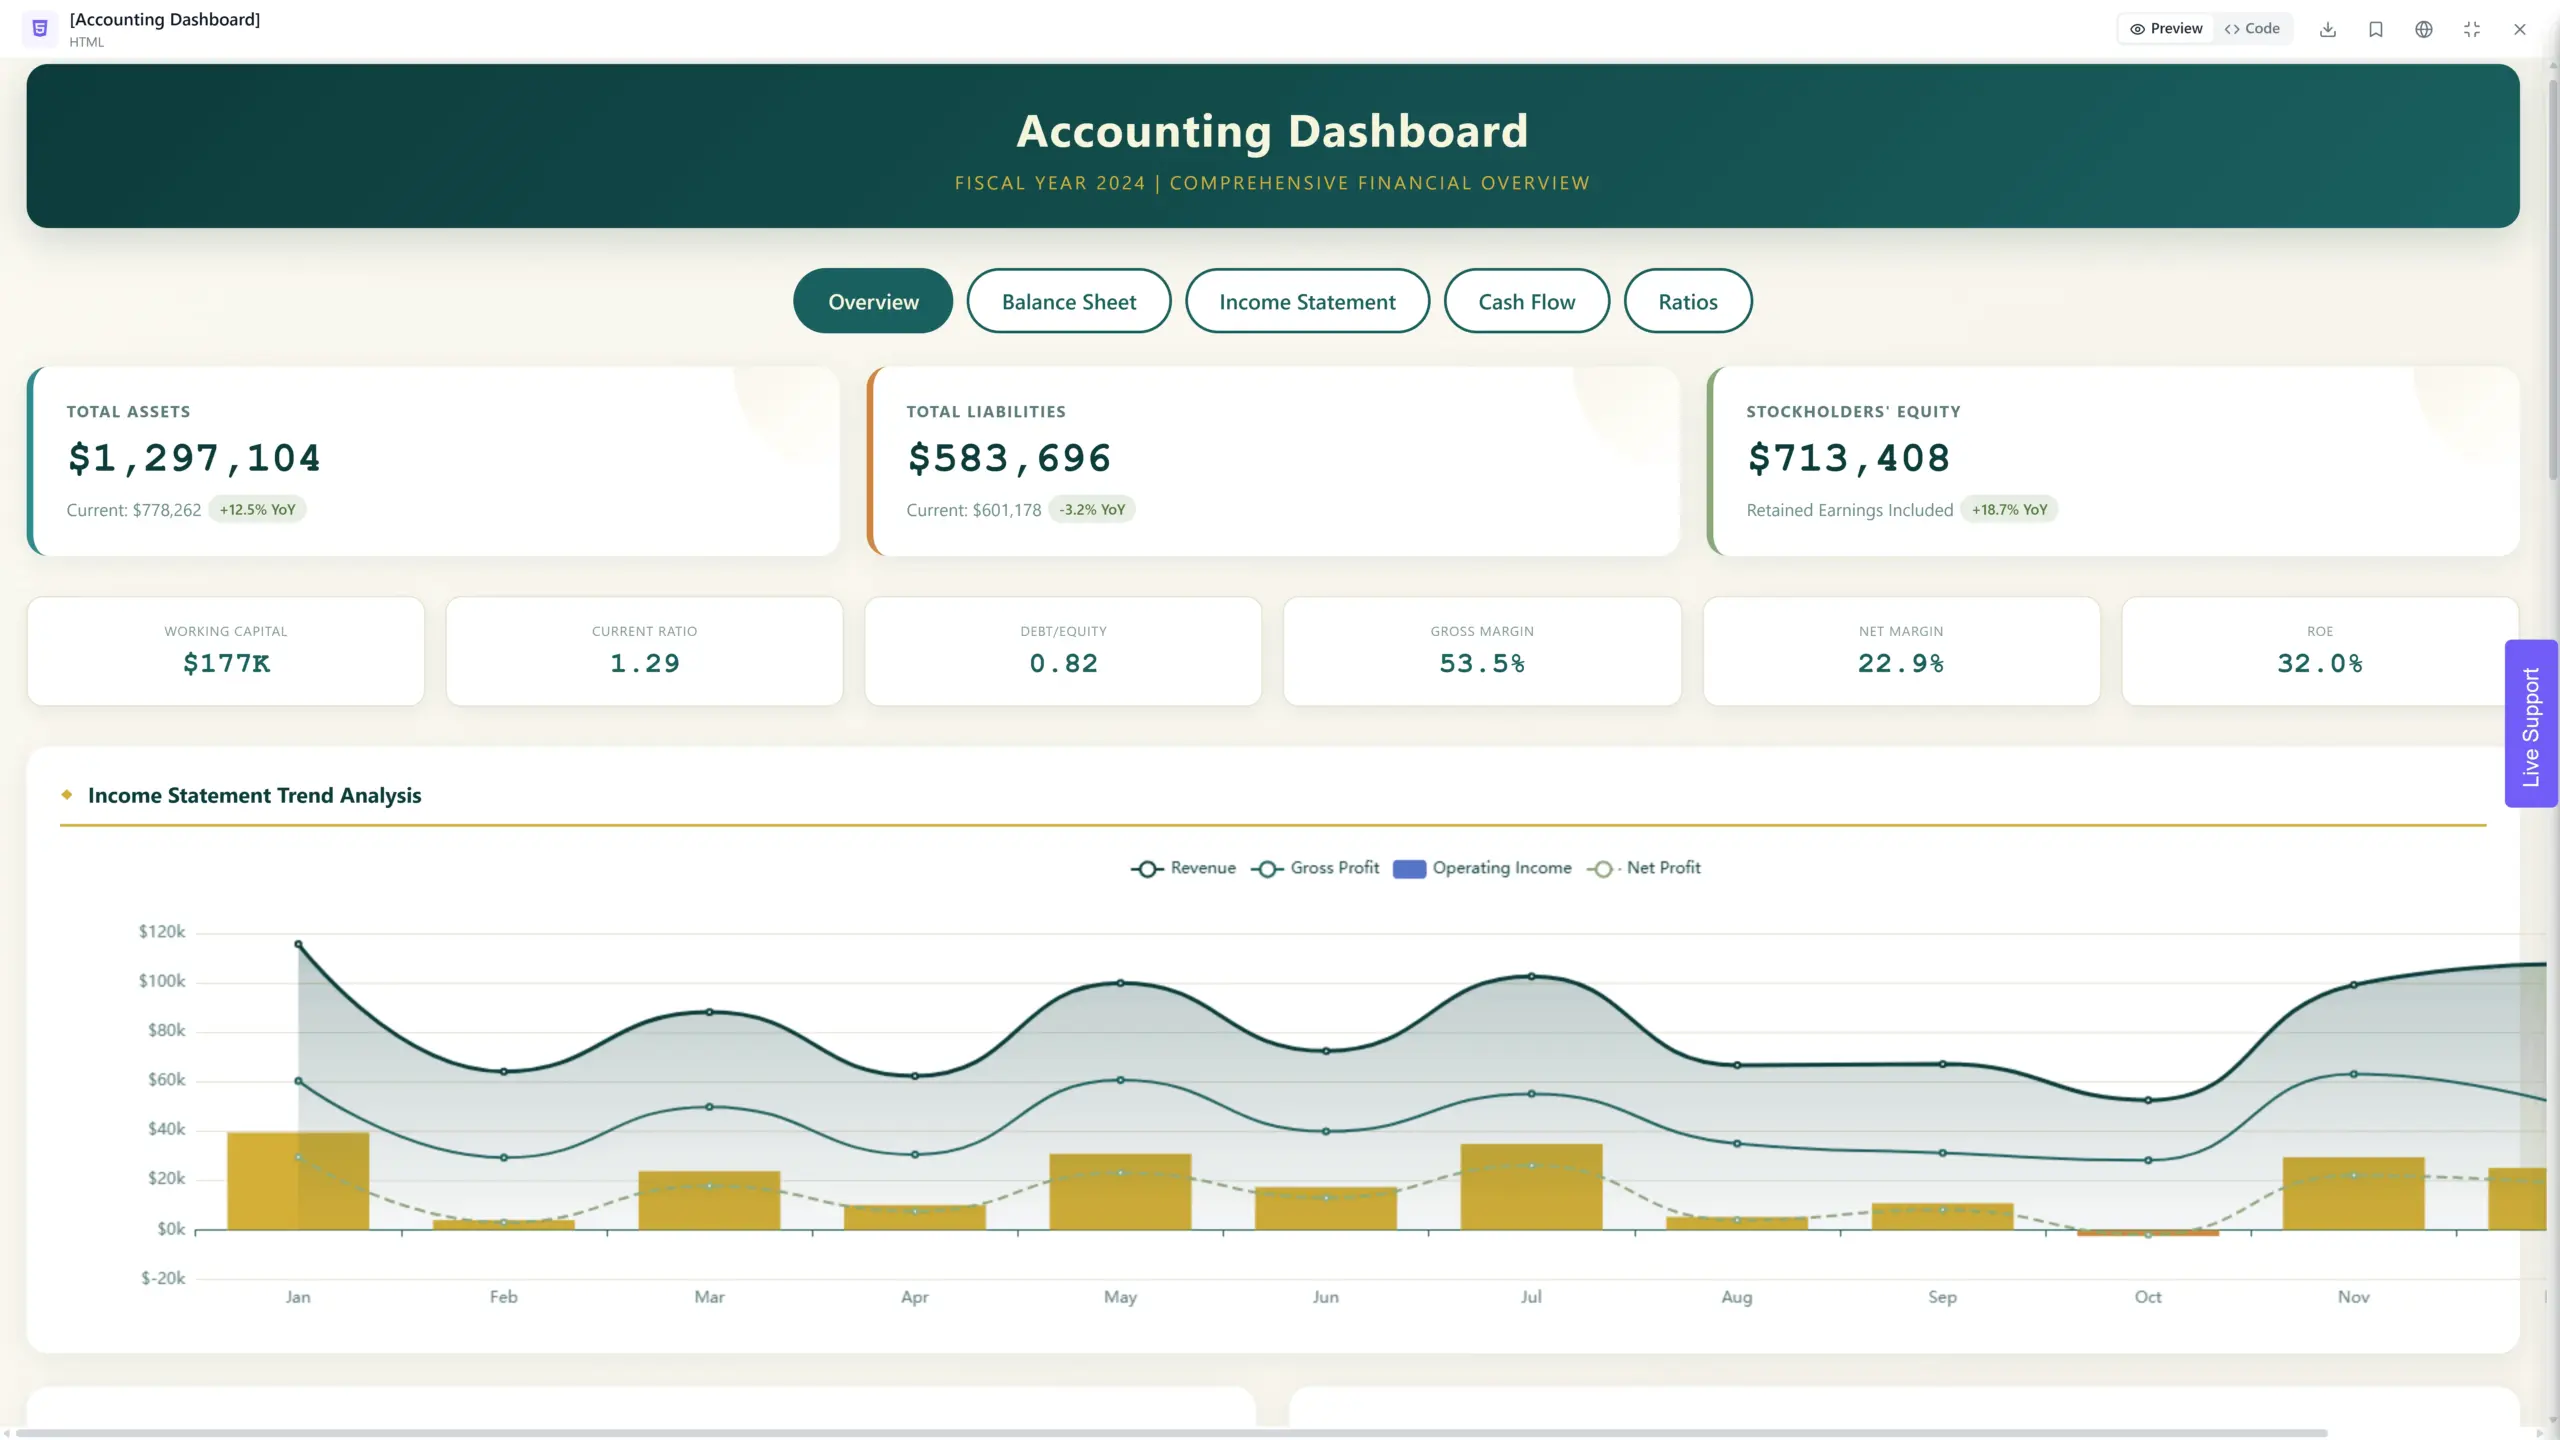
Great way to measure and calculate metrics is using business intelligence tools that let you track and share data dashboards in real time.
1.2. Critical Path Variance (CPV):
Tracks the difference between the planned and actual finish dates of critical tasks, highlighting potential schedule impacts. Negative values indicate delays, while positive values suggest early completion.
CPV = Actual Finish Date of Critical Task - Planned Finish Date of Critical TaskExample: A critical task scheduled to finish on Day 30 actually finishes on Day 35. The CPV would be 35 – 30 = 5 days, signaling a 5-day delay that could impact the overall project timeline.
Industry Benchmark: A CPV of 0 indicates the critical task is on track. Ideally, CPV should be kept as close to 0 as possible, but small positive or negative values within a few days may be acceptable depending on project buffer and mitigation strategies.
1.3. On-Time Completion Rate:
Measures the percentage of projects delivered within the planned schedule timeframe.
On-Time Completion Rate = Number of Projects Completed on Time / Total Number of ProjectsExample: If a company completes 10 out of 15 projects on time, their On-Time Completion Rate would be 10 / 15 = 66.7%.
Industry Benchmark: The desired On-Time Completion Rate can vary depending on project type and complexity. However, achieving rates above 80% reflects strong time management practices.
1.4. Task Completion Rate:
Tracks the percentage of individual tasks completed within the planned timeframe.
Task Completion Rate = Number of Tasks Completed on Time / Total Number of TasksExample: If a project has 100 tasks and 85 are completed on schedule, the Task Completion Rate would be 85 / 100 = 85%.
Industry Benchmark: A “good” Task Completion Rate depends on the complexity and number of tasks. However, aiming for rates above 80% signifies efficient task management and adherence to the detailed schedule.
1.5. Lead Time for Change Orders:
Measures the average time taken to process and implement change orders, reflecting responsiveness to project adjustments.
Lead Time for Change Orders = Average Time Between Change Order Initiation and CompletionExample: If a company analyzes 20 change orders and finds the average processing time is 5 days, their Lead Time for Change Orders would be 5 days.
Industry Benchmark: Ideally, minimize Lead Time for Change Orders while balancing thorough review and implementation. Aiming for less than 7 days is considered good practice, with further optimization depending on project complexity and impact of change orders.
By effectively monitoring and analyzing these time management KPIs, construction project managers gain valuable insights to identify potential delays, optimize resource allocation, and ultimately deliver projects on time and within budget.
2. Budget Management KPIs in Construction
Construction thrives on efficiency, and nowhere is this more crucial than in managing finances. Budget Management KPIs serve as your financial compass, offering clear insights into how well your project adheres to its budget and highlighting areas for potential cost optimization.
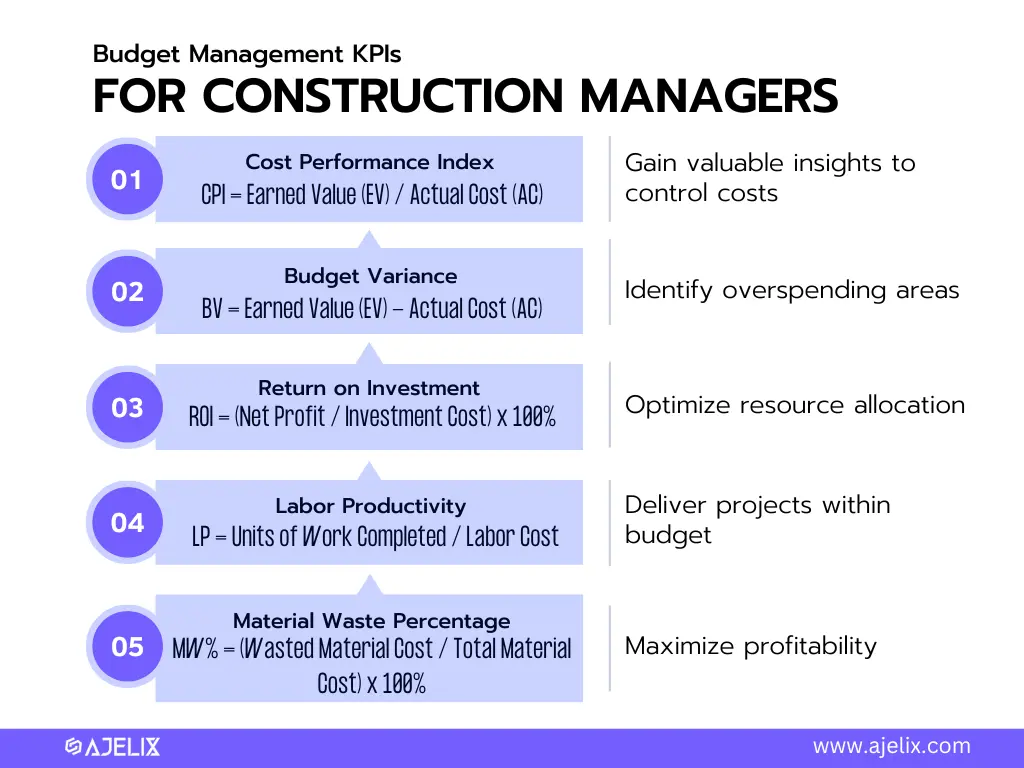
Infographic with 5 budget management KPIs for construction managers, picture by author
2.1. Cost Performance Index (CPI):
Measures how well the project adheres to the planned budget. Values above 1 indicate spending under budget, while values below 1 signify cost overruns.
CPI = Earned Value (EV) / Actual Cost (AC)Example: Consider a project with an EV of $50,000 and an AC of $45,000 at a specific point in time. The CPI would be 50,000 / 45,000 = 1.11, implying you’re spending less than planned.
Industry Benchmark: A “good” CPI varies depending on project complexity and size. Generally, a CPI above 0.95 indicates good budget adherence, while values below 0.8 raise concerns about potential cost overruns.
2.2. Budget Variance (BV):
Quantifies the difference between your planned budget and actual costs, highlighting specific areas of overspending or underspending.
BV = Earned Value (EV) - Actual Cost (AC)Example: Using the same example as before, the BV would be 50,000 – 45,000 = $5,000, indicating you’re currently $5,000 under budget.
Industry Benchmark: Ideally, aim for a zero BV, signifying perfect alignment with the planned budget. However, small positive or negative variances within a few percent of the total budget are generally acceptable.
2.3. Return on Investment (ROI):
Assesses the project’s overall financial success, measuring the profit generated in relation to the initial investment.
ROI = (Net Profit / Investment Cost) x 100%Example: If a project with a $1 million investment generates a net profit of $200,000, the ROI would be (200,000 / 1,000,000) x 100% = 20%.
Industry Benchmark: Industry-specific benchmarks for ROI can vary greatly. However, aiming for a positive ROI that exceeds your required minimum acceptable return is crucial for project financial success.
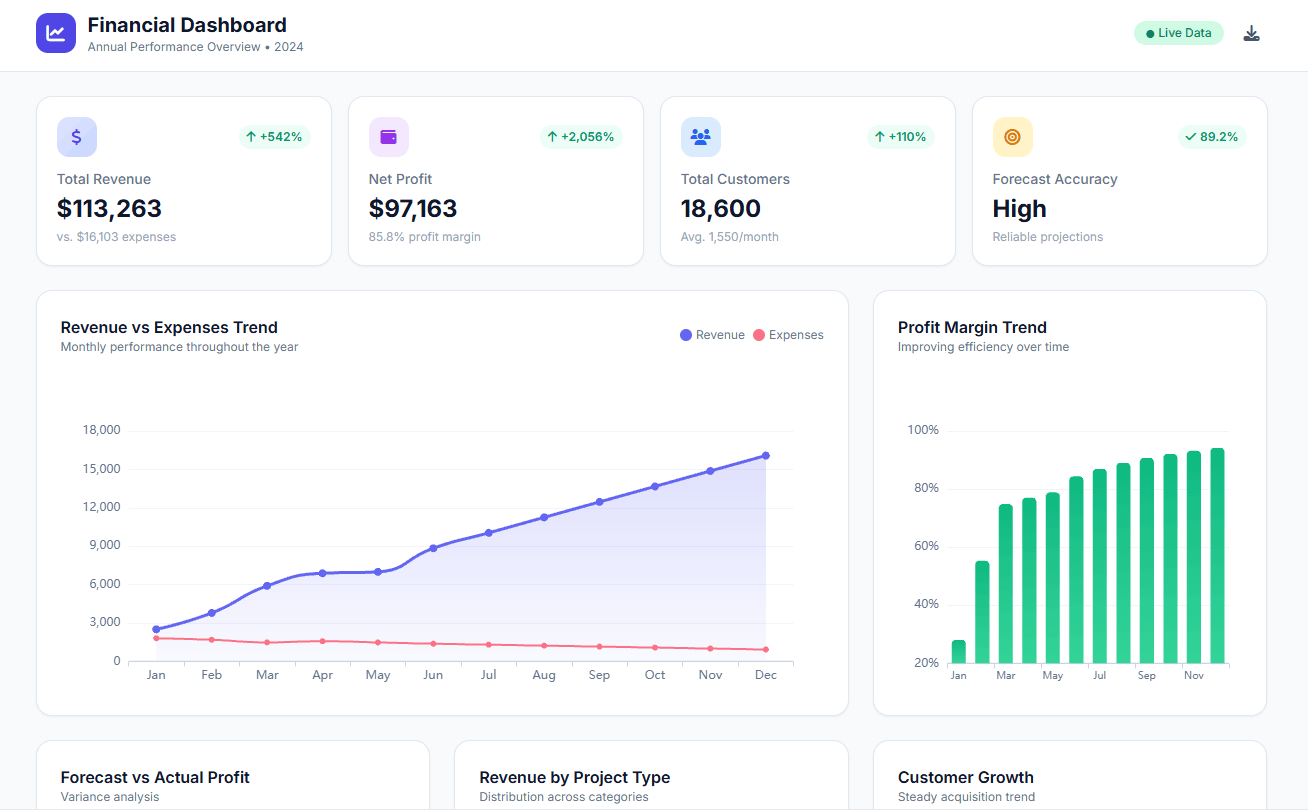
Not sure how to start tracking financial data for your project? Ajelix might be the answer – with easy to use editor you can create visualization for any construction project. Take a look below 👇
2.4. Labor Productivity:
Measures the output of labor in relation to its cost, highlighting areas for potential efficiency improvements.
Labor Productivity = Units of Work Completed / Labor CostExample: If a team completes 100 units of work at a total labor cost of $5,000, the Labor Productivity would be 100 units / $5,000 = 0.02 units per dollar.
Industry Benchmark: Benchmarks for labor productivity differ significantly across construction trades and project types. However, focusing on continuous improvement and comparing your results to internal historical data or industry best practices is key to optimizing labor efficiency.
2.5. Material Waste Percentage:
Tracks the percentage of materials wasted during construction, reflecting potential cost inefficiencies and sustainability concerns.
Material Waste Percentage = (Wasted Material Cost / Total Material Cost) x 100%Example: If a project spends $10,000 on materials and incurs $1,000 in waste, the Material Waste Percentage would be (1,000 / 10,000) x 100% = 10%.
Industry Benchmark: The acceptable Material Waste Percentage varies based on project type and materials used. However, striving to minimize waste through proper planning, accurate ordering, and improved onsite practices is vital for cost efficiency and sustainability.
By effectively monitoring and analyzing these metrics you can:
- gain valuable insights to control costs
- identify overspending areas
- optimize resource allocation
- deliver projects within budget and maximize profitability.
3. Quality Management KPIs in Construction Project Management
Delivering a project that not only meets deadlines and stays within budget but also excels in quality is the ultimate goal of any construction project manager.
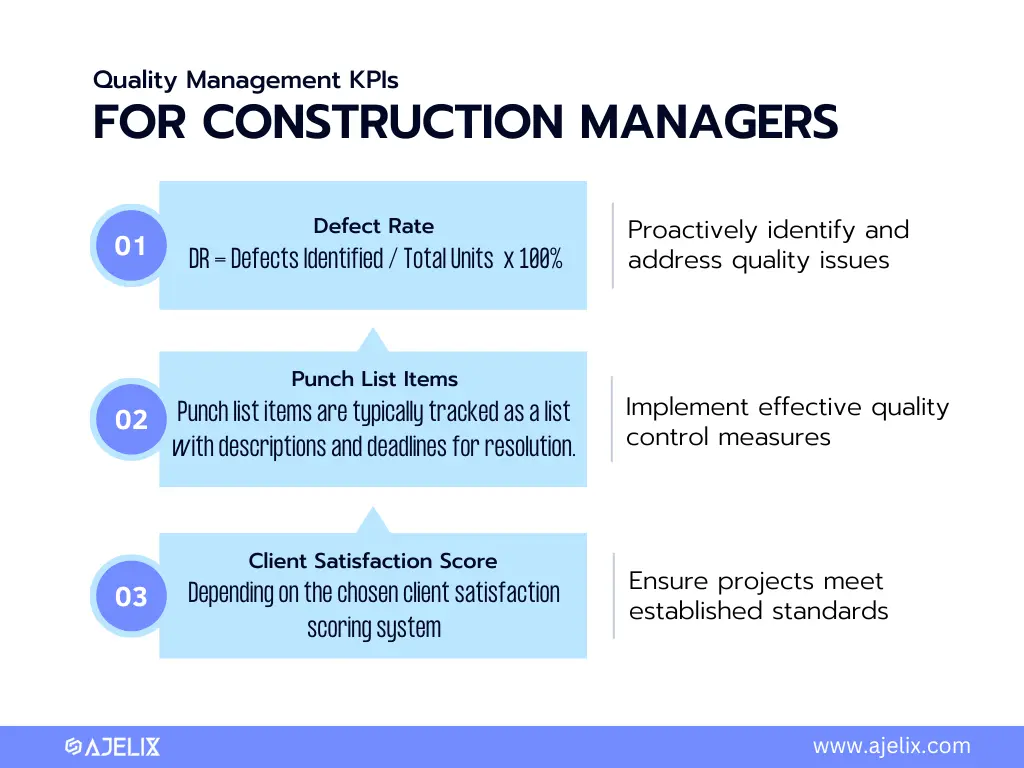
3 KPIs for construction managers infographic by author
Quality Management KPIs serve as your quality barometer, providing crucial insights into how well your project adheres to established standards.
3.1. Defect Rate:
Measures the number of defects identified during construction, including workmanship errors, material flaws, and deviations from specifications.
Defect Rate = Number of Defects Identified / Total Units Inspected x 100%Example: If 10 defects are identified after inspecting 200 building components, the Defect Rate would be 10 / 200 x 100% = 5%.
Industry Benchmark: Acceptable Defect Rates can vary depending on project complexity and specific standards. Generally, aiming for rates below 5% indicates good quality control, while consistently exceeding 10% raises concerns about potential quality issues.
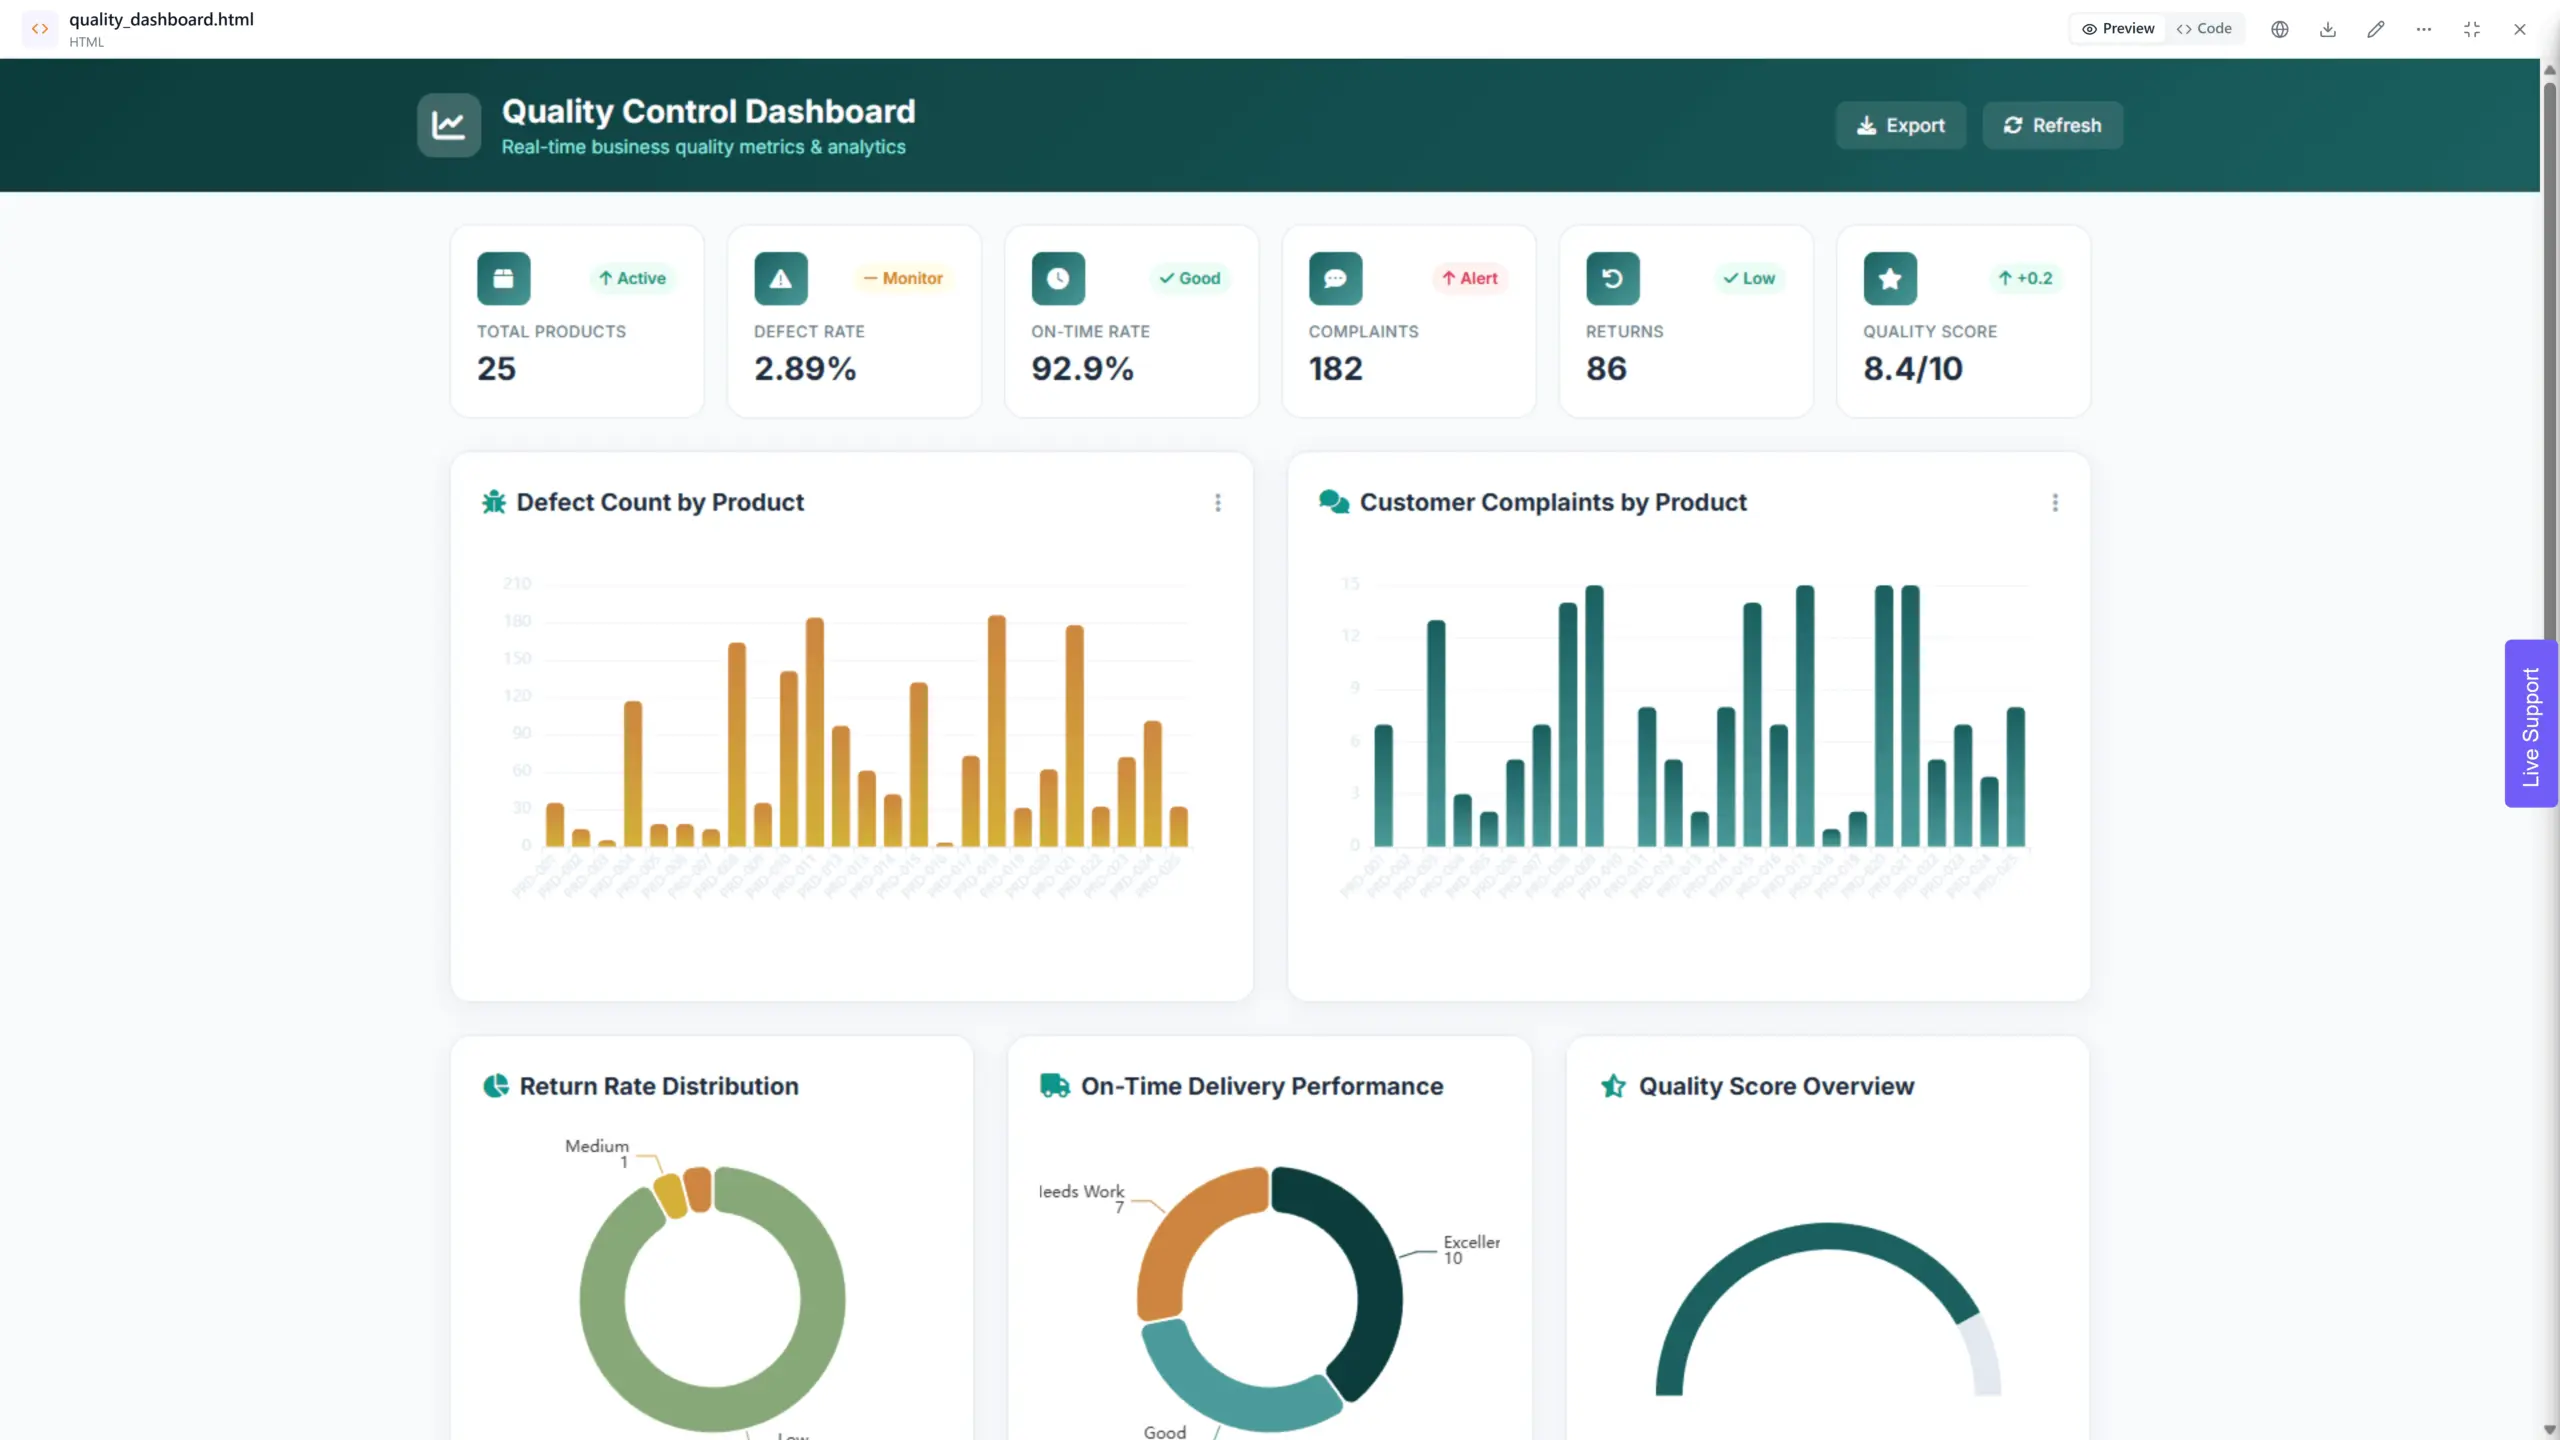
For better KPI tracking you can create a quality dashboard that will measure your metrics in real-time. Take a look at the example below.
3.2. Punch List Items:
Tracks the number of unresolved quality issues remaining before project handover, highlighting areas requiring rectification to meet specified standards.
No specific formula applies. Punch list items are typically tracked as a list with descriptions and deadlines for resolution.Example: A punch list might include 10 items ranging from minor painting touch-ups to resolving faulty electrical outlets.
Industry Benchmark: Ideally, minimize the number of punch list items before handover. Aiming for less than 20 punch list items per 1,000 square meters reflects good quality control, while larger numbers suggest potential quality concerns.
3.3. Client Satisfaction Score:
Gauges the client’s overall satisfaction with the project’s quality, measured through surveys, feedback forms, or specific scoring systems.
Varies depending on the chosen client satisfaction survey/scoring system.Example: A client satisfaction survey might use a 5-point scale (1 = Very Dissatisfied, 5 = Very Satisfied) to assess quality aspects like workmanship, adherence to specifications, and overall finish.
Industry Benchmark: Client satisfaction benchmarks can vary by project type and client expectations. However, aiming for scores above 4 on a 5-point scale generally indicates good client satisfaction with the project’s quality.
Benefits of monitoring and analyzing Quality Management KPIs:
- Proactively identify and address quality issues before they escalate into major problems.
- Implement effective quality control measures based on data-driven insights.
- Ensure projects meet established standards and deliver a quality product to clients.
- Boost client satisfaction and build positive relationships for future projects.
Remember, continuous improvement is key. Track trends in these KPIs over time, analyze industry best practices, and adapt your quality control processes to achieve even better results in future projects. To support continuous improvement and optimize project workflows, many managers implement processes using Six Sigma templates to systematically identify inefficiencies and address recurring challenges in construction projects.
4. Safety Management KPIs in Construction
In any construction project, the well-being of workers is paramount. Safety Management KPIs are crucial gauges, providing critical insights into your safety protocols and highlighting areas for improvement to create a safe and healthy work environment.
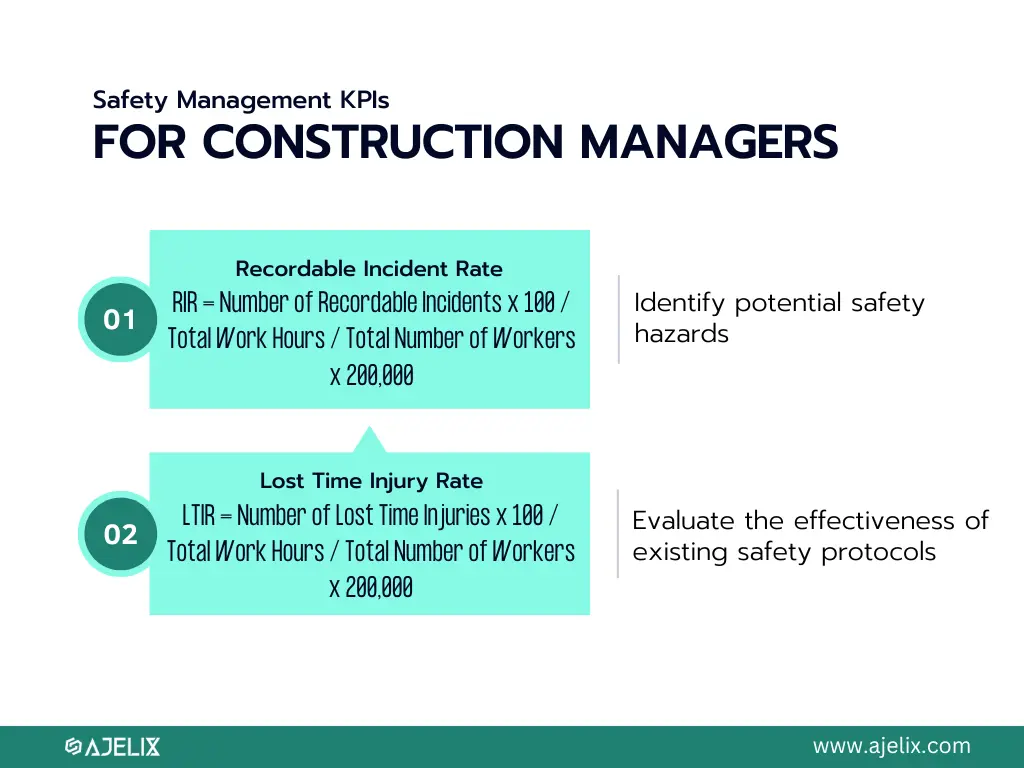
Infographic with 2 safety KPIs for construction management, picture by author
4.1. Recordable Incident Rate (RIR):
Measures the number of work-related injuries and illnesses per 100 full-time workers over a specific period (usually per year). It captures a broad range of incidents, including minor injuries, illnesses, and near misses.
RIR = Number of Recordable Incidents x 100 / Total Work Hours / Total Number of Workers x 200,000Example: If a project with 50 workers experiences 10 recordable incidents in a year (2,000 total work hours), the RIR would be (10 x 100) / (2,000 / 50) x 200,000 = 2.5.
Industry Benchmark: The Occupational Safety and Health Administration (OSHA) publishes industry-specific RIR benchmarks. Ideally, strive for an RIR significantly lower than the industry average for your specific sector. Continuously aiming for zero incidents should be the ultimate goal.
4.2. Lost Time Injury Rate (LTIR):
Measures the number of work-related injuries resulting in lost workdays per 100 full-time workers over a specific period, highlighting the severity of incidents and emphasizing the importance of preventive measures.
LTIR = Number of Lost Time Injuries x 100 / Total Work Hours / Total Number of Workers x 200,000Example: Using the same project example, if 2 of the 10 recordable incidents resulted in lost workdays, the LTIR would be (2 x 100) / (2,000 / 50) x 200,000 = 0.5.
Industry Benchmark: Similar to RIR, OSHA publishes industry-specific LTIR benchmarks. Aiming for an LTIR lower than the industry average and striving for zero lost time injuries are crucial for fostering a safe work environment.
Benefits:
- Identify potential safety hazards and implement proactive measures to address them.
- Evaluate the effectiveness of existing safety protocols and make data-driven decisions for improvement.
- Promote a culture of safety by highlighting the importance of safe work practices.
- Reduce the number of work-related incidents and create a safer environment for all workers.
Remember, safety is paramount. It’s not just about numbers on a spreadsheet; it’s about protecting lives and preventing injuries.
Download the Construction KPI Template
How to Manage KPIs in Construction Projects?
So, you’ve explored the essential KPIs across various aspects of your construction project. But simply having the data isn’t enough. The true power lies in effectively managing and utilizing these KPIs to optimize performance and achieve project success. Here’s your guide to mastering the art of KPI management:
1. Define Your Goals and Priorities
Start by establishing clear project goals and objectives. This sets the context for choosing relevant KPIs and ensures they align with your overall vision. Identify your priorities:
- is it on-time completion?
- staying within budget?
- or achieving exceptional quality?
Tailor your KPI selection accordingly. Get inspiration from our article about 20 KPIs for small business owners.
2. Set Realistic Targets and Benchmarks
Don’t just track KPIs aimlessly. Set measurable and achievable targets for each indicator based on:
- industry standards
- historical data
- or project-specific factors.
Use these targets to gauge progress and identify areas requiring improvement.
3. Establish a Data Collection and Monitoring System
Choose a method for gathering data to calculate your chosen KPIs. Utilize:
- project management software
- spreadsheets
- financial systems
- safety reporting tools
- quality control platforms
This will help you ensure accurate and consistent data collection. Automate where possible to minimize manual effort and errors.
If you don’t have any of these systems, that’s alright, you can start by collecting this information on Excel or Google Sheets that you can integrate with Ajelix and get live data updates and follow-up on progress.
Reporting gives you a headache?
Upload your data and create professional reports with agentic AI

Start free
Try free and upgrade whenever
4. Integrate KPIs into Decision-Making
Don’t let your KPIs gather dust in reports. Embed them into your decision-making process. Regularly review them during:
- team meetings
- project evaluations
- budget discussions
Use data-driven insights to identify trends, address deviations, and adjust strategies as needed. You can create a digital dashboard with Ajelix and share it with the team during these meetings.
5. Foster a Culture of Transparency and Collaboration
Share your KPIs with all project stakeholders – team members, clients, and subcontractors. Transparency promotes accountability and encourages collective ownership of project performance. Collaborate on solutions to address emerging challenges based on insights gleaned from the KPIs.
P.S. You can share Ajelix dashboards using links, passwords or adding email users.
6. Continuously Improve and Adapt
Remember, KPIs are not static; they evolve with your project. Regularly evaluate the effectiveness of your chosen KPIs and adapt them as needed.
- Analyze industry trends
- learn from best practices
- incorporate new indicators as your project progresses or your priorities shift.
7. Leverage Technology
Embrace BI tools like Ajelix to streamline data collection, automate KPI calculations, and generate insightful reports and visualizations. This empowers efficient data analysis, facilitates informed decision-making, and frees up valuable time for other project activities.
Conclusion
Construction project managers need key performance indicators (KPIs) to ensure clear visibility and informed decision-making. The essential KPIs for construction project management include time and budget battles, quality and safety, communication and collaboration, and proving value and driving improvement. To measure KPIs more easily use tools like Ajelix AI agent, you can start free by clicking on the banner below.
FAQ
Ideally, monitor KPIs regularly throughout your project lifecycle. Weekly or bi-weekly reviews are common, but adjust based on project pace and critical milestones.
– Time Management: Schedule Performance Index, On-Time Completion Rate, Task Completion Rate, Lead Time for Change Orders.
– Budget Management: Cost Performance Index, Budget Variance, Return on Investment, Labor Productivity, Material Waste Percentage.
– Quality Management: Defect Rate, Punch List Items, Client Satisfaction Score.
– Safety Management: Recordable Incident Rate, Lost Time Injury Rate
Tools like Ajelix, Power BI, Zoho Analytics are highly recommended. They automate data collection, calculate KPIs, and generate insightful reports and visualizations, saving you time and effort.
Ready to calculate KPIs with Ajelix?
From data to report in one minute or less with Ajelix AI Agents


