How To Calculate Revenue Growth Rate In Excel With Formula

The revenue growth rate is a performance indicator that shows if your sales efforts are yielding positive results. Tracking it over time is crucial to identify trends, pinpoint periods of acceleration or stagnation, and adjust your strategies accordingly.
TL;DR
Revenue growth rate shows how fast your revenue is increasing (or decreasing) by comparing one period to the previous one using (Current – Previous) ÷ Previous × 100. It helps track sales performance, spot trends, and adjust strategy. You can calculate it easily using the Ajelix AI data analyst to analyze data and perform financial analysis. YoY growth is simply the same formula applied year-to-year. What counts as a “good” growth rate varies by industry and company stage, startups may see 100%+, while established businesses often target 15–25%.
This guide provides a clear and concise approach to calculating your revenue growth rate. We’ll delve into the formula, walk you through the process in Excel with helpful screenshots, and offer practical tips for interpreting your results.
Change the way you work with agentic AI
One-click dashboards,KPI tracking, and AI-powered insights—for work that actually gets done.

What is the Revenue Growth Rate?
The Revenue Growth Rate is a metric that shows the percentage change in a company’s revenue over a specific period. In simpler terms, it tells you how much faster (or slower) your income is growing compared to a previous period.
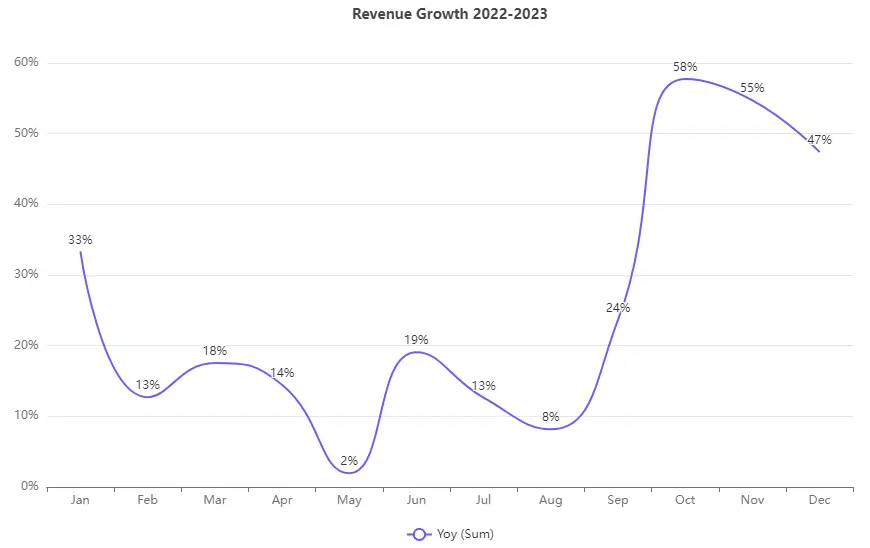
Example screenshot with revenue growth chart for years 2022-2023, image by author
This indicator is crucial for businesses to understand the success of the sales performance. Let’s take a look at the formula.
The Revenue Growth Rate Formula
(Current Revenue – Previous Revenue) / Previous Revenue * 100
- Current Revenue: The total income your business generated in the most recent period you’ve chosen (e.g., current month, quarter, or year).
- Previous Revenue: Total income your business generated in the previous period (e.g., month, quarter, or year).
- Division by Previous Revenue: The change in revenue relative to your starting point.
- Multiplication by 100: Converts the result from a decimal to a percentage, making it easier to interpret the growth rate.
Revenue Growth Example
To make things even clearer, imagine a scenario:
- Your company’s revenue for the current quarter is $27,000.
- In the same quarter last year, your revenue was $23,000.
Here’s the solution for this example:
- (Current Revenue – Previous Revenue) / Previous Revenue * 100
- ($27,000 – $23,000) / $23,000 * 100
- $5,000 / $23,000 * 100
- 0.17* 100 = 17.39%
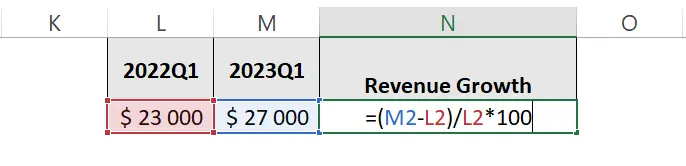
Solution screenshot in Excel with calculation steps, image by author
Your revenue growth rate for this quarter is 33.33%. This indicates a significant increase in sales compared to the same period last year.
In the next section, we’ll walk you through a step-by-step guide with screenshots to put this formula into practice!
How To Calculate Revenue Growth in Excel?
Time needed: 3 minutes
Here’s a step-by-step guide with screenshots to help you calculate your revenue growth rate in Excel:
- Prepare Your Data
Open a new Excel spreadsheet. In the first column (Column A), label the header as “Revenue” (or a similar descriptive title). In the second column (Column B), list your revenue figures for each period you want to compare. This could be monthly, quarterly, or annual revenue data.
- Choose Your Time Period
Decide which periods you want to compare. You can calculate the growth rate between any two data points in your list.
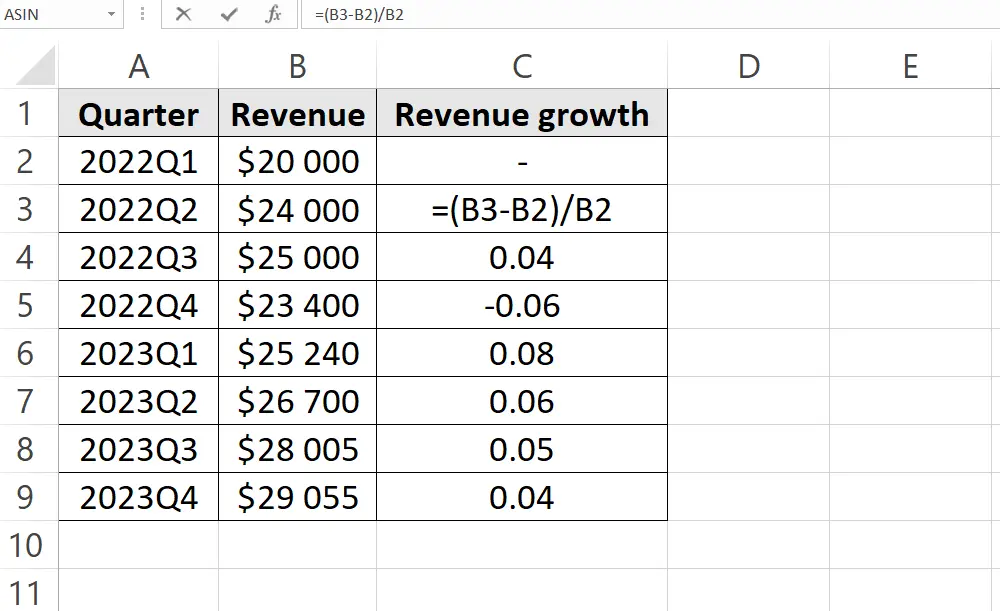
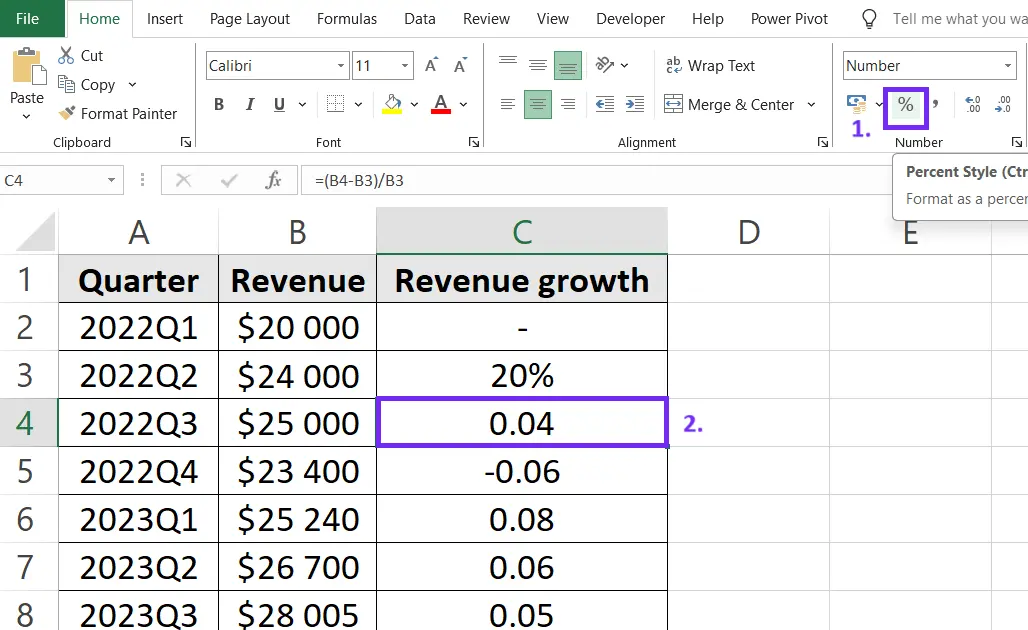
- Apply the Formula
In an empty cell (column C2), enter the formula to calculate the growth rate. Here’s the breakdown: =(B2 – A2) / A2 * 100 (if you want to format cell as % don’t multiply by 100)
- Format cell as the percentage
To format revenue growth as a percentage remove multiply action from the formula. Go to the Home tab Number section and click on the % sign to apply percentage formatting. If you didn’t remove multiplication then the percentage will be inaccurate.
- Analyze and Repeat
Analyze the calculated growth rate. In this example, a positive number indicates revenue growth, while a negative number indicates a decline.
Here’s video on how to calculate revenue growth in Excel:
Calculate Revenue Growth with Ajelix BI
Ajelix BI can be helpful with data visualization tasks and KPI calculations. BI platforms can help with data monitoring and ad hoc report creation as you can perform simple analytics tasks faster. Let’s see how non-technical teams can use Ajelix to calculate metrics and create a more trustworthy reporting process.
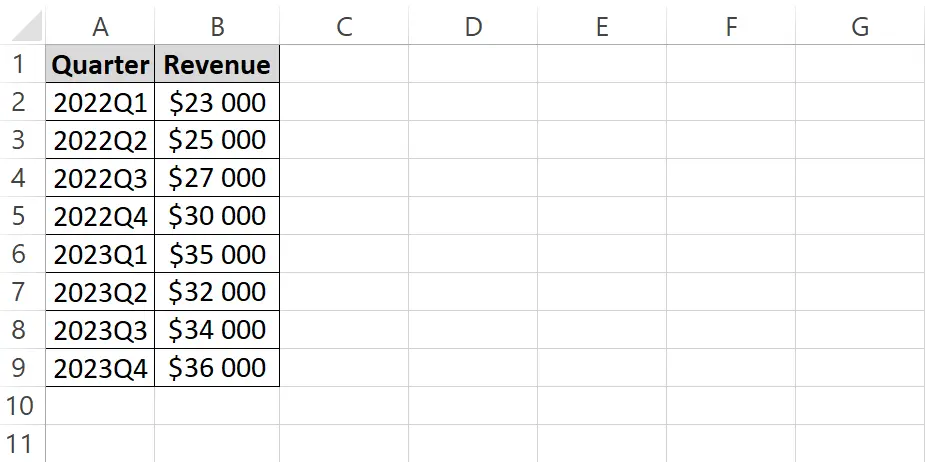
1. Prepare your data
First things first: get your data organized! This can be done in an Excel table or a Google Sheets file. We’ll use an example to show how to set up your data to easily track growth over a specific period, comparing the current year to the last.
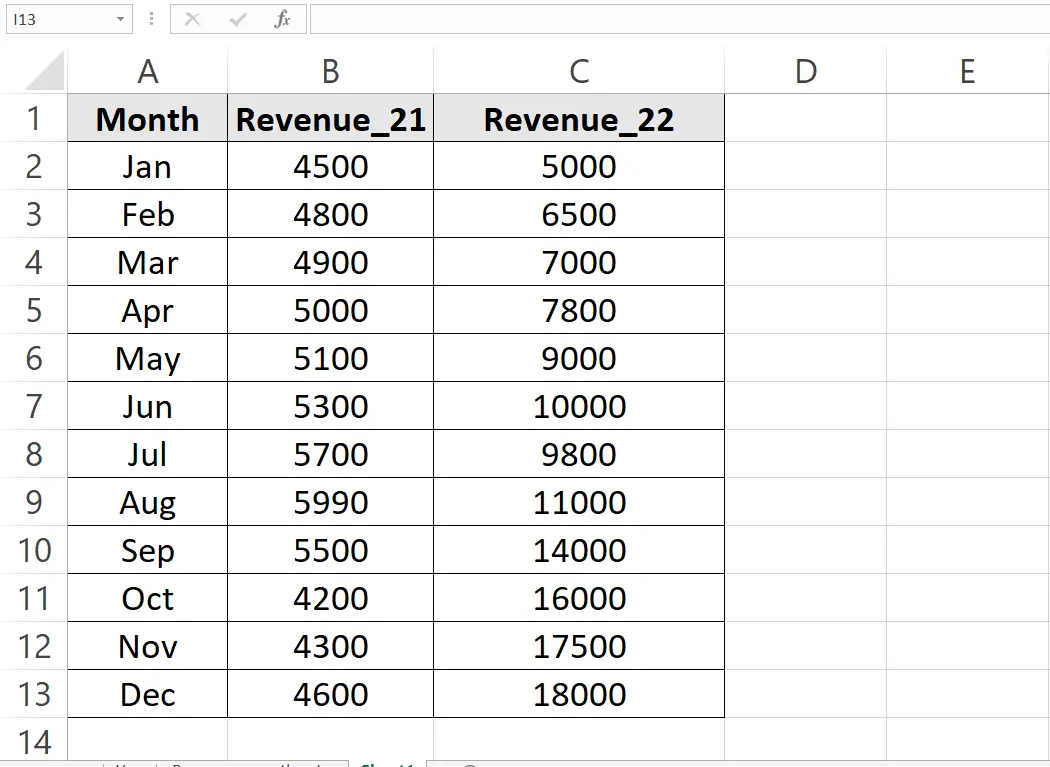
Screenshot from Excel with tabular data table, picture by author
2. Upload Your Data
Once you have the data you can easily upload it to the Ajelix BI platform. Go to the Data page, click add new data, select a data source type, and finish the upload.
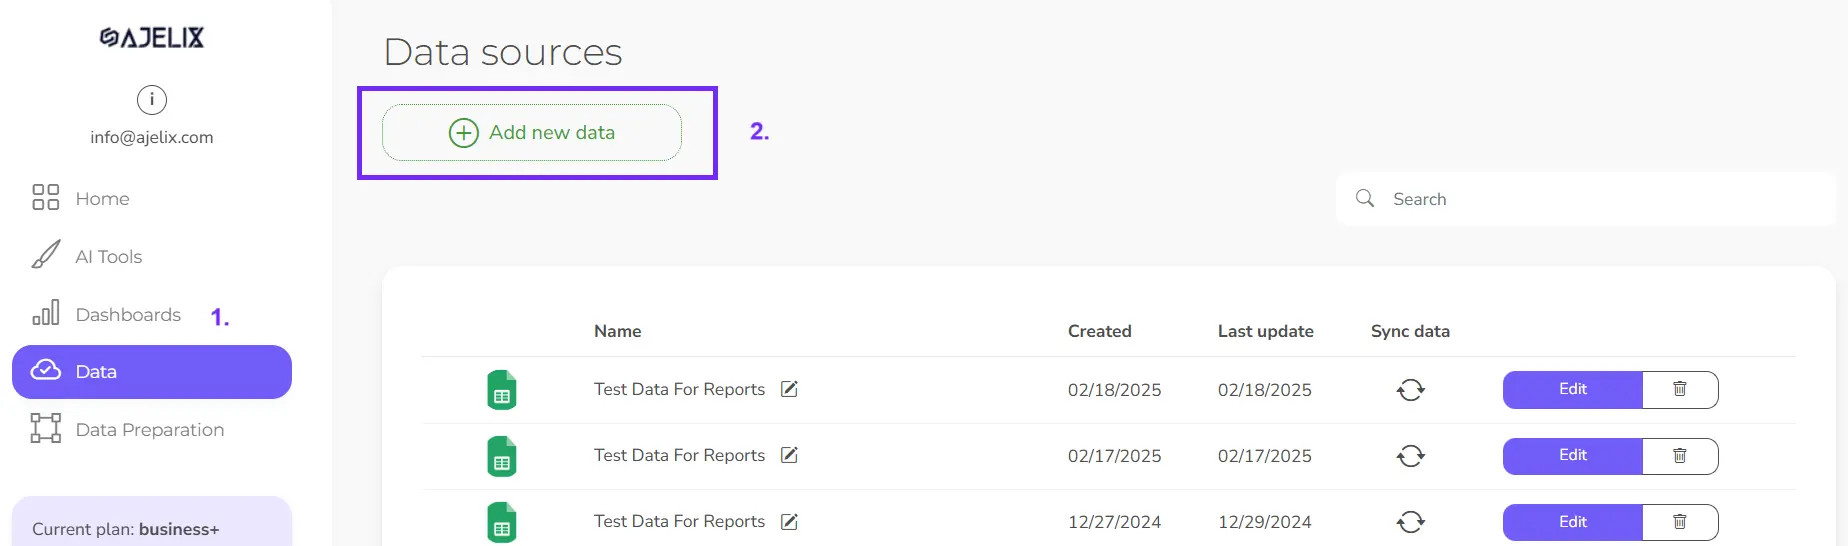
Screenshot from Ajelix BI with data upload, image by author
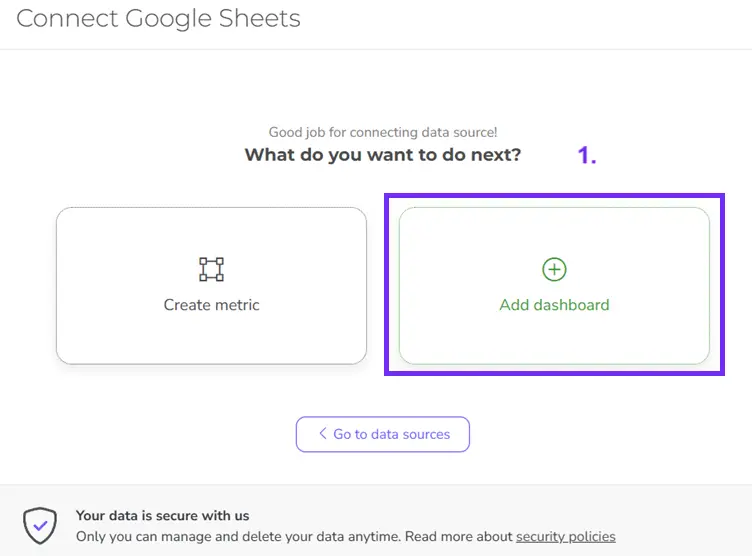
3. Create Dashboard
Once you have finished the data upload process, select add dashboard to calculate the metric.
4. Calculate Metric
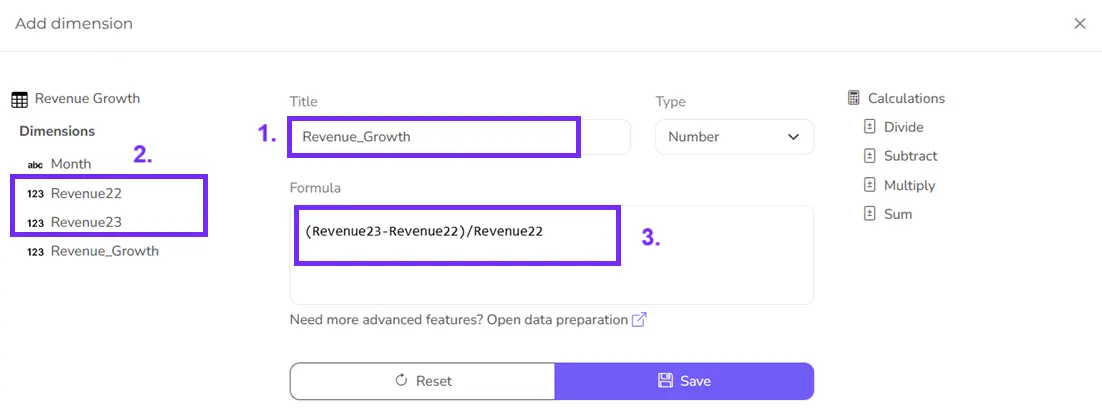
Now, you have the dashboard where you can easily add metrics. Click “Add metric” on the left side of the editor. This will open a window for metric calculation.

Ajelix BI dashboard editor view on platform, image by author
You should have a window pop out where you can easily build your formula by selecting the relevant column names.
5. Create Chart
Now, you have created a new column with the “Revenue Growth” metric. The next step would be to visualize this column in a chart.
- Click on the Month column and click Revenue growth, and you will see a chart pop-up on the right side
- You can change color and add precentage by following the screenshot below.
You have visualized your data that you can customize further or add additional charts to later share with others.
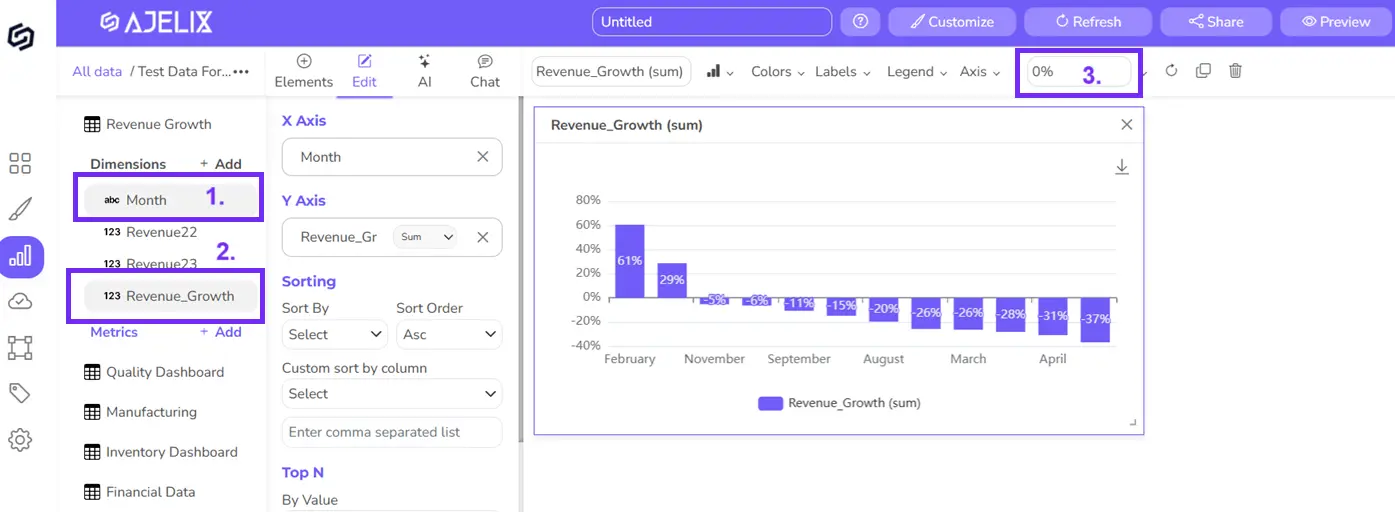
Ajelix BI settings for creating YoY chart, screenshot from author
Reporting gives you a headache?
Upload your data and create professional reports with agentic AI

Start free
Try free and upgrade whenever
Difference Between Revenue Growth Rate And YOY
The revenue growth rate formula is essentially the same way you calculate the Year-over-Year (YoY) growth rate for revenue. Here’s why:
- YoY (Year-over-Year): This term refers to comparing a specific metric (like website traffic) in the current year to the same metric in the previous year. It’s a common way to analyze performance trends over time.
- Revenue Growth Rate Formula: This formula calculates the percentage change in revenue between two periods.
When you choose the current year and the previous year for your time period in the revenue growth rate formula, it automatically becomes a YoY growth rate calculation. Here’s a table to illustrate the connection:
| Term | Description |
|---|---|
| Revenue Growth Rate Formula | A general formula to calculate the percentage change in revenue between any two periods. |
| YoY (Year-over-Year) Growth Rate | Specifically uses the revenue growth rate formula to compare revenue from the current year to the same period in the previous year. |
Both methods use the same core formula, but YoY focuses on a specific comparison window (one year).
Similar Formulas
Revenue growth rate is a core metric, but there are other formulas you can use to analyze a business’s performance alongside it. Here are a few examples:
1. Customer Acquisition Cost (CAC)
This formula helps you understand how much it costs to acquire a new customer.
Formula: CAC = Total Customer Acquisition Expenses / Number of New Customers Acquired in a Period
2. Customer Lifetime Value (CLTV)
This formula estimates the total revenue a customer generates for your business throughout their relationship.
Formula: CLTV = Average Customer Value (ACV) * Average Customer Lifespan
3. Gross Margin
This formula shows the profitability of your products by considering the cost of goods sold.
Formula: Gross Margin = (Revenue – Cost of Goods Sold) / Revenue * 100
4. Net Profit Margin
This formula takes a deeper dive into profitability by factoring in all operating expenses.
Formula: Net Profit Margin = Net Profit / Revenue * 100
5. Month-over-Month (MoM) Growth Rate:
Similar to YoY growth rate, this formula compares revenue between consecutive months.
Formula: MoM Growth Rate = ((Current Month Revenue – Previous Month Revenue) / Previous Month Revenue) * 100
6. Year-to-Date (YTD) Growth Rate:
This formula calculates the total revenue growth from the beginning of the current year to a specific date.
Formula: YTD Growth Rate = ((Current YTD Revenue – Previous YTD Revenue) / Previous YTD Revenue) * 100
Remember, these are just a few examples. The specific formulas you use will depend on your business goals and the data you’re analyzing.
What is a good Revenue Growth Rate?
Keep in mind that there’s no single “good” revenue growth rate that applies universally. It depends on several factors, including:
- Company Stage: Startups can expect much higher growth rates (sometimes exceeding 100%) compared to established businesses (often aiming for 15-25% growth).
- Industry: Different industries have varying growth patterns. Tech startups might target aggressive growth, while mature industries like utilities might see steadier, lower growth.
- Company Goals: Some businesses prioritize rapid expansion, justifying a higher growth rate. Others might focus on profitability or stability, aiming for more moderate growth.
Here’s a general breakdown to give you an idea:
- High Growth (Startups): 100% or more (can be much higher in specific industries)
- Healthy Growth (Established Businesses): 15-25%
- Stable Growth (Mature Industries): Single digits
Remember, these are just ranges. The “good” growth rate for you depends on your specific circumstances. It’s more important to understand trends in your own growth rate and compare them to your industry benchmarks.
Conclusion
Calculating your revenue growth rate is crucial for understanding your business’s financial health and sales performance.
Remember, a strong revenue growth rate is a positive indicator, but it’s not the only measure of success. Consider other factors alongside it, and use industry benchmarks as a reference point.
The good news is that the steps outlined in this blog make calculating and analyzing your revenue growth rate accessible. Start by gathering your revenue data, apply the formula in Excel (or other software), and don’t be afraid to delve deeper into the trends you uncover.
FAQ
The frequency of calculating your revenue growth rate depends on your business. Early Stage Startups should calculate weekly or monthly to monitor rapid changes. Established Businesses can measure monthly or quarterly for regular performance checks.
Industry Reports: Paid or free reports from research firms often include growth rate benchmarks.
Industry Associations: Industry associations may publish data on average growth rates for member companies.
Financial Databases: Services like S&P Capital IQ or Mergent Online offer industry financial data with growth rate metrics.
A negative revenue growth rate indicates a decline in sales. Analyze the reasons check how your marketing campaigns perform and find the reason for a decline. After you know the reasons develop new tactics and monitor data closely.
Yes, there are ways to automate revenue growth rate calculations. Use spreadsheets to automate calculations once you set them up. Some accounting software can integrate with sales data and automatically calculate growth rates. BI tools, such as Ajelix BI can connect to data sources and automate growth rate calculations with visualizations.
From data to report in one minute or less with Ajelix AI Agents


