Year Over Year (YoY) Growth Formula With Examples

YOY growth, or year-over-year growth, is a metric that compares a specific value (e.g., revenue, profits) in the current period to the same period one year prior. It essentially tells you how much something has grown (or declined) over the past year.
Growth. 🌱 It’s the lifeblood of any business, project, or even personal endeavor. But how do we truly measure this progress in business? That’s where Year-over-Year (YoY) growth steps in, offering a great way to analyze performance and identify trends over time.
In this article, we will explain what is YoY growth, where it’s used, and the tools to calculate this metric. Whether you’re looking for a quick fix or trying to implement this metric in your business, this article will empower you to:
- YoY definition
- Year-over-year formula
- How to calculate in 2 simple steps
- Steps to calculate growth in Excel
- Calculate YoY in Ajelix BI
- Similar formulas
- Good YoY rate
Change the way you work with agentic AI
One-click dashboards,KPI tracking, and AI-powered insights—for work that actually gets done.

What does yoY mean?
YoY, or Year-over-Year, is a metric used to assess percentage change in a specific value compared to the same period one year prior. It’s an easy way to analyze growth, performance, or decline over a yearly timeframe.
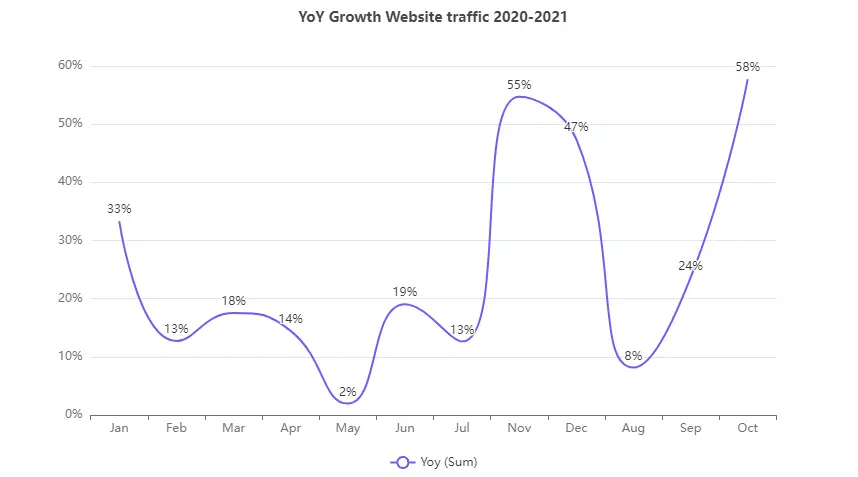
Year over year growth chart from Ajelix BI, screenshot by author
Imagine you’re tracking your website traffic. Instead of just looking at the raw numbers for January 2020, YoY compares it to January 2021. This tells you whether your traffic increased, decreased, or remained stable over the past year.
YoY is a valuable metric because it can provide a standardized and easy-to-understand measure of progress or change. It cuts through the noise of raw numbers and gives you a clearer picture of the data.
Year-Over-Year (yoy) growth formula
Year to year formula is straightforward:
(Current value - Previous year's value) / Previous year's value x 100how to calculate year-over-year growth?
By comparing a current value to its corresponding value from the previous year, you can express YoY growth as a percentage. This way you can have a clear and standardized measure of progress. Calculate YOY in 2 simple steps:
1. Gather data for calculation
Current value: This is the number you want to compare, for example, your website traffic in January 2024.
Previous year’s value: This is the same number from the same period one year ago, like your website traffic in January 2023.
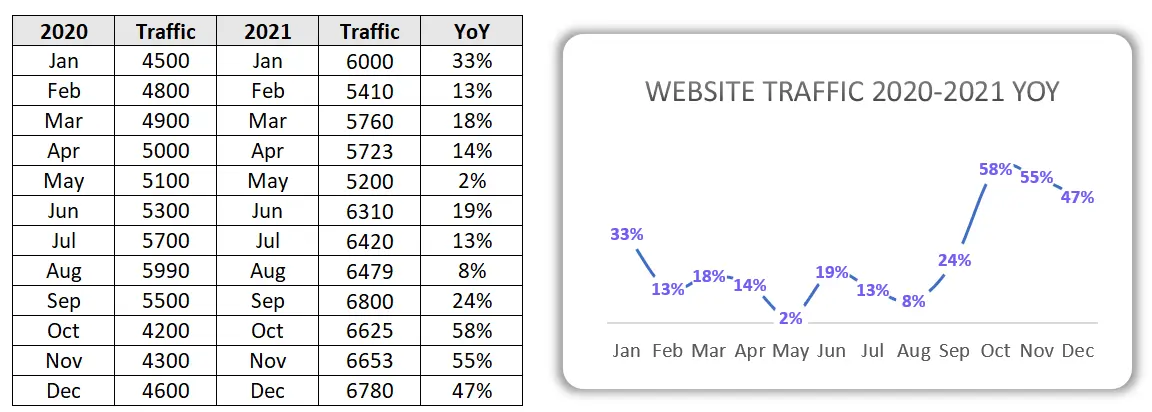
Screenshot example from Excel comparing website traffic from previous year, image by author
Once you have values you can calculate YoY for your website traffic. Just like in the example above, to learn the formula please continue reading the next chapter.
2. Yoy calculation
Use this formula to calculate metric:
(Current value - Previous year's value) / Previous year's value x 100Let’s say your website traffic in January 2020 was 4,500 visitors and in January 2021 it was 6,000. Plug it in:
(6,000 - 4,500) / 4,500 x 100 = 33%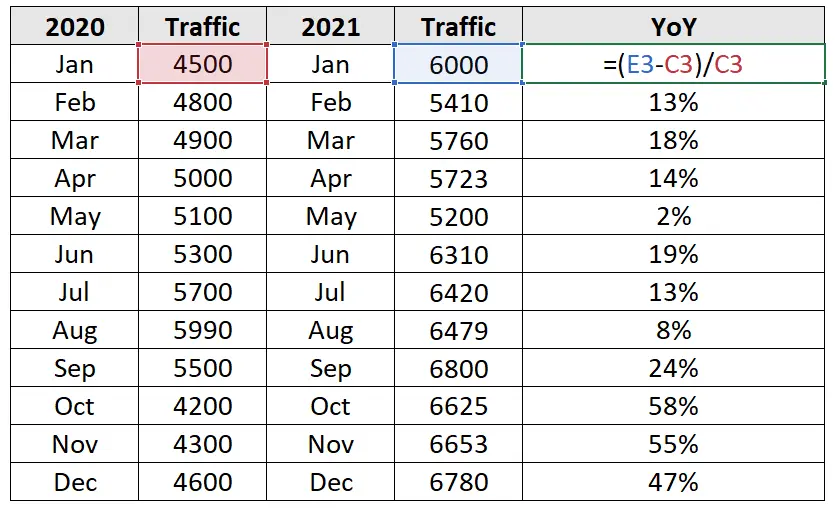
Screenshot from Excel with yoy growth metric calculation, made by author
3. Additional examples:
- Sales growth: You made $10,000 in sales this month, compared to $8,000 last month. Your YoY growth is (10,000 – 8,000) / 8,000 x 100 = 25%.
- Social media followers: You have 5,000 followers today, and you had 4,000 a year ago. Your YoY growth is (5,000 – 4,000) / 4,000 x 100 = 25%.
Remember, a positive YoY growth indicates improvement, while a negative shows a decline. The bigger the percentage the better the growth.
how to calculate yoY growth in Excel?
Time needed: 5 minutes
Let’s take a look at how to calculate this metric in Excel the easiest way to create a process that will help you track this metric.
- Prepare data table
You will need two data columns:
– Current Year Values: Values for the current year (e.g., sales, website traffic).
– Previous Year Values: Corresponding values from the previous year. - Add a new row and name it YoY
Insert a new column where you will calculate the metric.
- Insert the YoY formula
Write YoY formula in the formula bar:
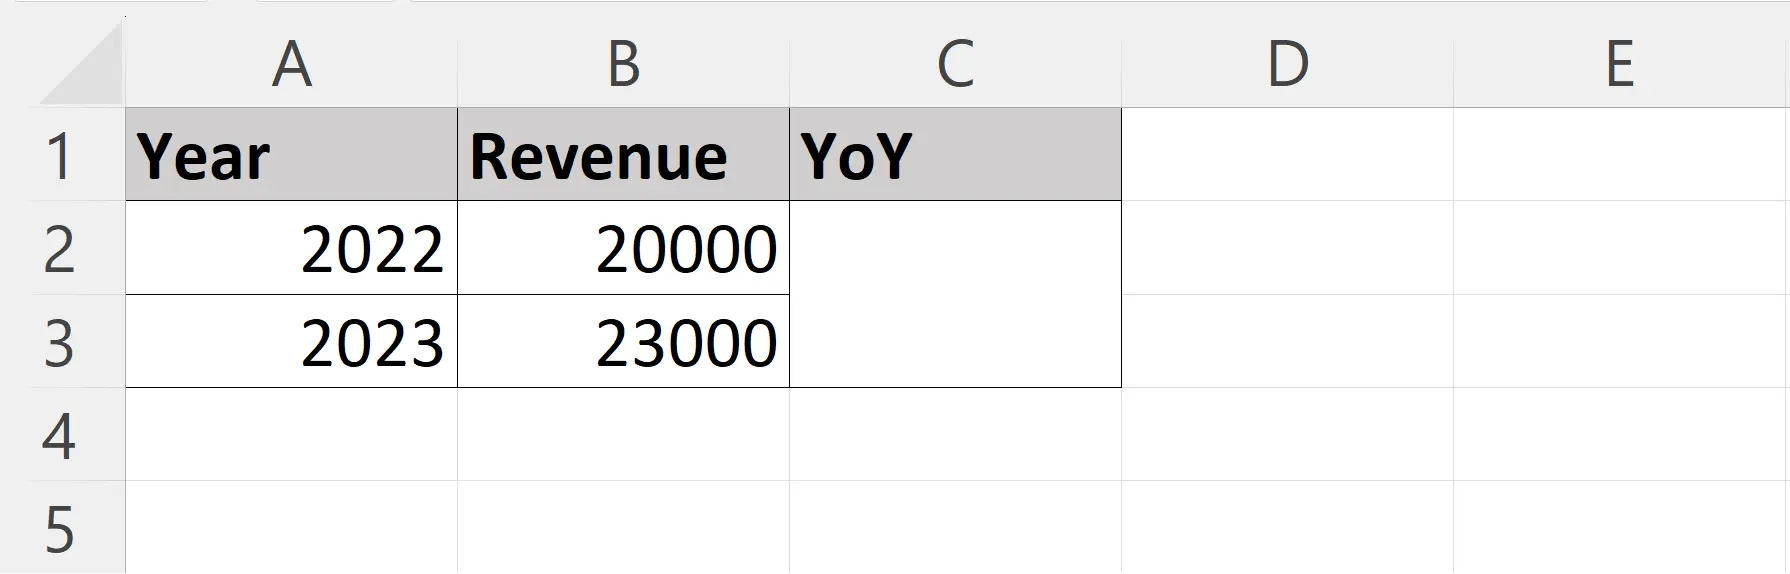
=(Current Year Value - Previous Year Value) / Previous Year Value. For example, if your current revenue is in cell B2 and the previous year revenue in cell B3, enter: =(B3-B2)/B2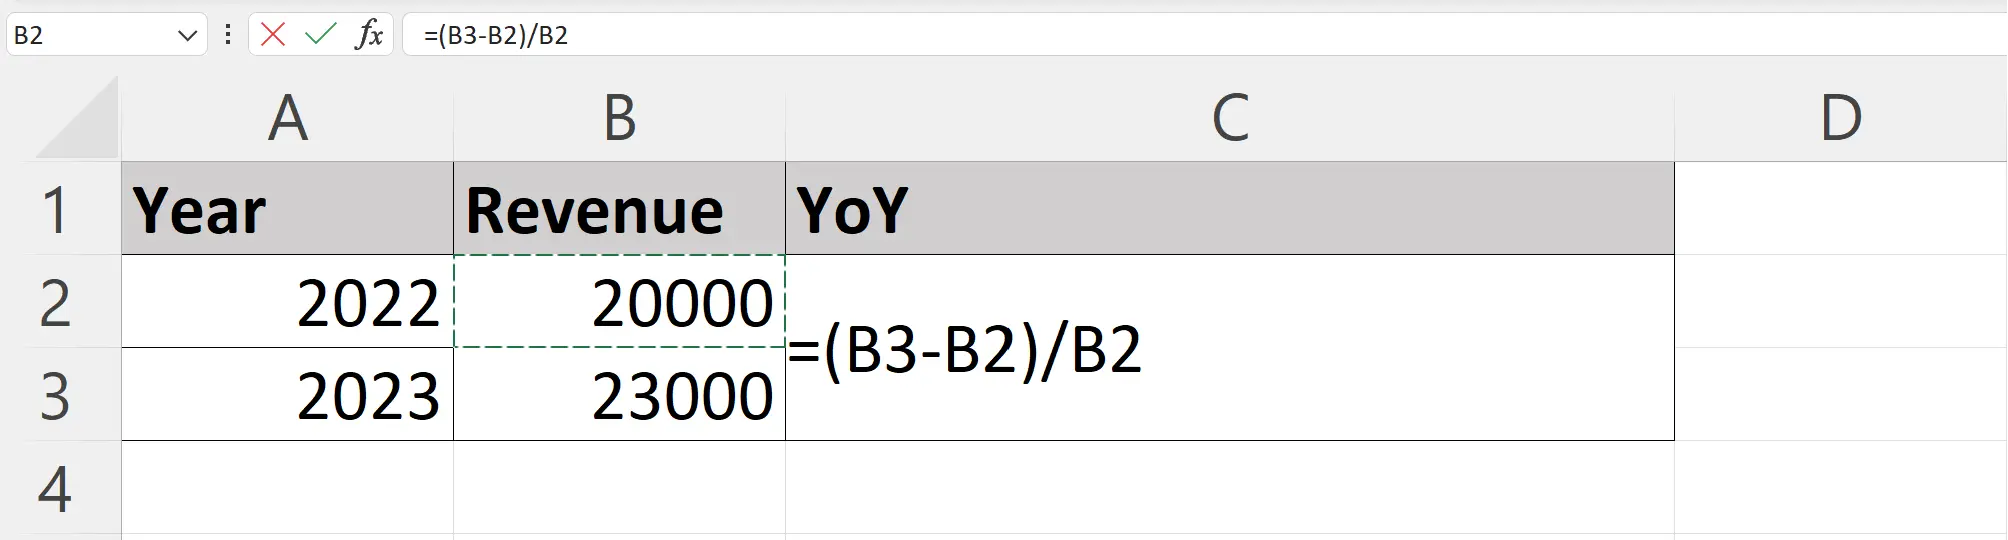
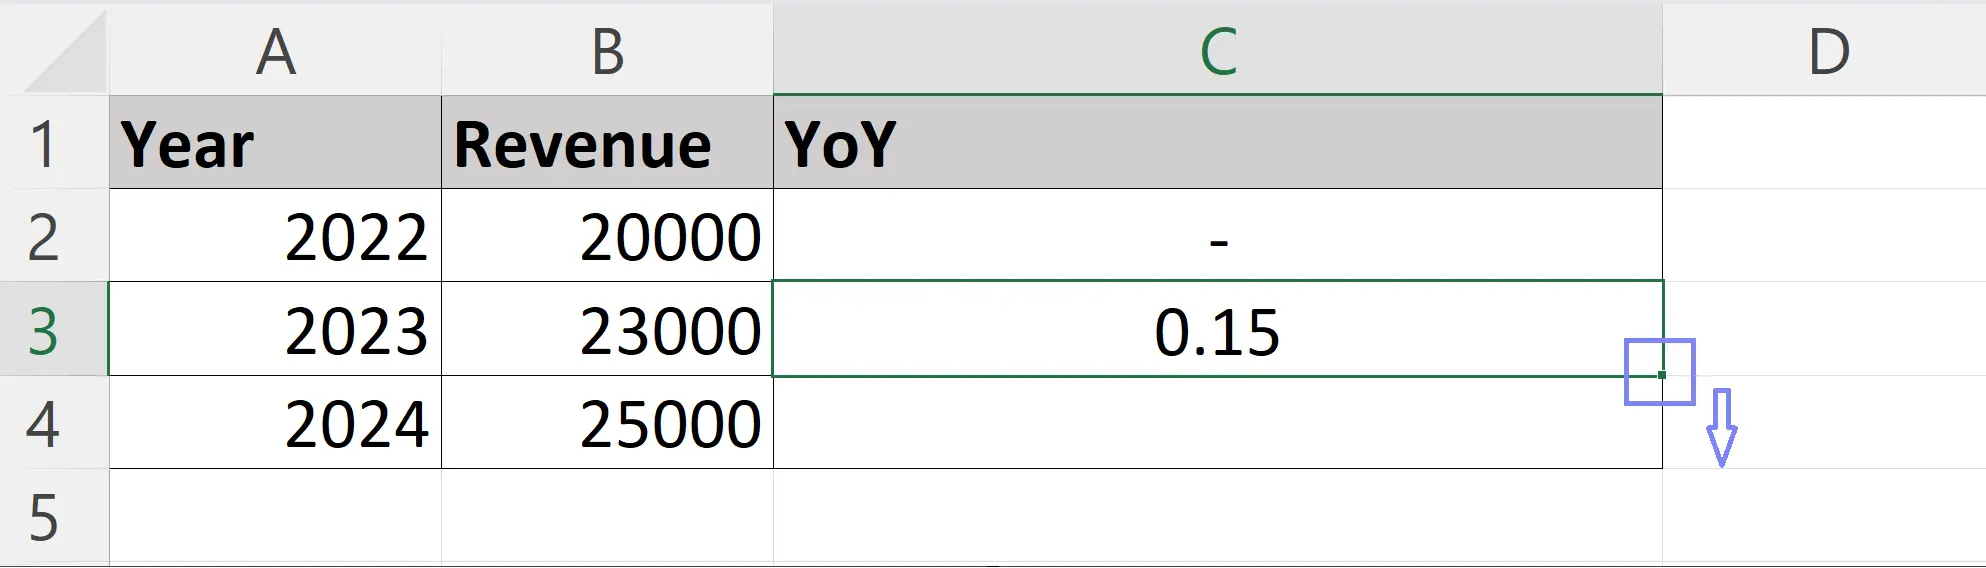
- Drag and Fill
Drag the formula cell down to automatically apply it to all remaining rows in your data table. Now, you have a column showcasing YoY growth for each value.
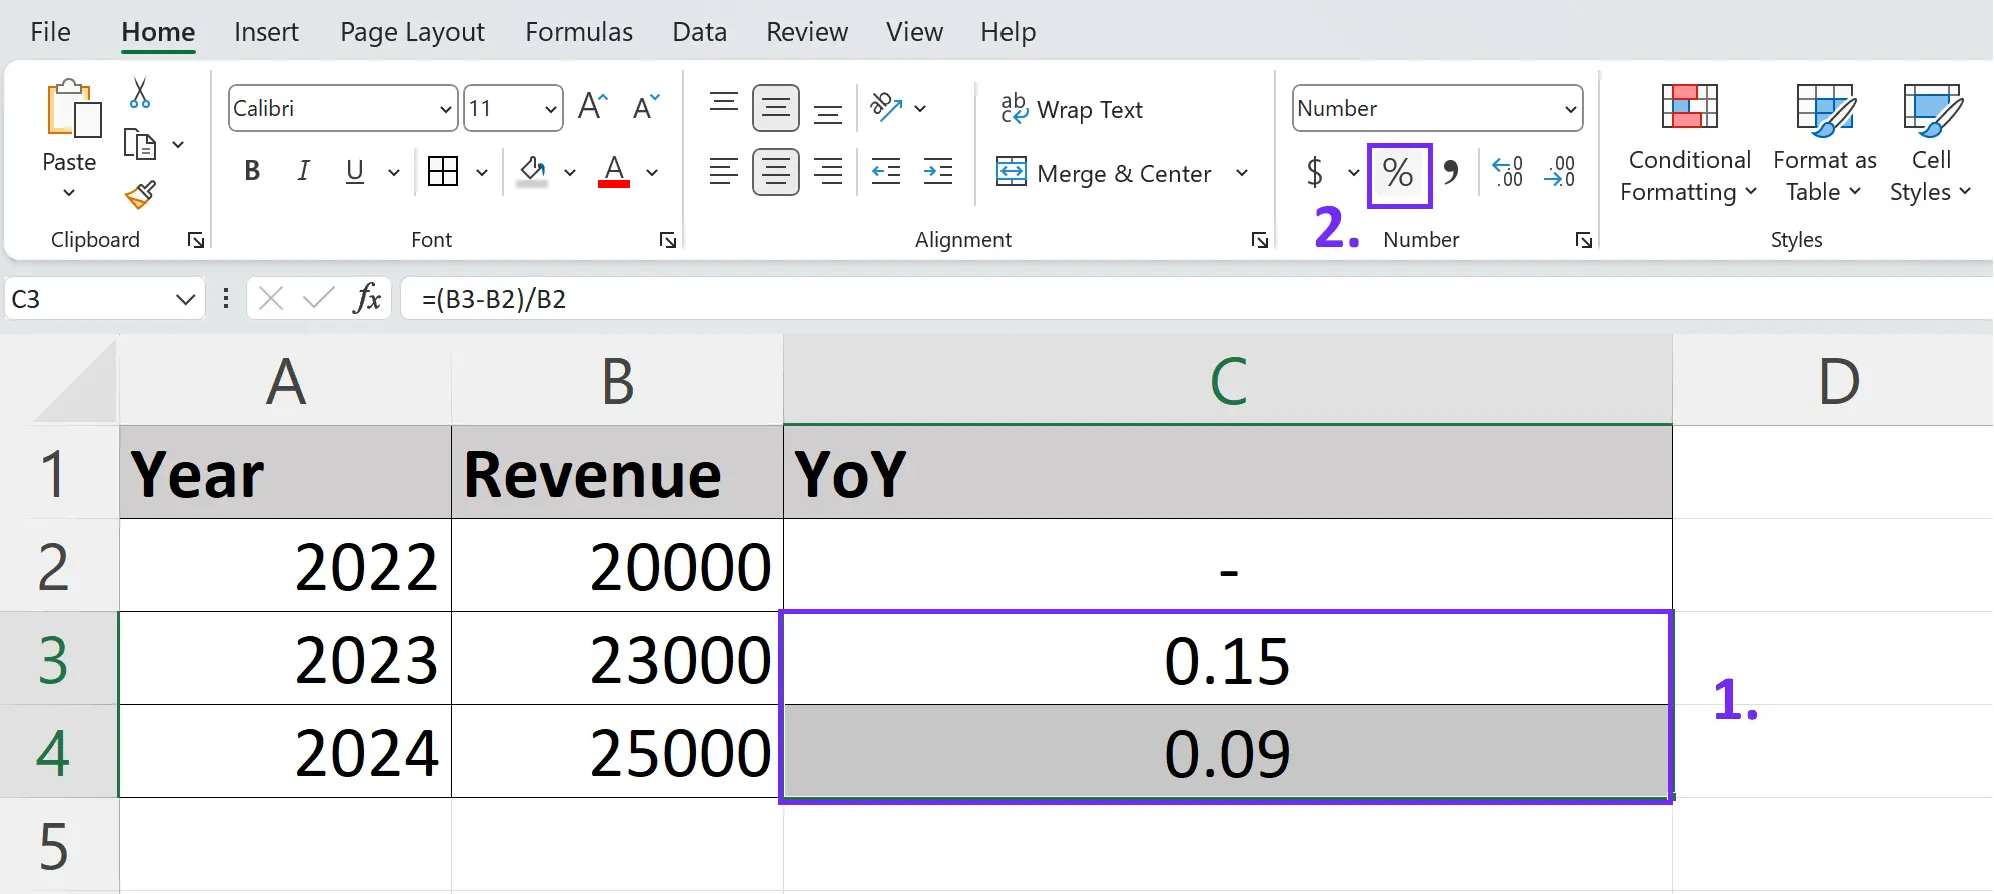
- Format values as percentage
Select the YoY growth column and click the % icon under Number formatting to display the values as percentages. Just like in the example below.
Additional Tips For Excel Users:
- Conditional Formatting: Highlight positive and negative growth with different colors for easy visual identification.
- Charts and Graphs: Create visually appealing charts to present YoY trends and comparisons.
- Multiple Years: Use the OFFSET function to calculate YoY growth compared to different previous years.
- PivotTables: Analyze YoY growth by different categories or segments within your data.
how to calculate yoY in Ajelix BI?
Ajelix BI can be a helpful in reporting process as well as calculating different KPIs. This BI platform is created for business owners and managers to ease the data visualization process. Let’s take a look how non-technical teams can easily use Ajelix to calculate YoY and create a more trustworthy reporting process.
1. Prepare your data
Step one is to prepare your data in Excel table or Google Sheets file. Here’s an example of how your data should look if you want to measure growth for specific period in current year and previous year.

Screenshot from Excel with tabular data table, picture by author
2. Upload Your Data
Once you have the data ready, you can easily upload it to the Ajelix BI platform. Go to the data upload page, click add new data, and select the connection type.
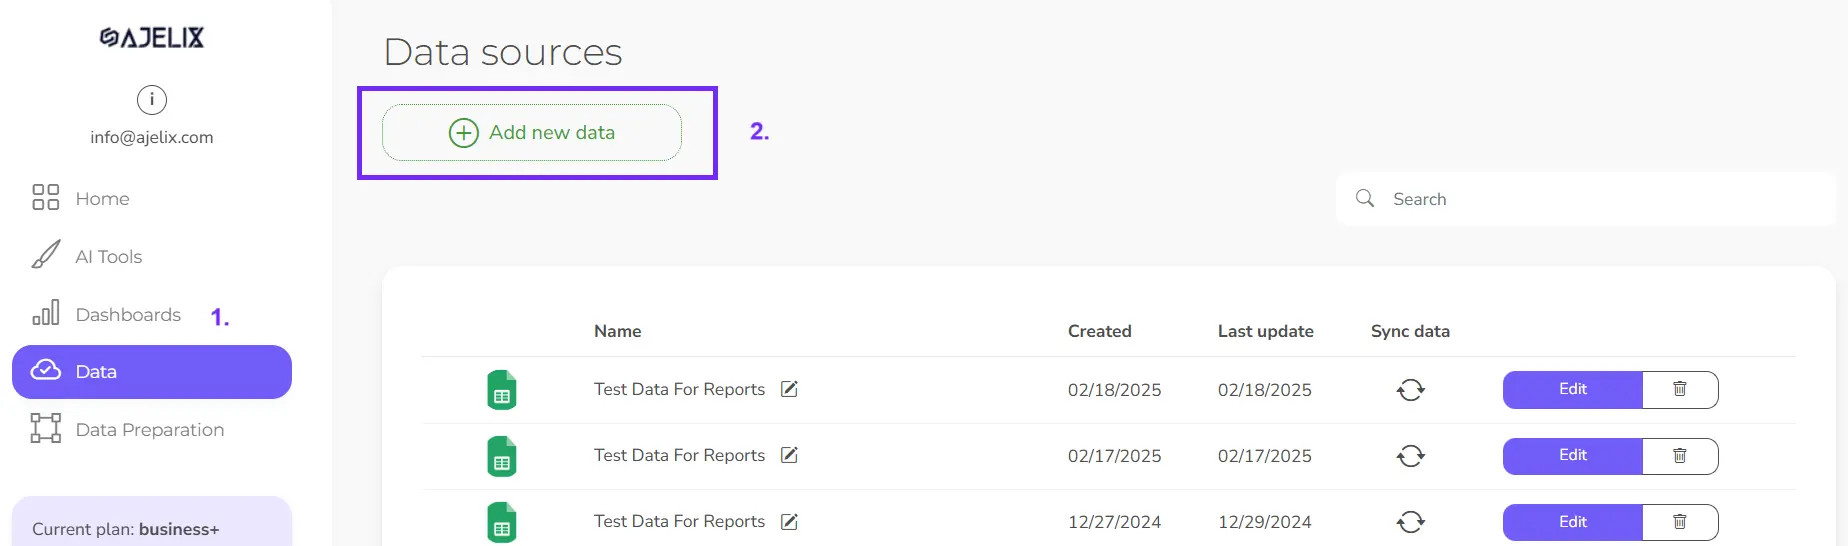
Screenshot from Ajelix BI with data upload, image by author
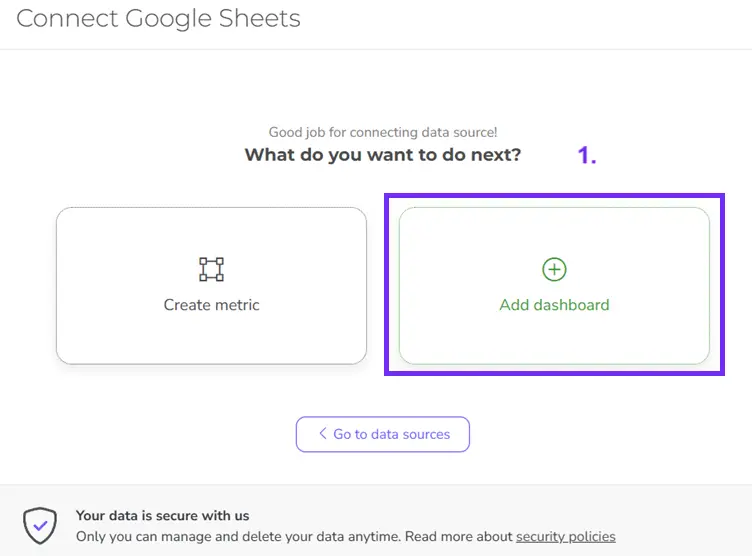
3. Create Dashboard
Once you have finished the data upload process, select add dashboard to calculate the metric.
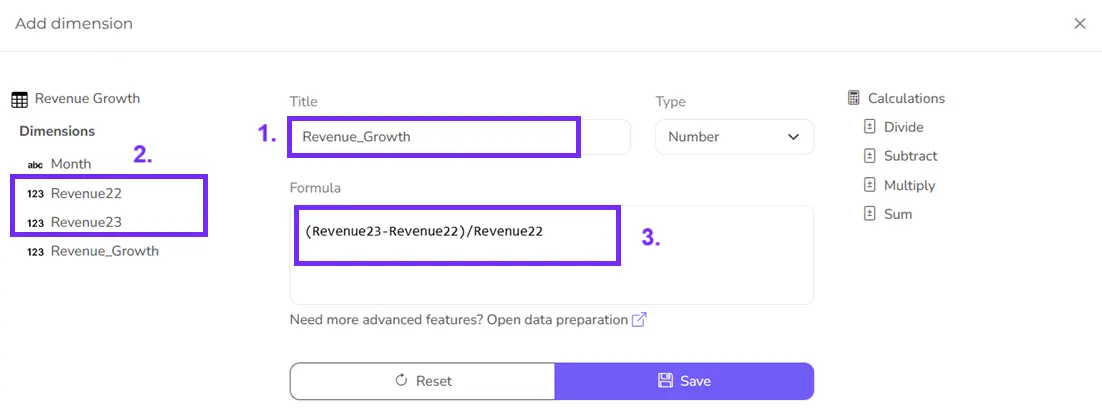
4. Calculate Metric
Now, you have the dashboard where you can easily add metrics. Click “Add metric” on the left side of the editor. This will open a window for metric calculation.

Ajelix BI metric editor example, screenshot by author
You should have a window pop out where you can easily build your formula by selecting the relevant column names.
5. Create Chart
Now, you have created a new column with the “YoY” metric. The next step would be to visualize this column in a chart.
- Click on the Month column and click YoY growth, and you will see a chart pop-up on the right side
- You can change the color and add a precentage by following the screenshot below.
You have visualized your data that you can customize further or add additional charts to later share with others.
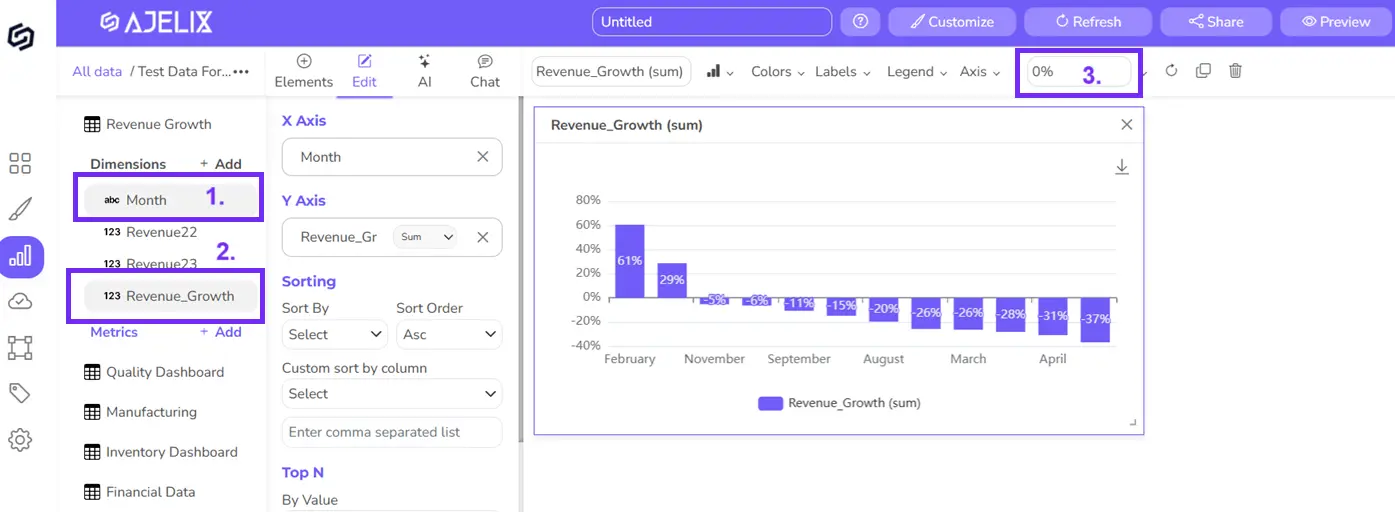
Ajelix BI settings for creating YoY chart, screenshot from author
Reporting gives you a headache?
Upload your data and create professional reports with agentic AI

Start free
Try free and upgrade whenever
Similar formulas to yoY
While YoY growth offers a valuable snapshot, its analysis can sometimes paint an incomplete picture. Here are 4 similar formulas that you can use for data analytics:
- Quarter-over-Quarter (QoQ) Growth
- Compound Annual Growth Rate (CAGR)
- Month-over-Month (MoM) Growth
- Week-over-Week (WoW) Growth
Let’s dig deeper in each formula on the next chapter.
1. Quarter-over-Quarter (QoQ) Growth
- Focus: Analyzes changes within the same year, offering insights into shorter-term trends and potential seasonality.
- Formula:
(Current Quarter Value - Previous Quarter Value) / Previous Quarter Value x 100 - Example: Track website traffic growth throughout the year to identify seasonal peaks and valleys.
2. Compound Annual Growth Rate (CAGR)
- Focus: Measures average growth rate over a longer period (e.g., 5 years), smoothing out fluctuations and providing a big-picture perspective.
- Formula: More complex, requiring specialized functions like XIRR or RATE.
- Example: Analyze the average yearly growth of a company’s revenue over the past five years.
3. Month-over-Month (MoM) Growth
- Focus: Similar to QoQ but for even shorter periods, offering insights into highly dynamic situations.
- Formula: Same as QoQ, replacing “Quarter” with “Month”.
- Example: Track daily active users of a mobile app to identify usage patterns and optimize engagement strategies.
4. Week-over-Week (WoW) Growth
- Focus: Useful for highly volatile data or situations requiring immediate attention.
- Formula: Same as MoM, replacing “Month” with “Week”.
- Example: Monitor website traffic fluctuations during a marketing campaign to assess its effectiveness in real-time.
The best formula depends on your specific needs and the timeframe you’re interested in analyzing. Each formula offers a unique lens. Combining YoY with other formulas paints a richer picture, enabling you to make informed decisions based on a deeper understanding of your data.
What is a good YoY rate?
There is no specific number that is considered good or bad for YoY metric. As the metric depends on industry, company size, internal policies, and other factors. To understand what is a good rate follow 4 principles:
- Focus on internal benchmarks: Track your own YoY growth over time and identify trends within your company. That will provide a more meaningful context for your performance.
- Industry reports and averages: Research industry reports or publications for average YoY growth rates specific to your industry. This can offer a general context for your own performance.
- Competitor analysis: Analyze your direct competitors’ publicly available data cautiously for trends and insights, but avoid direct comparisons.
- Focus on specific metrics: Compare relevant metrics within your industry and business goals (e.g., product category growth, customer acquisition cost) instead of overall YoY growth.
Remember, YoY growth is valuable, but it’s just one piece of the puzzle. Consider a multi-faceted approach using industry context, internal benchmarks, and specific metrics for a more nuanced understanding of your performance and potential.
Conclusion
YoY is a metric used to assess percentage change in a specific value compared to the same period one year prior. It is a valuable metric because it provides a standardized and easy-to-understand measure of progress or change.
By comparing a current value to its corresponding value from the previous year, you can express YoY growth as a percentage. For more successful data process in your company pick tools that can help you create digital dashboards and analyze data in the long run.
FAQs
YoY (Year-over-Year) growth compares a current value to the same value from the previous year, expressed as a percentage. It shows how much you’ve grown (or declined) over a year, offering a standardized measure of progress.
Use the formula: (Current Value - Previous Year's Value) / Previous Year's Value x 100
Yes, simply enter the formula in a cell and apply it to your data table.
Some tools that are easy to use for YoY calculation are Excel, Google Sheets, Ajelix BI, and Power BI.
Ready to calculate YoY with Ajelix BI?
From data to report in one minute or less with Ajelix AI Agents


