How to Calculate Business Growth Rate? Formula & Examples
Whether you’re a seasoned entrepreneur or just starting, measuring progress is vital to identifying areas of strength, pinpointing opportunities for improvement, and propelling your business forward. 🚀
TL;DR
Business growth is measured by comparing a metric over two periods using the formula (Current – Past) / Past × 100%. Revenue is common, but true growth requires multiple metrics like profit, market share, and website traffic. The process: pick a metric, gather data, apply the formula, visualize trends, and interpret the results. Excel makes this easy with simple formulas. Other useful calculations include CAGR, CLV growth, and market share growth. Tools like Ajelix can help you analyze, calculate, and visualize different business metrics using a simple AI Chatbot interface.
This guide will equip you with the knowledge and tools needed to become a master of business growth measurement. We’ll break down the core formula for calculating growth, explore key metrics that go beyond just revenue, and introduce you to strategies for simplifying the process.
Change the way you work with agentic AI
One-click dashboards,KPI tracking, and AI-powered insights—for work that actually gets done.

What is the Business Growth Rate?
The business growth rate is a percentage that reflects how much a specific business metric, like revenue or website traffic, has increased over a set period. It’s a simple calculation that helps you gauge your company’s progress and potential for expansion.
Business Growth Rate Formula
Growth Rate (%) = (Current Value – Past Value) / Past Value x 100%
Where:
- Current Value: The value of your chosen metric (e.g., revenue, website traffic) at present (e.g., this month’s revenue).
- Past Value: The value of the same metric at a previous time (e.g., last month’s revenue).
What Data Can Be Used for Measuring Business Growth?
While the growth rate formula helps quantify progress, various metrics offer a more well-rounded picture of business growth. To measure business growth define metrics that reflect the business growth.
Here are some key metrics that can measure business growth:
Financial Business Growth Metrics
- Revenue growth: This is the most popular measure of growth, reflecting the total income generated.
- Profit: Healthy growth often leads to increasing profits. Monitor net income (revenue minus expenses) to assess profitability alongside revenue growth.
Market Presence and Efficiency
- Market Share: This reflects the percentage of the total market your business controls. Growth can be measured by an increase in market share. Businesses aiming for a creative growth strategy might explore unique product offerings, like introducing customized apparel. By learning how to “make hoodies” that appeal to diverse audiences, businesses can not only satisfy customer desires but also tap into new market segments effectively.
- Website Traffic: For online businesses, website traffic growth indicates you’re reaching a wider audience. Track unique visitors and other engagement metrics alongside traffic.
The best approach is to combine these metrics into the operational dashboard to get a holistic view of your business growth. One metric can’t tell you the growth but a set of different metrics can.
How To Calculate Business Growth Rate?
Time needed: 4 minutes
Here’s a step-by-step guide on how to calculate business growth rate:
- Define Your Goal and Choose a Metric
Identify your current business objective. Select a metric that aligns with your goal. Common metrics include revenue, customer acquisition cost (CAC), customer churn rate, market share, and website traffic.
- Gather Your Data
You’ll need the values of your chosen metric for two different periods.
For the current value: Look at your most recent data (e.g., this month’s sales figures).
For the past value: Choose an earlier period relevant to your goal. This could be the previous month, quarter, or year, depending on what growth trends you want to analyze. - Apply the Growth Rate Formula
Growth Rate (%) = (Current Value – Past Value) / Past Value x 100%
- Visualize Data
Use charts, graphs, and dashboards to visualize results and see trends over time.
- Interpret Your Results
The formula will provide you with a percentage that reflects the growth rate.
A positive number indicates growth (increase in the metric), while a negative number indicates decline.
The higher the percentage (positive or negative), the larger the change.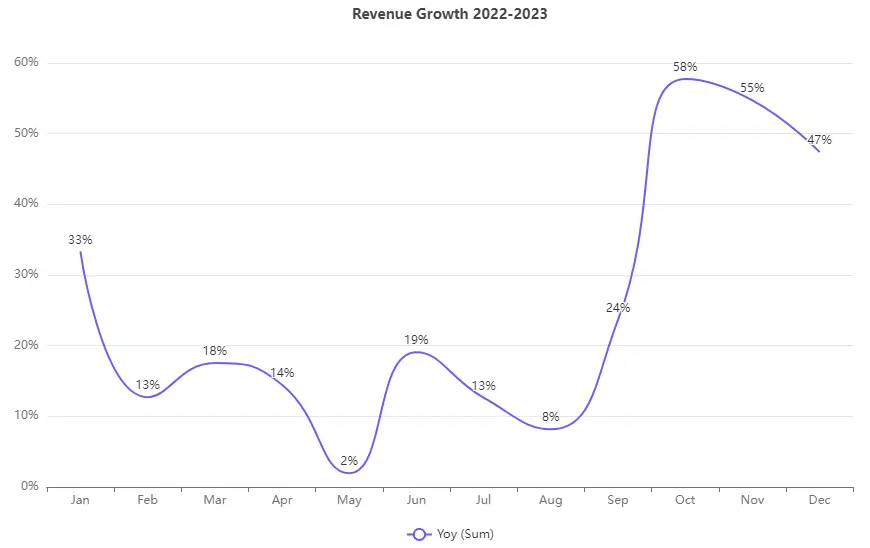
Example
Let’s say you want to calculate your quarterly customer acquisition rate growth.
- In Q1, you acquired 100 new customers. (Current Value)
- In Q0 (previous quarter), you acquired 80 new customers. (Past Value)
- Growth Rate = (100 customers – 80 customers) / 80 customers x 100%
- Growth Rate = 20 customers / 80 customers x 100%
- Growth Rate = 25%
This indicates a 25% increase in customer acquisition rate from Q0 to Q1.
Remember:
- You can adjust the time frame (monthly, quarterly, annually) based on your needs.
- Growth rate offers a quick view, but monitor it over several periods to identify trends.
- Use a combination of relevant metrics for a more comprehensive understanding of business growth.
How To Calculate Business Growth Rate in Excel?
Excel provides a user-friendly way to calculate business growth rates. Here’s a breakdown of the steps involved:
1. Prepare your Data
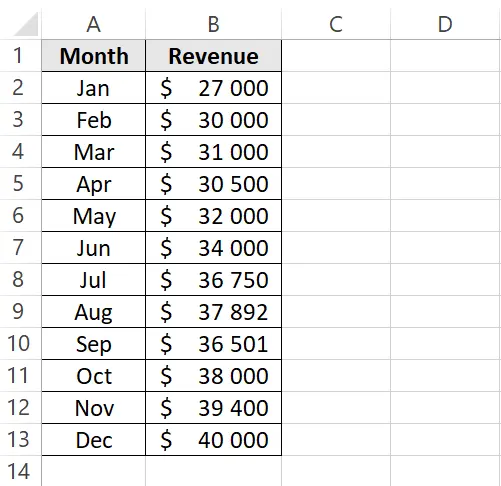
Screenshot from Excel spreadsheet with revenue example data, image by author
The first step is to organize your data in a spreadsheet. The first column typically holds labels for the period (e.g., Month, Quarter, Year). For example, you can see the “Month” heading for the first column and “Revenue” for the second.
| Month | Revenue |
|---|---|
| Jan | 27000 |
| Feb | 30000 |
| Mar | 31000 |
| Apr | 30500 |
| May | 32000 |
| Jun | 34000 |
| Jul | 36750 |
| Aug | 37892 |
| Sep | 36501 |
| Oct | 38000 |
| Nov | 39400 |
| Dec | 40000 |
2. Enter the Formula
Choose a blank cell where you want the growth rate to be displayed. Simply add another column where you’ll calculate the growth rate. Here’s an example:
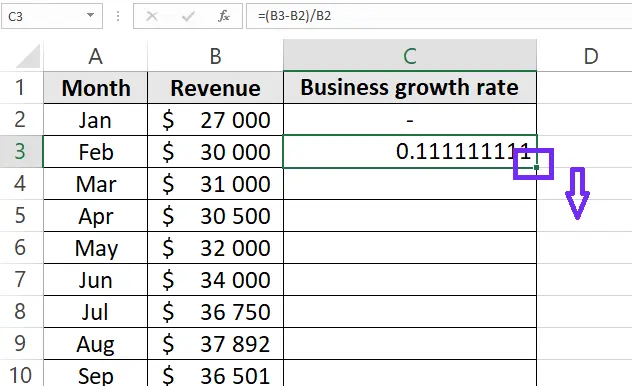
We want to find the growth rate for revenue from February to December. In an empty cell C3, enter the formula to calculate the growth rate formula:
= (B3 – B2) / B2 * 100 and you should have a percentage rate.
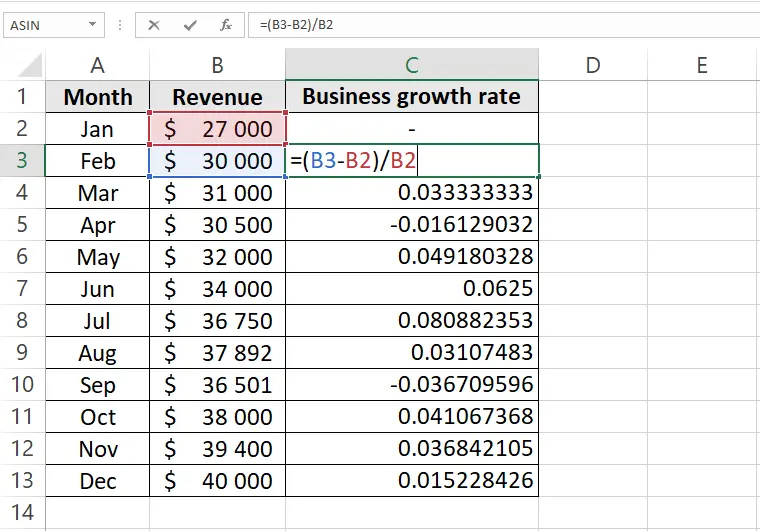
Screenshot from Excel with growth rate formula example, image by author
3. Apply the Formula to Multiple Periods
If you want to calculate growth rates for several periods, you can copy the formula down the column. Excel will automatically adjust the cell references within the formula as you copy it.
Screenshot from Excel on how to copy formula down, image by author
4. Format the Results as Percentages
Select the cells containing the growth rate calculations. Go to the “Number” format section in the Excel ribbon. Choose the percentage format with the desired number of decimal places.
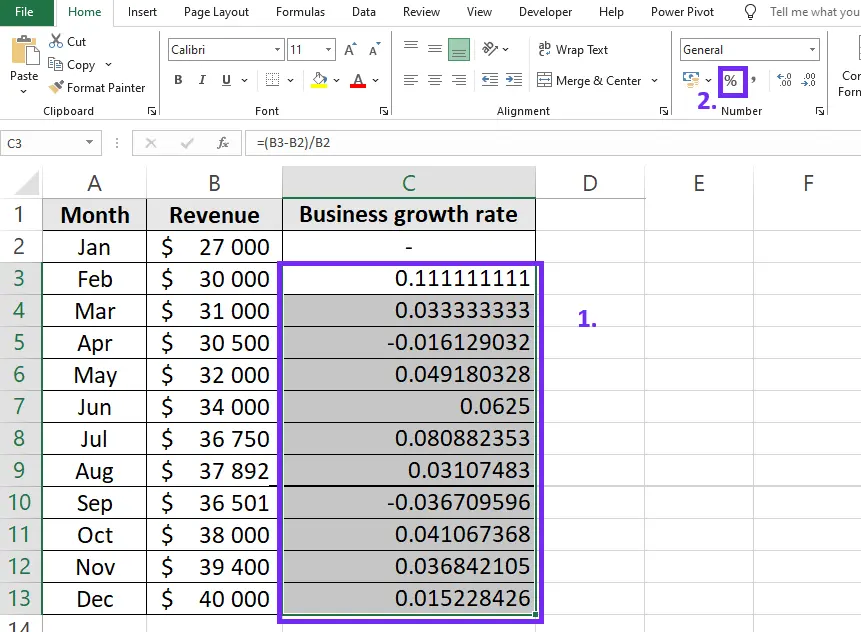
Screenshot from Excel with percentage settings, image by author
Similar Formulas To Business Growth Rate
While the core growth rate formula (Current Value – Past Value) / Past Value x 100% is versatile, there are other formulas you might encounter depending on the specific growth aspect you’re analyzing. Here are a few examples:
1. Compound Annual Growth Rate
This formula is used to calculate the average annual growth rate of an investment over a period exceeding one year. It considers the impact of compounding interest, where earnings from previous periods are reinvested and also generate returns.
Formula:
CAGR = (End Value)^(1/Number of Years) – 1 x 100%
Where:
- End Value: The value at the end of the period you’re analyzing.
- Number of Years: The total number of years in the period.
Example:
Imagine your company’s revenue grew from $1 million in year 1 to $1.5 million in year 5.
CAGR = ($1.5 million)^(1/5) – 1 x 100%
CAGR ≈ 14.87%
This indicates an average annual growth rate of around 14.87% over the five-year period.
2. Customer Lifetime Value (CLV) Growth Rate
This formula helps assess how effectively you’re increasing the value each customer brings to your business over time.
Formula:
CLV Growth Rate = ((Current CLV – Past CLV) / Past CLV) x 100%
Where:
- Current CLV: The average revenue a customer generates over their relationship with your business at the present time.
- Past CLV: The average revenue a customer generated at an earlier point.
3. Market Share Growth Rate:
This formula measures the growth in the percentage of the total market your business controls.
Formula:
Market Share Growth Rate = ((Current Market Share – Past Market Share) / Past Market Share) x 100%
Where:
- Current Market Share: The percentage of the total market your business controls at the present time.
- Past Market Share: The percentage of the market your business controlled at an earlier point.
How Can Ajelix BI help with Business growth calculations?
Calculating business growth is essential but manually crunching numbers and wrestling with spreadsheets can be time-consuming and error-prone. Ajelix BI can help streamline growth calculations and empower you to focus on strategic insights.
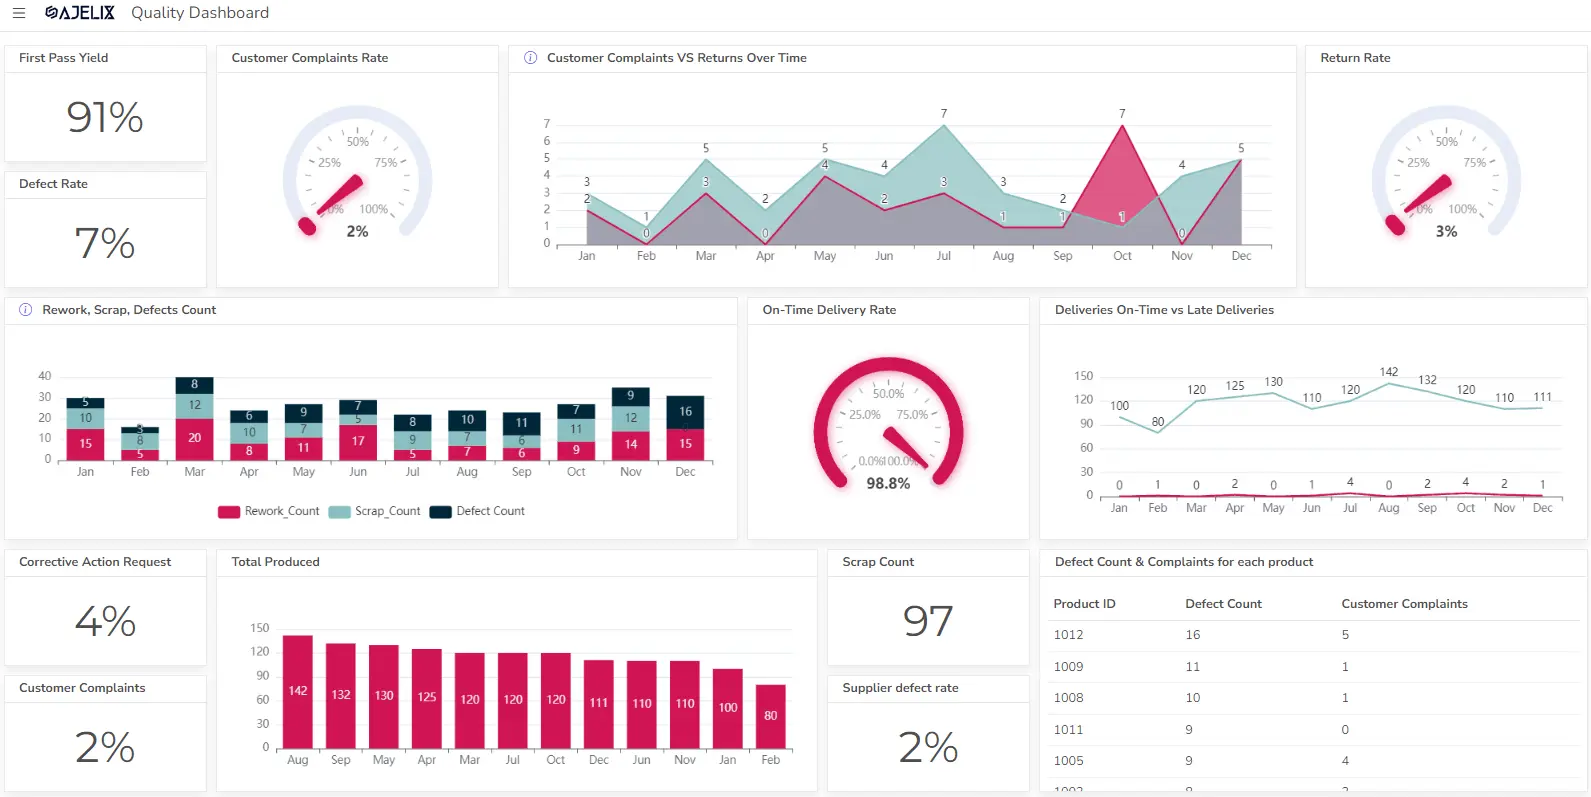
Quality dashboard example from Ajelix BI platform, image by author
Ajelix BI goes beyond basic data visualization. Its user-friendly platform boasts an easy-to-use KPI editor, allowing you to define and track key performance indicators (KPIs) central to your growth objectives. This eliminates the need for complex formulas and streamlines the process of monitoring progress.
With AI functionality businesses can create dashboards tailored to various business goals, getting started is quick and effortless.
But Ajelix BI doesn’t lock you into its ecosystem. It seamlessly integrates with your existing workflow, connecting effortlessly to your familiar tools like Excel and Google Sheets. This means you can leverage your existing data sources and continue working in your preferred environment, while Ajelix BI brings its analytical muscle to the table.
By automating calculations, providing pre-built dashboards, and offering smooth integration with your favorite tools, Ajelix BI lets you spend less time wrestling with data and more time strategizing for growth.
Reporting gives you a headache?
Upload your data and create professional reports with agentic AI

Start free
Try free and upgrade whenever
Conclusion
Calculating business growth doesn’t have to be a daunting task. By understanding the core formula and the various metrics that paint a holistic picture, you’re equipped to assess your company’s progress.
Stop spending time wrestling with spreadsheets and focus on what truly matters: strategizing for long-term success. Take control of your growth journey with Ajelix BI today.
FAQ
The core formula for calculating business growth rate is (Current Value – Past Value) / Past Value x 100%. Here, “Current Value” refers to the value of your chosen metric (e.g., revenue) at present, and “Past Value” is the same metric’s value at an earlier point.
The easiest way to measure business growth is by calculating the growth rate of a key metric relevant to your goals. This involves the formula: (Current Value – Past Value) / Past Value x 100
From data to report in one minute or less with Ajelix AI Agents


