Your Money GPS: Create a Personal Financial Dashboard

In the intricate landscape of personal finance, the beacon that shines brightest is your Personal Financial Dashboard. This is not just a tool; it’s your financial GPS, navigating you through the twists and turns of your monetary journey. In this comprehensive guide, we will delve into why a Personal Financial Dashboard is not just an option, but a necessity. Brace yourself as we embark on this financial expedition, where you’ll gain the knowledge and skills to steer your financial ship with precision.
Why a Personal Financial Dashboard Matters?
Imagine embarking on a cross-country road trip without a map or GPS. You might end up lost, disoriented, and struggling to reach your destination efficiently. Similarly, managing your finances without a Personal Financial Dashboard can leave you adrift in a sea of bills, expenses, and investments.
A Personal Financial Dashboard matters because it provides you with a consolidated view of your financial landscape. It’s the tool that helps you track your income, expenses, investments, and financial goals in one place. With this clarity, you can make informed decisions, spot potential issues, and steer your financial ship towards your desired destination.
Steps To Create A Personal Financial Dashboard
Before we dive into the intricacies of creating your Personal Financial Dashboard. Here’s where you should start:
- Identify financial goals
- Gather financial data including income, expenses, savings, etc.
- Choose the right tool for the job, such as Ajelix BI or Excel template
- Set up your personal budgeting dashboard
- Visualize financial data
- Analyze and track your finances every month to reach goals
What is a Financial Dashboard?
Financial Dashboards are dynamic tools that offer a consolidated view of your financial landscape. They serve as the bridge between your financial data and informed decision-making. But where do you start, and how do you choose the right tool for the job?
Choose your tool wisely: Options abound, ranging from the familiar terrain of Excel and Google Sheets to specialized budget-tracking software and advanced platforms like the Ajelix BI platform. Each has its merits, depending on your financial needs and preferences.
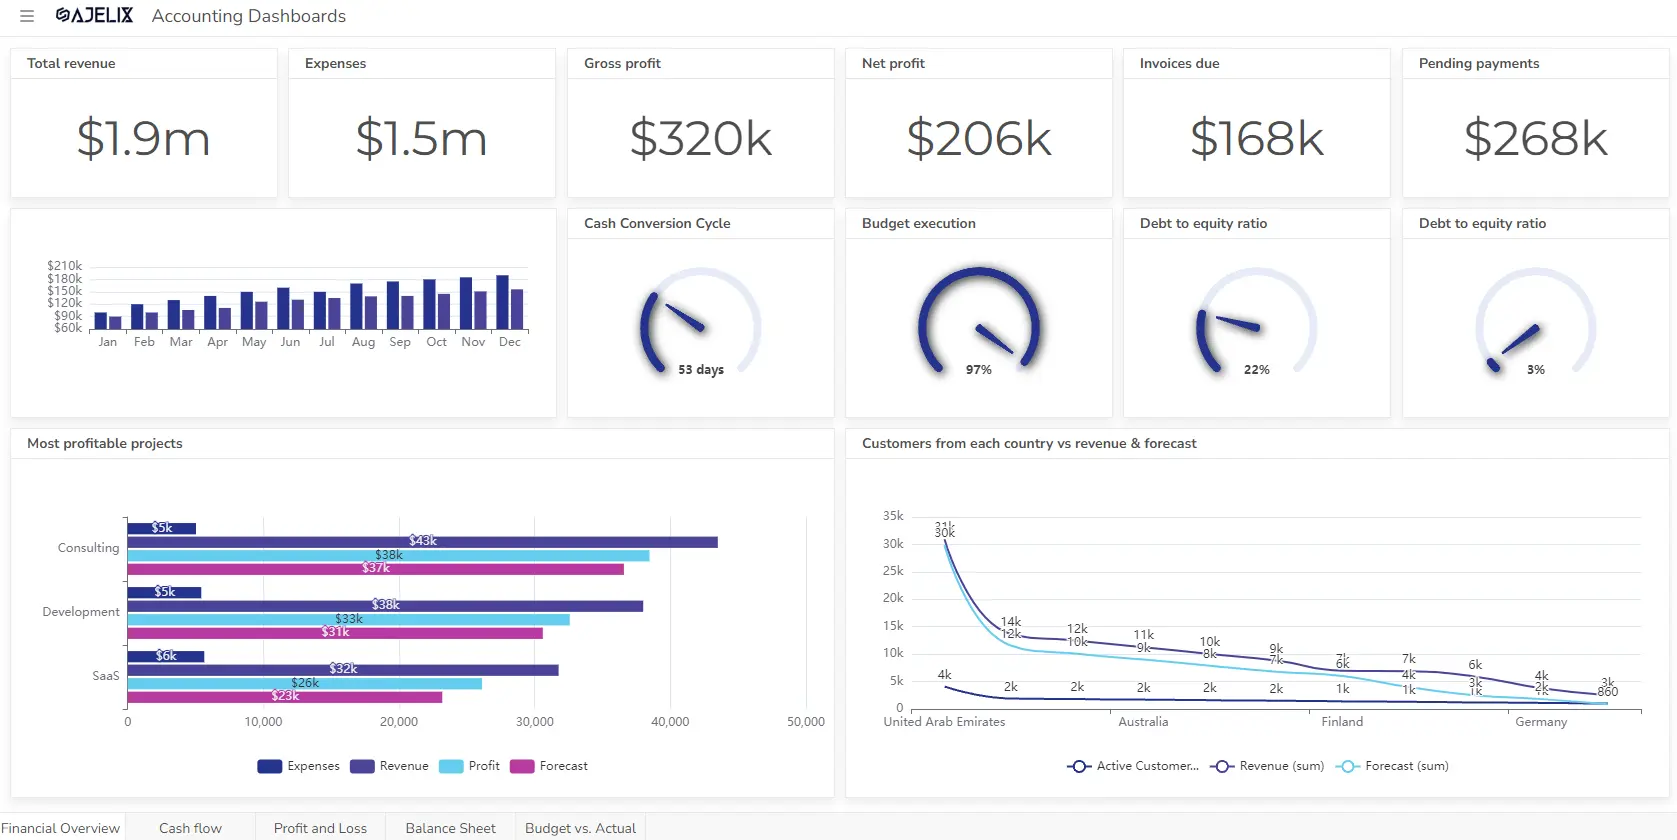
Financial Dashboard Example from Ajelix BI. Image Credit: Ajelix
Excel and Google Sheets are versatile choices, allowing you to create customized dashboards tailored to your specifics. However, for a more user-friendly and feature-rich experience, budget tracking software can be a game-changer. Meanwhile, platforms like Ajelix BI elevate the game with advanced analytics and data visualization. We have prepared a detailed guide about financial data visualization.
1. Identify Your Financial Goals
Before you embark on the journey of creating your finance dashboard, take a moment to ponder a critical question: What do you want to accomplish with your finances? These aspirations are your Financial Goals, the North Stars guiding your fiscal voyage.
Financial Goals are not mere desires; they are the strategic anchors that provide direction and purpose to your financial decisions. They range from short-term objectives like paying off debt or building an emergency fund to long-term dreams like retirement planning or buying a home.
Set SMART Goals for your financial plans
Before creating a finance dashboard, it’s crucial to identify and define your Financial Goals clearly. Each goal should be specific, measurable, achievable, relevant, and time-bound (SMART). For instance, rather than a vague goal like “save money,” specify “save $10,000 for a down payment on a house within three years.”
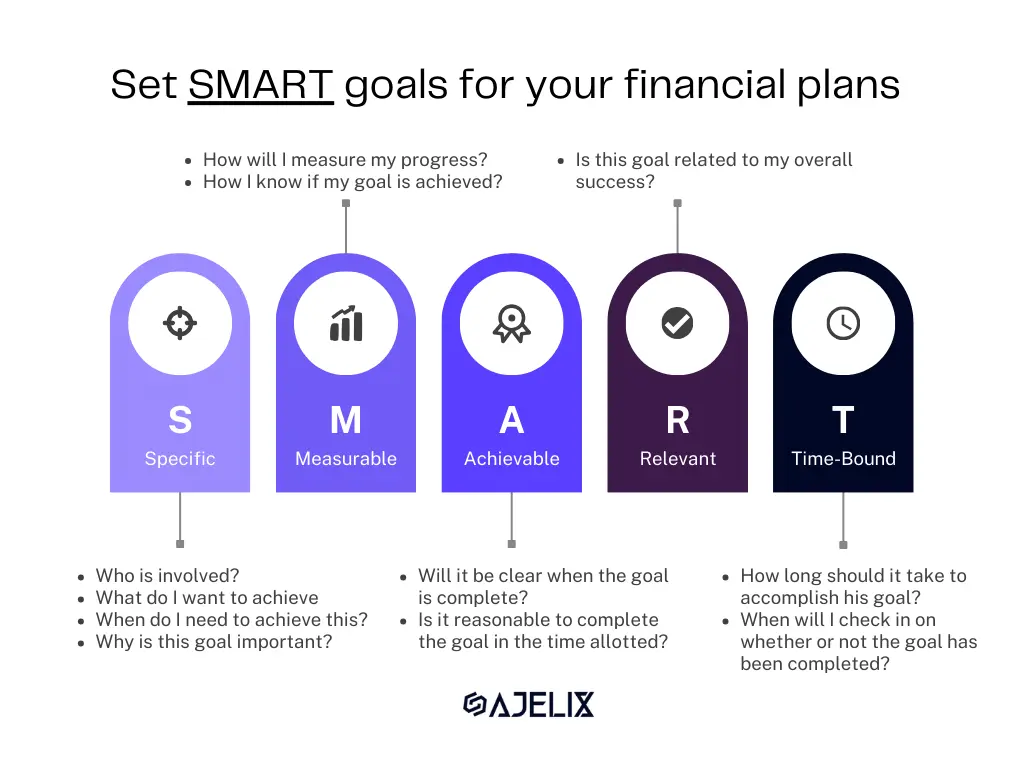
Set SMART goals for your financial plans infographic. Image Credit: Ajelix
By setting precise Financial Goals, you give your finance dashboard a purpose. It becomes the tool that not only tracks your progress but also serves as a roadmap, helping you navigate toward financial success.
2. Gather Your Financial Data
Track Income Sources
When you embark on the journey to create a finance dashboard, the first cornerstone is to diligently track your income. This process goes beyond the routine paycheck, delving into the intricacies of various income flows that sculpt your financial landscape.
10 Different types of income streams:
- Employment: Your primary job is the foundational income source for most. It’s the steady paycheck that keeps the financial engine running.
- Freelancing: Leverage your skills and expertise to offer freelance services, opening doors to a flexible income stream.
- Rental Income: If you own property, renting it out can yield a steady flow of cash.
- Interest Rates: Your savings and investments can generate income through interest rates, which can compound over time.
- Dividend Stocks: Invest in dividend-paying stocks to receive a portion of the company’s profits.
- Side Hustles: Pursue passion projects or side businesses to supplement your income.
- Royalties: If you’re a creative, royalties from books, music, or art can provide ongoing income.
- Online Courses: Share your expertise by creating and selling online courses or tutorials.
- Investment Income: Apart from stocks, investments in bonds, mutual funds, or real estate can yield periodic income.
- Passive Income Streams: Explore avenues like affiliate marketing, automated online businesses, or peer-to-peer lending for truly passive income.
Each income source paints a unique stroke on your financial canvas. Tracking them allows you to discern patterns, predict fluctuations, and make informed decisions. It’s akin to having a financial radar, scanning the horizon for opportunities and challenges.
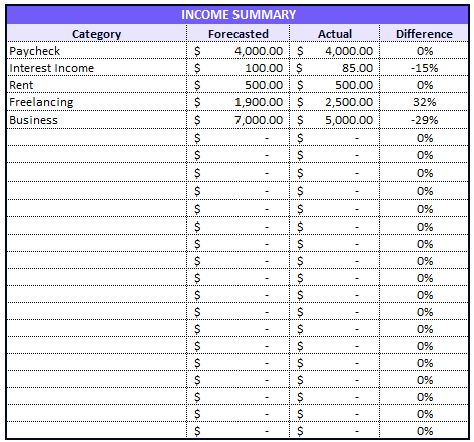
Screenshot from Excel with income tracking table. Image Credit: Ajelix
By incorporating these diverse income sources into your finance dashboard, you create a holistic view of your financial ecosystem. It’s the foundation upon which you can build a more secure and prosperous financial future. Here are the tips on how to craft dashboards that tell a story.
Add Expense Categories
As you embark on the journey to create a finance dashboard, consider it your financial palette where every expenditure is a stroke of insight. Adding expenses you have through the month is the first step, but the true art lies in categorization.
Imagine these categories as the colors on your palette, each representing a facet of your spending. Utilities, food, restaurants, loans, rent, university, insurance, and subscriptions are the vivid hues. Assign each expense to its rightful category, and suddenly, your financial canvas takes shape.
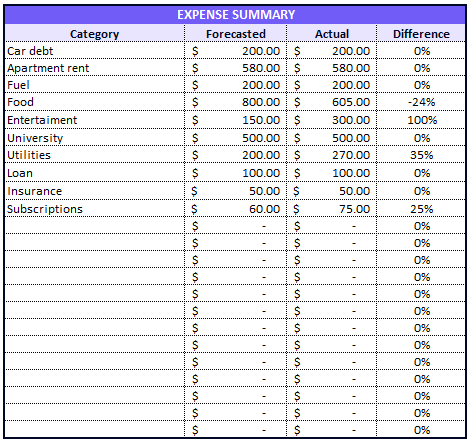
Expense tracking table from Excel. Image Credit: Ajelix
This categorization isn’t just about neat organization; it’s the foundation of financial wisdom. It allows you to see where your money flows, identify trends, and make informed decisions. It’s the difference between a chaotic splatter of expenses and a masterpiece of financial clarity. So, wield your categories wisely, and let your finance dashboard become a canvas of financial control and enlightenment.
Gather Investment Information
For a holistic financial view, gather information about your investments, including stocks, bonds, mutual funds, real estate holdings, and retirement accounts.
By compiling this wealth of investment data for your finance dashboard, you’re creating a panoramic view of your financial landscape. It’s the compass that guides you towards smarter investment decisions, helping you navigate the winding path to financial prosperity.
Add Savings Accounts
Gather data on your savings accounts, noting down the balances, interest rates, and any other pertinent details. These accounts might seem like modest players, but they are your financial safety net.
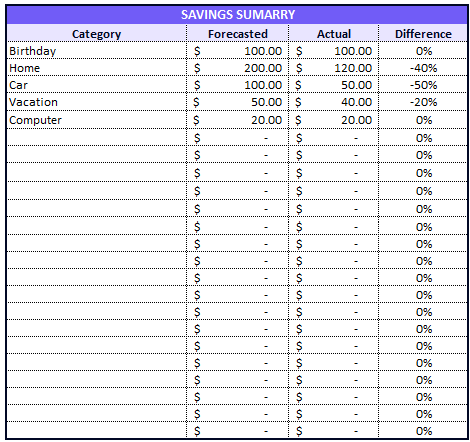
Excel table with savings summary. Image Credit: Ajelix
By adding your savings accounts to your dashboard, you’re not just keeping tabs on your financial reserves; you’re recognizing the importance of fiscal preparedness. It’s a testament to your commitment to financial well-being and a reminder that every penny saved is a step closer to your financial aspirations.
3. Choose the Right Tools and Software
Personal Budget Software Options
In this digital age, you have a plethora of software options to choose from. When it comes to managing your finances effectively, having the right tools can make all the difference. Explore the world of financial dashboard software, where options like Ajelix stand out as game-changers for your financial data tracking needs.
Create a report with Ajelix BI in one minute or less. Video Credit: Ajelix
Ajelix offers a seamless experience with its user-friendly interface, making easy data visualization a reality. No need to start from scratch; Ajelix provides you with a library of ready-to-use templates. Just upload your financial data, and you’re on your way to tracking your financial goals effortlessly. Register and enjoy freemium with Ajelix.
Excel Spreadsheet Templates
Excel templates provide a user-friendly interface to record your financial data systematically. With predefined categories and built-in formulas, they streamline the process of keeping tabs on your financial inflows and outflows.
Here’s a personal budget Excel template created by Ajelix:
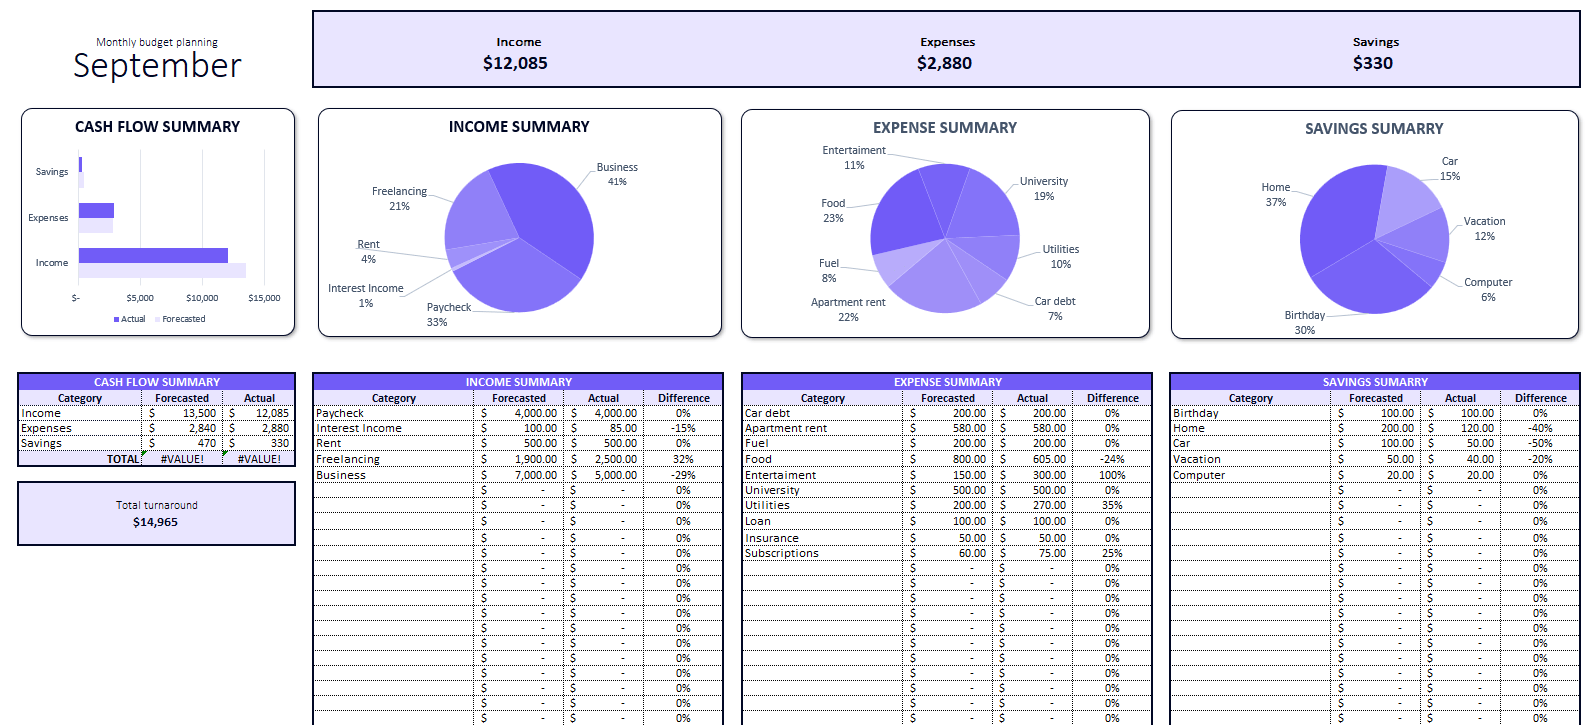
Free download Ajelix personal budget Excel template. Image Credit: Ajelix
For those seeking simplicity, basic Excel templates are a godsend. They offer an uncomplicated way to maintain financial discipline. However, if you are not an advanced Excel user you can opt for specialized data visualization software.
4. Set Up Your Personal Finance Dashboard
Organizing Your Dashboard Layout
Your dashboard’s structure matters. We’ll break down how to organize it effectively, including dedicated sections for income, expenses, and investments.
Data Entry and Updating
Consistency is key. We’ll explore the frequency of data entry and how to automate data updates to maintain accuracy.
5. Visualize Your Financial Data
Selecting the Right Charts and Graphs
Visuals speak volumes. We’ll guide you in selecting the right charts and graphs to visualize your data effectively.
Creating Visual Widgets
Widgets can simplify complex financial data. We’ll introduce widgets for budget tracking and monitoring investment performance.
Stay tuned for the next parts of this guide, where we’ll continue our journey towards mastering the art of creating your Personal Financial Dashboard.
6. Analyze Your Financial Dashboard
With your financial data neatly organized and visualized, it’s time to dive into the analytical aspect of your Personal Financial Dashboard.
Identifying Spending Patterns
Through detailed analysis, you can uncover spending patterns that might otherwise remain hidden. We’ll discuss how to perform monthly and yearly analyses to gain valuable insights into your financial behavior.
Monitoring Investment Growth
For those with investments, monitoring growth is crucial. We’ll guide you through calculating Return on Investment (ROI) and offer strategies for adjusting your investment approach to align with your goals.
Conclusion
As we wrap up this comprehensive guide, it’s clear that a Personal Financial Dashboard is not just a tool but a financial ally that empowers you to take control of your financial destiny. The power of financial visibility cannot be overstated. Armed with your newfound knowledge, you can confidently steer your financial ship towards your desired destination. So, embark on this journey with determination and remember that you have the means to shape your financial future. Take control of your finances with your Personal Financial Dashboard and watch your monetary dreams become a reality.
From data to report in one minute or less with Ajelix AI Agent