- Home
- Data Visualization
- Tools
- AI Data Analyst
- Excel Formula Generator
- Excel Formula Explainer
- Google Apps Script Generator
- Excel VBA Script Explainer
- AI VBA Code Generator
- Excel VBA Code Optimizer
- Excel VBA Code Debugger
- Google Sheets Formula Generator
- Google Apps Script Explainer
- Google Sheets Formula Explainer
- Google Apps Script Optimizer
- Google Apps Script Debugger
- AI Excel Spreadsheet Generator
- AI Excel Assistant
- AI Graph Generator
- Pricing
- Resources
Explore other articles
- 7 Productivity Tools and AI Plugins for Excel
- Julius AI Alternatives: Top 5 Choices 2026
- No Code Analytics: Top Tools in 2026
- Automation Tools for Excel in 2026: Built-In & Third-Party
- 5 Healthcare Data Analytics Trends 2026
- Best Analytics Platform For Startups In 2026
- 15 Best AI Tools For Startups In 2026 We Tried
- 7 Best AI Tools for Excel Data Analysis (2026 Comparison)
- AI Data Intelligence For Workspace
- Conversational Analytics & AI
Try AI in Excel
In the vast realm of data manipulation, the need to grapple with substantial datasets in Excel has become more pronounced. As we delve into the intricacies of managing big data within this spreadsheet powerhouse, a journey unfolds.
Revealing both the growing necessity and the challenges that arise when dealing with colossal sets of information. You can use AI-powered tools such as AI Excel Formula Generator to generate formulas from your text and other tools.
The Growing Need for Handling Big Data in Excel
In an era where data is king, organizations and individuals alike find themselves dealing with datasets of unprecedented size. Excel, a trusted ally in data management, must evolve to meet the demands of this data deluge. The growing need to handle big data in Excel stems from the desire for comprehensive analysis, strategic decision-making, and deriving meaningful insights from substantial datasets.
Common Issues with Large Datasets
However, this journey is not without its hurdles. Common issues arise when handling large datasets in Excel, ranging from sluggish performance to formula breakdowns. Navigating these challenges requires a nuanced understanding of the tools and formulas at our disposal. You might want to learn more about self-service BI as it helps analyze data and create dashboards.
Essential Excel Formulas for Data Management
SUMIFS and SUMPRODUCT: Streamlining Summation in Large Datasets
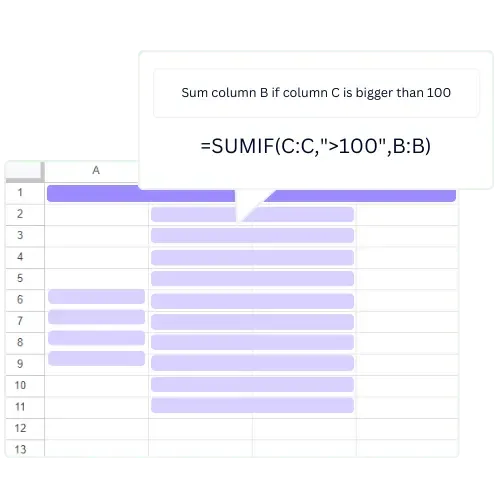
The foundational stone in our data management journey is laid with SUMIFS and SUMPRODUCT. These formulas offer a dynamic approach to summation, allowing us to streamline calculations amidst extensive datasets. By leveraging SUMIFS for conditional summation and unraveling complex calculations with SUMPRODUCT, we open avenues for precise data analysis.
INDEX and MATCH: Dynamic Data Retrieval
As we bid farewell to the static VLOOKUP, the dynamic duo of INDEX and MATCH takes center stage. This tag team revolutionizes data retrieval, enhancing flexibility and scalability. Replacing rigid formulas with the dynamic INDEX-MATCH combo empowers users to efficiently retrieve information from large and evolving datasets.
OFFSET and INDIRECT: Dynamic Range Selection
Enter the world of dynamic range selection with OFFSET and INDIRECT. These formulas enable us to navigate vast datasets effortlessly. From creating dynamic data ranges with OFFSET to harnessing the power of INDIRECT for versatile formulas, our toolkit expands, offering new possibilities for data manipulation.
AGGREGATE: Performing Complex Calculations with Ease
In the realm of complex calculations, AGGREGATE emerges as a powerhouse. This multifaceted function not only performs advanced summarization but also adeptly manages errors and handles hidden rows, making it a go-to formula for intricate data analysis.
Optimizing Formulas for Speed and Efficiency
Using IFERROR: Taming Errors in Large Datasets
In the unpredictable landscape of data analysis, errors are inevitable. Enter IFERROR, a guardian against formula breakdowns. Exploring error-handling strategies and preventive measures, IFERROR becomes a valuable ally in maintaining the integrity of our analyses within large datasets.
Calculation Tricks with Excel Tables
The transformation of data ranges into Excel Tables unveils a world of calculation tricks. Converting data into tables not only enhances the aesthetics of our spreadsheet but also leverages table features for efficient data handling. This section unveils the magic hidden within Excel Tables.
MINIFS and MAXIFS: Extracting Extremes with Precision
Precision is paramount when dealing with large datasets. MINIFS and MAXIFS step into the spotlight, allowing us to find the minimum and maximum values with specific conditions. Incorporating these formulas into data analysis provides a nuanced approach to extracting extremes.
Efficient Data Sorting with SORT and FILTER
Data sorting becomes a breeze with the introduction of SORT and FILTER. Simplifying the sorting process with the SORT function and delving into dynamic filtering with FILTER, we enhance our ability to organize and extract valuable insights from extensive datasets. For advanced filtering you might want to try data visualization tools, as Excel provides limited filtering options.
Advanced Analysis Techniques
AVERAGEIFS: Calculating Weighted Averages
Moving beyond the simple average, AVERAGEIFS introduces us to the world of weighted averages. Custom weighting strategies come into play, providing a more accurate representation of data trends. Dynamic weighted averages with AVERAGEIFS become a key tool in our arsenal.
CHOOSE and MATCH: Creating Dynamic Dropdowns
Dynamic dropdowns elevate our data interaction experience. CHOOSE, combined with MATCH, enables the creation of interactive dropdown menus. Building these dynamic choices empowers users to navigate and analyze large datasets with enhanced ease and precision.
TEXT and CONCATENATE: Formatting and Combining Data
Data presentation is an art. TEXT and CONCATENATE emerge as the paintbrush and palette, allowing us to transform data formats and concatenate strings for a visually enriched presentation. This section explores the creative side of data manipulation.
Struggling with your Excel formulas?
Looking for a faster and easier way to write Excel formulas? Try AI Excel Formula Generator and turn your text into formulas with just a few clicks.
Handling Date and Time in Large Datasets
DATE and TIME: Simplifying Date and Time Calculations
Date and time calculations often present a challenge. Enter DATE and TIME, simplifying the complex landscape of date-related tasks. Efficient date formatting with the DATE function and easy time calculations with TIME make handling temporal data a seamless endeavor.
TIMEVALUE and NOW: Real-Time Time Management
In the realm of real-time data, TIMEVALUE and NOW take the lead. Extracting time values from text with TIMEVALUE and incorporating real-time data with the NOW function open up avenues for dynamic and up-to-the-minute analyses. You can try using BI tools that would help with real-time analytics.
Conclusion
As we reach the culmination of our exploration, a recap of key formulas for efficient data handling solidifies our understanding. Armed with an arsenal of advanced techniques, we embark on future Excel endeavors with confidence, mastering the art of handling large datasets and empowering our data analysis experience.
These are just a few of the most useful Excel formulas for working with large datasets. There are many more formulas and tools available in Excel that can help you quickly analyze and manipulate large datasets. With the right formulas and tools, you can make short work of large datasets in Excel.
Learn more about the Excel AI Assistant features. Explore other Excel productivity tools that can help you boost your efficiency.
Follow us on Twitter and Linkedin for more tips & tricks and updates.
Speed up your spreadsheet tasks with Ajelix AI in Excel
