How To Calculate Profitability Index In Excel

Profitability Index is a financial metric that is commonly used to evaluate the potential profitability of an investment project. It is a ratio of the present value of future cash flows to the initial investment cost.
Calculating the profitability allows investors to determine whether a project will be profitable or not. In this article, we will walk you through the steps to calculate profitability in Excel.
What is the Profitability Index?
The profitability index formula is a measure of the profitability of an investment. It is calculated by dividing the present value of future cash flows by the initial investment cost.
- If the index is greater than 1, then the project is expected to be profitable.
- If it is less than 1, the project is expected to be unprofitable.
What is the Formula for the Profitability Index?
Profitability Index = Present Value of Future Cash Flows / Initial Investment
or
Profitability Index = NPV / Initial Investment +1
The present value of future cash flows can be calculated using the formula:
Present Value = Cash Flow / (1 + Discount Rate) ^ Time Period
Significance of Profitability Index
An index is a useful tool for investors to evaluate the profitability of a project. It takes into account the time value of money. Which means that cash inflows in the future are worth less than cash flows today. By using the profitability, investors can determine the potential profitability of an investment project.
Struggling with manual calculations & tiring setups?
Let agentic AI do the heavy lifting.
Start free
Fast sign up & easy setup
How To Calculate Profitability Index in Excel?
The Profitability Index (PI) is a financial metric used to assess the attractiveness of an investment. It considers the present value of future cash flows compared to the initial investment cost.
Time needed: 10 minutes
Here’s a step-by-step guide on calculating index in Excel, along with an example:
- Prepare Your Data
Create a table with the following columns:
– Year: List the years for which you have cash flow projections (e.g., Year 1, Year 2, Year 3).
– Cash Flow: Enter the expected cash flow (inflow or outflow) for each year. Inflows (positive values) represent revenue or savings, while outflows (negative values) represent costs or expenses. The initial investment should be included here as a negative outflow in year 0 (before year 1).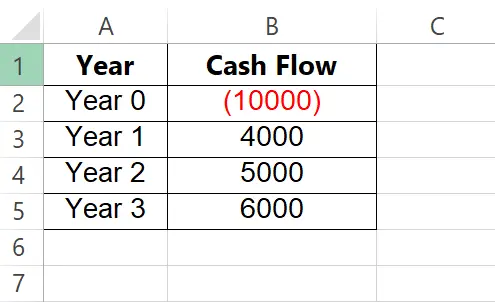
- Apply the Net Present Value (NPV) Function
We need the Net Present Value (NPV) to calculate index. The NPV function considers the time value of money by discounting future cash flows to their present value.
In an empty cell, enter the formula:=NPV(discount_rate, cash_flow_range).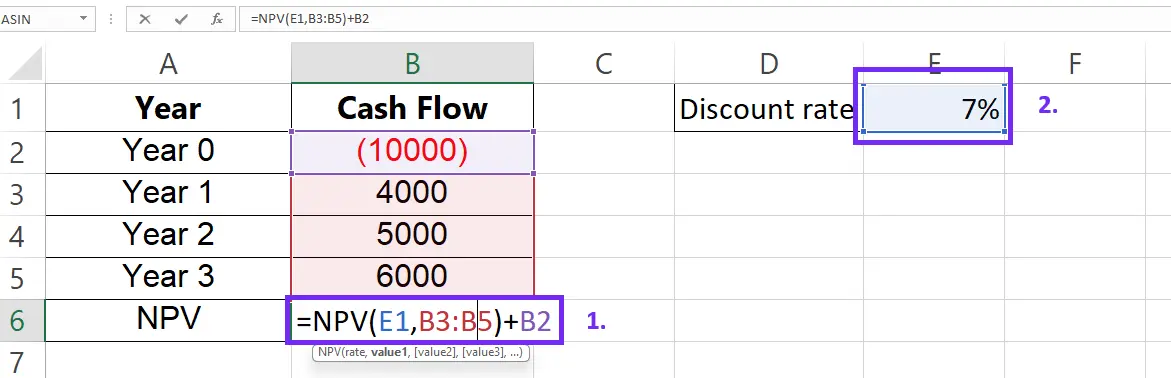
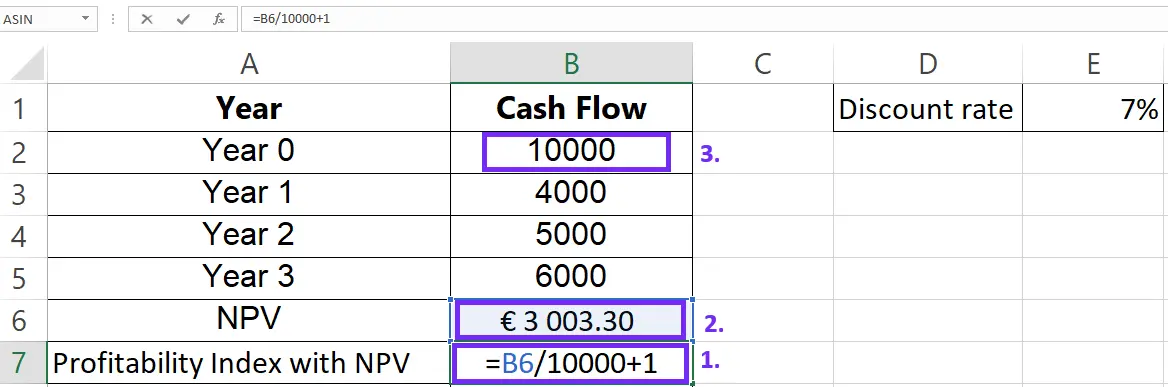
- Calculate the Profitability Index (PI) Using NPV
In another empty cell, enter the formula to calculate PI: =NPV/Initial Investment + 1.
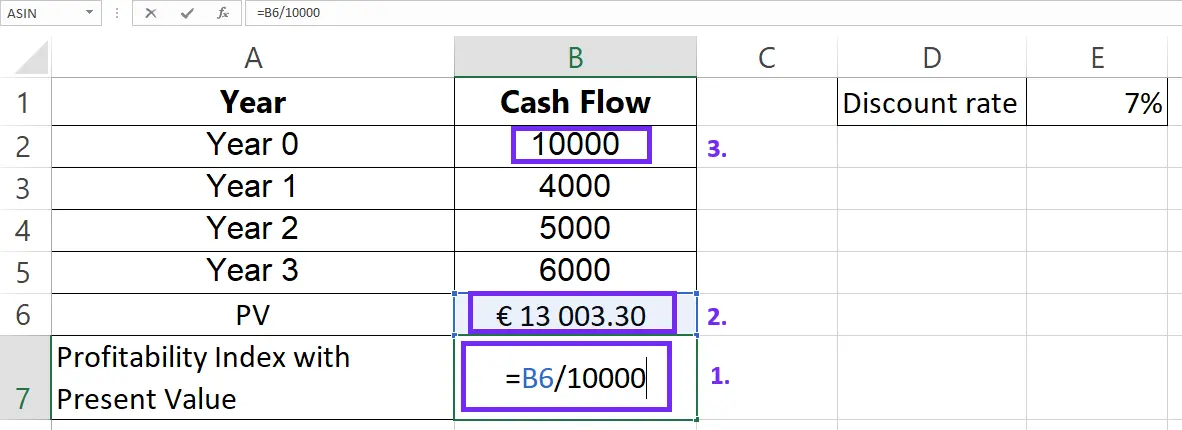
- Calculate the Profitability Index (PI) Using PV
If you have value indicating present value you can calculate index using this formula PI= Present Value of Future Cash Flows / Initial Investment
- Interpret the Result
Since the PI (1.3) is greater than 1, this investment project appears to be profitable. For every $1 invested, the project is expected to generate a return of $1.30 based on the present value of future cash flows.
Additional Notes:
- You can adjust the discount rate in the NPV formula to see how it affects the PI and overall attractiveness of the investment.
- This is a basic example. Real-world scenarios might involve more complex cash flow patterns and require further analysis.
How To Interpret Profitability Index Results?
A profitability index of 1 means that the project is expected to break even. A profitability greater than 1 means that the project is expected to be profitable. While an index of less than 1 means that the project is expected to be unprofitable.
Using Profitability Index to Make Investment Decisions
Investors can use the profitability to compare the potential profitability of different investment projects. The project with the highest index should be the preferred investment. While PI helps compare projects on paper, family offices and investment teams benefit from centralizing real-world data too. Using family office management software to connect bank and brokerage accounts, capture private asset cash flows, and store deal documents creates a single source of truth. With consolidated data, you can export schedules to Excel for NPV/PI modeling, build customized performance reports, and set alerts that flag when assumptions drift—making it faster to validate PI results and rebalance portfolios.
Sensitivity Analysis in Excel
Sensitivity analysis is a technique used to test the sensitivity of a project’s profitability to changes in key assumptions. To conduct sensitivity analysis for the profitability, change the discount rate and observe the effect on the profitability formula.
What Are The Limitations of the Profitability Index?
The profitability index does not take into account:
- the size of the project,
- the timing of cash flows,
- or the risk associated with the project.
Investors should use the profitability index in conjunction with other investment appraisal methods.
Conclusion
Calculating the profitability index in Excel is a useful tool for investors to evaluate the potential profitability of an investment project. Steps outlined in this article, investors can determine the profitability index of a project to make informed investment decisions. Financial modeling can help not only investors but businesses to determine the present value (PV) of future cash flows initial investment
Learn more about Excel and Google Sheets hacks in other articles. Stay connected with us on social media and receive more daily tips and updates.
FAQ
The profitability index (PI) is a measure used to evaluate investment opportunities. By comparing the present value of expected future cash flows to the initial investment.
– A PI of 1 indicates that the project will generate exactly enough value to cover its costs.
– A PI greater than 1 indicates that the project is profitable.
– While a PI less than 1 indicates that the project is not profitable.
Compare the PI of each project to determine which project offers the greatest return on investment. Generally, projects with a PI greater than 1 are considered acceptable as they generate more value than their costs. Thus, investment decisions can be made based on the PI calculations.
To calculate PI in Excel, you need to know the initial investment, cash flows, time period, and discount rate. The initial investment is the amount required to start the project. Cash flows are the expected future returns. The time period or the number of periods is the length of time for the investment to generate returns.
And the discount rate is used to calculate the present value of the cash flows over the given time period. By inputting this information into Excel, you can calculate the PI and evaluate investment opportunities.
Speed up your spreadsheet tasks with Ajelix AI in Excel