Tag: Finance
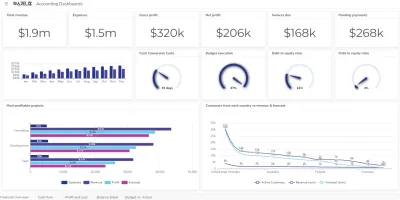
Tired of sifting through endless spreadsheets? Imagine a dashboard that provides a real-time snapshot of your company’s financial health. Our CFO Dashboard example showcases essential KPIs to help you make informed decisions and create a dashboard for your business needs.
Financial dashboards...
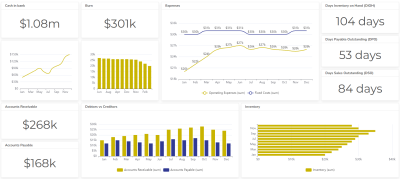
Cash Flow Dashboard Example For Mastering Your Finances
Research from Deloitte indicates that organisations that embrace data-driven decision-making have a 17% higher chance of outshining their competitors. Intriguing, right? Wonder how to achieve that?
One of the ways is creating a cash flow dashboard, as it provides the data you need to make informed...
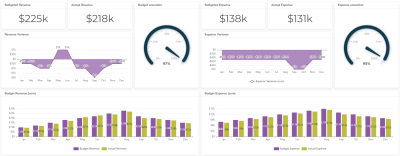
Budget vs Actual Dashboard Example: Variance Analysis
A robust budgeting and reporting system is essential to track and analyze financial health. One crucial tool that can help you do that is the budget vs actual dashboard. By visually comparing budgeted figures against actual results, businesses can quickly identify variances, make adjustments, and...
Online Profit And Loss Dashboard Example: P&L Template
A well-designed online profit and loss dashboard can be a game-changer for businesses. By visualizing key metrics, you can quickly assess your financial health and make data-driven decisions.
An online profit and loss (P&L) dashboard is a powerful tool that can provide you with real-time...
Online Accounting Dashboard Examples For Accountants
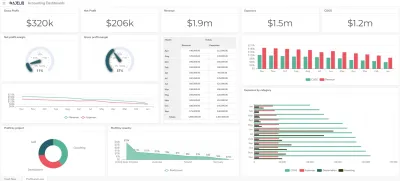
An accounting dashboard is a centralized platform that tracks your business’s real-time financial performance. It presents key financial metrics and data in a visually appealing and easy-to-understand format.
Think of it as a real-time financial snapshot, highlighting trends, anomalies,...
20 KPI For Finance Department
KPI for finance department are clear, measurable numbers that show how well your business is performing financially. These metrics help you see if you’re hitting your goals and where you might need to make changes. Tracking the right KPIs gives you a real look at your company’s strengths and weaknesses,...
15 Accounting KPIs For Your Accounting Department
Accounting KPIs are measurable metrics that track the performance of an accounting department and finances. These metrics help accountants assess efficiency, accuracy, and how well the business is meeting financial goals.
There are different KPIs for accounting functions, but some common ones...
Free EBITDA Calculator Online: Calculate Margin
An EBITDA calculator is a tool that helps you calculate a company’s Earnings Before Interest, Taxes, Depreciation, and Amortization. It essentially simplifies the process of assessing a company’s core operating profit.
Calculate EBIT/EBITDA
...
Free EBIT Calculator Online With Formula Examples
An EBIT calculator is a tool that helps you calculate a company’s earnings before interest and taxes (EBIT). EBIT is a financial metric that shows a company’s profitability from its core operations, excluding the effects of financing decisions and taxes.
...
Free Business Loan Calculator Online: Calculate Loan
A business loan calculator is a tool that helps you estimate the monthly payments, total interest, and overall cost of a business loan. It considers factors like loan amount, interest rate, and loan term to give you a clearer picture of how much the loan will cost you.
...
Dividend Calculator Free Online: Calculate Investments
A dividend calculator is a financial tool that helps investors figure out how much money they’ll get from stock dividends. It typically considers factors like the number of shares owned, current stock price, and dividend amount.
Dividend Calculator
...
Free ROI Calculator Online: Calculate Return On Investment
An ROI calculator is a tool that helps you figure out the return on investment for something. ROI is a percentage that tells you how much profit you make compared to how much you spend. So an ROI calculator helps you see if something is a good investment financially.
...
Free Percentage Calculator Online: Calculate Percent
A percentage calculator is a tool that helps you with math involving percentages. It can find a percentage of a number, increase/decrease a number by a percentage, and more. It helps you with any calculation that involves %.
Percentage Calculator
...
Free Gross Profit Margin Calculator Online
A gross profit margin calculator is a financial tool that tells you how much profit a company makes after covering the direct costs of producing the goods or services it sells.
Calculate Profit Margin
Gross
...
Free Net Profit Margin Calculator Online
The Net Profit Margin Calculator is a financial tool that shows what portion of your sales revenue is left as a profit after covering all business expenses, including COGS, operating expenses, interest, and taxes.
Calculate Profit Margin
...
Free Liquid Net Worth Calculator Online
A liquid net worth calculator can help you measure your financial flexibility in the short term. It essentially tells you how much cash you have readily available or can convert to cash quickly in case of emergencies or unexpected needs.
Calculate Liquid...
Customer Retention Rate Calculator (Free & Online)
The customer retention rate calculator can help you determine what percentage of your customers stay with you over a specific period. A high retention rate indicates a strong customer base and a healthy business.
Calculate Customer Retention...
Profitability Index Calculator: Free & Online
The profitability index calculator is a financial tool used to judge the attractiveness of an investment. It essentially compares the present value of all the future cash flows you expect to earn from an investment with the initial amount you need to put in. Profitability index, also called PI calculator...
Revenue Per Employee Calculator: Free & Online
Revenue per employee calculator is a metric that measures how much revenue each employee generates for a company. It’s a way to assess how efficient your workforce is at bringing in money.
Revenue per employee calculator helps businesses understand if they’re getting a good return...
Free Customer Acquisition Cost Calculator Online
Customer Acquisition Cost Calculator, or CAC, is a metric that tells a business how much it costs to acquire a new customer. It factors in all the sales and marketing expenses involved in converting someone into a paying customer.
Calculate Customer...
Free Break-Even Point Calculator Online
A break-even point calculator helps you determine the sales volume (units sold or revenue earned) needed to cover all your business costs (fixed and variable). In simpler terms, it tells you when your business will stop losing money and start making a profit.
...
How to Calculate Business Growth Rate? Formula & Examples
Whether you’re a seasoned entrepreneur or just starting, measuring progress is vital to identifying areas of strength, pinpointing opportunities for improvement, and propelling your business forward. 🚀
TL;DR
Business growth is measured by comparing a metric over two periods using the...
Calculate Average Revenue Per User: ARPU Formula & Meaning
The metrics are king, there’s no doubt about it. They tell the story of your company’s health, customer base, and overall success. But with so many acronyms flying around, it’s easy to get lost in the alphabet soup. 🥣 Today, we’re diving into ARPU formula, a metric crucial...
How To Calculate Revenue Growth Rate In Excel With Formula
The revenue growth rate is a performance indicator that shows if your sales efforts are yielding positive results. Tracking it over time is crucial to identify trends, pinpoint periods of acceleration or stagnation, and adjust your strategies accordingly.
TL;DR
Revenue growth rate shows how...
Financial Business Intelligence: Solve Your Data Tasks
Financial business intelligence uses data analytics to unlock insights specifically from a company’s financial data. Measuring business financial health is vital for any manager or owner to understand what is happening in your company.
TL;DR
Financial business intelligence (BI) uses...
12 KPIs For HR Department Manager
HR managers require a data-driven approach and this is where HR manager KPIs are vital. KPIs for HR illuminate the effectiveness of HR initiatives, providing insights to optimize strategies, demonstrate value, and propel the organization forward.
Every HR professional plays a vital role in fostering...
Year Over Year (YoY) Growth Formula With Examples
YOY growth, or year-over-year growth, is a metric that compares a specific value (e.g., revenue, profits) in the current period to the same period one year prior. It essentially tells you how much something has grown (or declined) over the past year.
Growth. 🌱 It’s the lifeblood of any business,...
11 Best Operational KPIs For Operations Managers
Operational KPIs are measurable values that track the efficiency of a company’s day-to-day operations. They help managers assess how well things are running and identify areas for improvement.
Imagine being stuck in a maze without a map. 🗺️ That’s what managing operations can feel...
19+ Small Business KPIs To Measure
As a small business owner, you are improving your business and making it more successful. But how do you know if you’re on the right track? That’s where small business KPIs come in. 📶
KPIs are values that measure the performance of your business against specific goals. By tracking...
Your Money GPS: Create a Personal Financial Dashboard
In the intricate landscape of personal finance, the beacon that shines brightest is your Personal Financial Dashboard. This is not just a tool; it’s your financial GPS, navigating you through the twists and turns of your monetary journey. In this comprehensive guide, we will delve into why...
Financial Data Visualization Examples and Best Practices
Financial data visualization is taking complex financial information like profits, sales, and expenses and turning it into easy-to-understand charts, graphs, and other visuals. It’s basically about making financial data clear and actionable.
In this article, we’ll dive into the significance...
Useful Excel Formulas for Financial Modeling Training
In today’s fast-paced financial world, mastering financial modeling isn’t just an advantage—it’s a necessity. It helps finance professionals to analyze data, identify trends, and make predictions about the future of their organization.
And guess what? Despite the rise of new technologies, Excel...


