Calculate Average Revenue Per User: ARPU Formula & Meaning

The metrics are king, there’s no doubt about it. They tell the story of your company’s health, customer base, and overall success. But with so many acronyms flying around, it’s easy to get lost in the alphabet soup. 🥣 Today, we’re diving into ARPU formula, a metric crucial for understanding the value of your customers.
TL;DR
ARPU (Average Revenue Per User) measures how much revenue you earn per customer over a set period. It’s calculated as Total Revenue ÷ Number of Users and helps you understand customer value, monetization effectiveness, and growth trends. ARPU includes all users, while ARPPU looks only at paying users. You can calculate ARPU manually, in Excel, or automatically with tools like Ajelix, which simplifies data analysis with AI. Benchmarks vary by industry, so track ARPU over time to gauge performance and guide pricing, marketing, and retention strategies.
This article will break down ARPU in simple terms, explain how it’s calculated, and explore why it matters for your business:
- ARPU definition
- ARPU formula
- How to calculate in 5 simple steps
- ARPU vs ARPPU
- Steps to calculate average revenue per user in Excel
- Calculate ARPU in Ajelix BI
- Similar formulas
- Is ARPU monthly or annual rate?
- Good rate
Change the way you work with agentic AI
One-click dashboards,KPI tracking, and AI-powered insights—for work that actually gets done.

What is ARPU?
ARPU (Average Revenue Per User) is a metric that tells you how much money your business makes, on average, from each customer over a specific period. It’s a key measurement for companies with subscription-based models, such as phone carriers, streaming services, or software-as-a-service (SaaS) businesses.
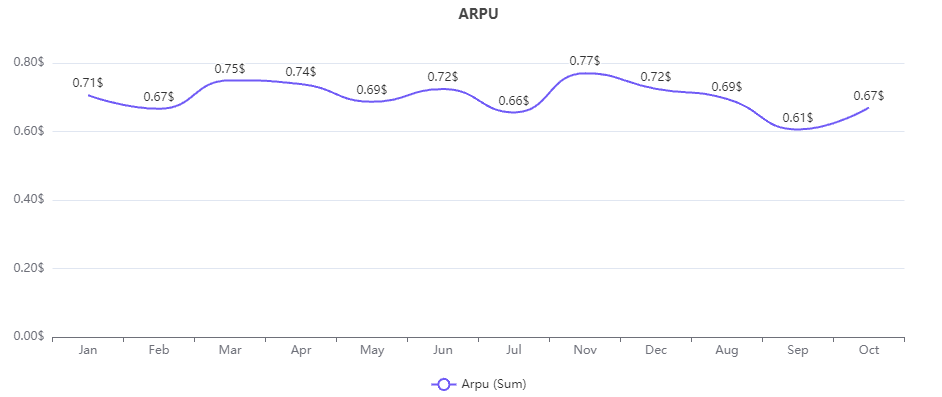
The average revenue per user line chart created on Ajelix BI, image by author
By dividing your total revenue by the number of users, you get the ARPU. This tells you how effective you are at monetizing your customer base.
ARPU Formula
ARPU = Total Revenue / Number of Users (over a specific period)
Explanation:
- Total Revenue: represents all the income your business generates within a chosen timeframe, typically a month or a year.
- Number of Users: the total number of customers you have during that same timeframe. Both paying and non-paying users can be included depending on your specific needs.
How To Calculate ARPU?
Time needed: 3 minutes
Here’s a step-by-step guide on how to calculate average revenue per user:
- Define the Timeframe
The first step is to set the period over which you’ll calculate ARPU. This timeframe should be relevant to your business cycle and how you typically track revenue and users. Common choices include months, quarters, or years.
- Gather Revenue Data
Next, collect your total revenue for the chosen timeframe. This includes all the income your business generated during that period.
- Determine the User Base
Identify the total number of users within the same timeframe you selected for revenue. This can include all users, both paying and non-paying.
- Apply the ARPU Formula
Once you have your total revenue and user count, use the ARPU calculation: ARPU = Total Revenue / Number of Users
- Interpret the ARPU
The ARPU value you obtain represents the average revenue generated by each user over the chosen timeframe. Analyze this metric in the context of your business model and industry.
aRPU vs aRPPU
- ARPU considers all your users, both paying and non-paying, within a specific timeframe (month, quarter, year). It gives you a general idea of the average revenue you generate per customer.
- ARPPU focuses solely on paying users. It calculates the average revenue generated by users who actually pay for your service or product within the chosen timeframe.
Here’s a table summarizing the key differences:
| Metric | Who’s Included | Use Case |
|---|---|---|
| ARPU | All Users (Paying & Non-Paying) | Provides a general picture of average revenue per customer |
| ARPPU | Paying Users Only | Indicates how much revenue you generate, on average, from paying customers |
How To Calculate ARPU in Excel?
1. Prepare your Data
The first step is to organize your data. Create a spreadsheet in Excel with two columns:
- Revenue: This column should contain your revenue data over the chosen timeframe (month, quarter, year).
- Users: In a separate column, list the total count of users within the period.
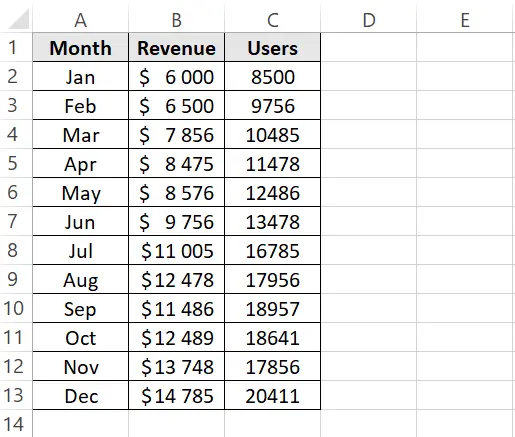
Screenshot from Excel with an example of how to prepare data in a table, image by author
2. Calculate Average Revenue Per User:
Create an additional column and insert the ARPU formula to get the average revenue per user. Here’s the formula:
=Total revenue / total users
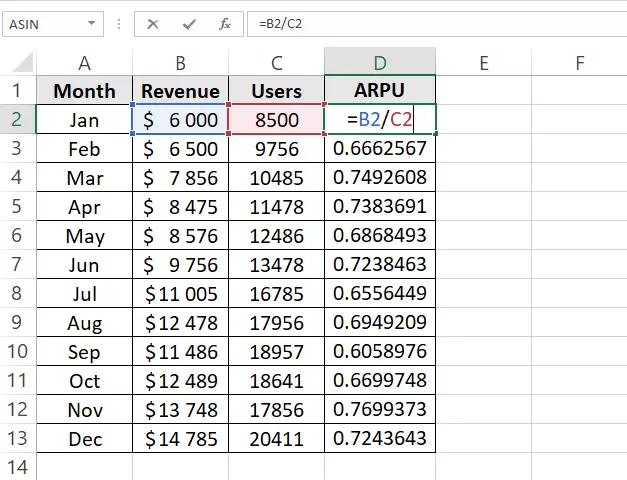
ARPU formula in Excel, image by author
In our example, the ARPU formula is =B2/C2, which will return a number.
3. Format ARPU number
For better visibility format the result as a currency. Here are the steps to do that:
- Select the ARPU column
- Go to the Excel toolbar “Home” section
- Find the “Number” settings and click on “Currency” settings
- Select the corresponding currency and your results will be converted
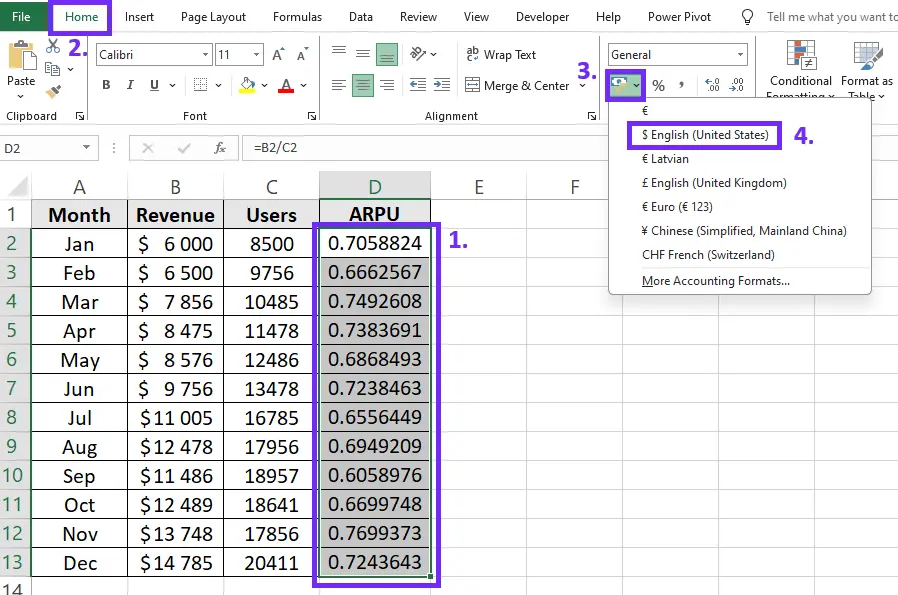
Screenshot from Excel with steps on how to format ARPU results as currency, image by author
4. Visualize ARPU results
The best way to interpret calculations is to create charts to visualize trends and correlations. To better represent average revenue per user results insert chart. To do that follow these steps:
- Select the period and ARPU result column
- Go to the “Insert” section on the Excel toolbar
- Click on “Recommended Charts”
- Select the chart type, for example, line chart
- Confirm the selection
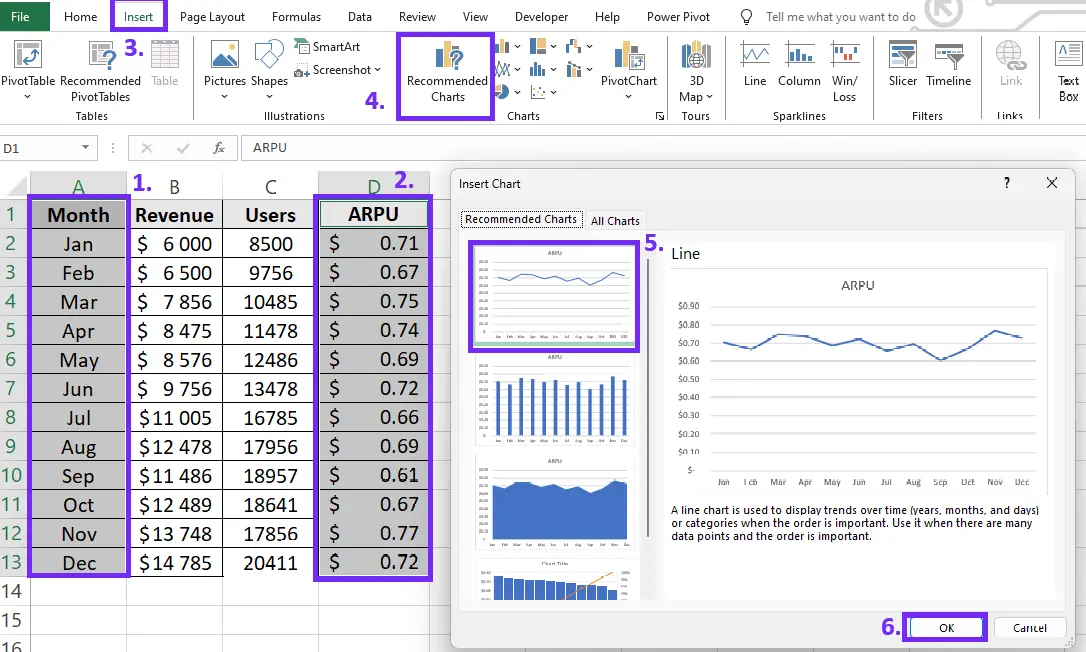
Steps on how to insert ARPU chart in Excel, screenshot by author
Once you have the chart you can customize it by adding data labels and applying colors.
Here’s how to calculate average revenue per user in Excel
How To Calculate ARPU on Ajelix BI?
Yes, there’s a more convenient way to measure average revenue per user regularly using the Ajelix BI platform. This BI platform is designed for business owners and managers to ease the data visualization process. Here are the steps on how non-technical teams can use Ajelix to calculate ARPU to create a more trustworthy reporting process.
1. Prepare your data
The first step involves organizing your data in an Excel or Google Sheets spreadsheet. We’ll use the example of calculating ARPU for each month to illustrate how your data should be structured.
Screenshot from Excel with tabular data table, picture by author
2. Upload Your Data
Navigate to the Ajelix BI platform’s dataset upload page, click the “add data” button, and select your prepared file. This will initiate the upload process within Ajelix BI.
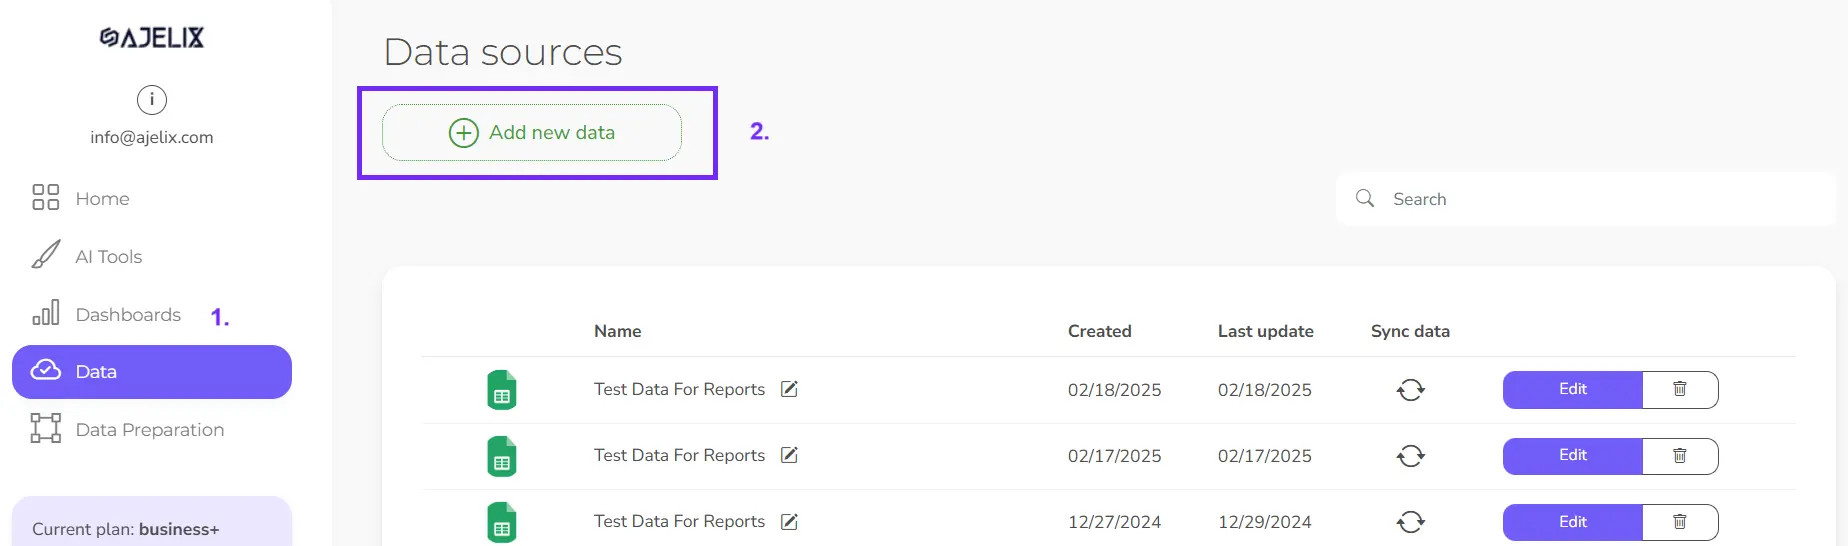
Screenshot from Ajelix BI with data upload, image by author
3. Create calculation
After uploading your file, you can create a report and access the editing tools. Look for “Create KPI or metric” and click “Add new measure.” This will open a window where you can easily calculate ARPU by selecting the relevant columns from your data. See the example below for reference.
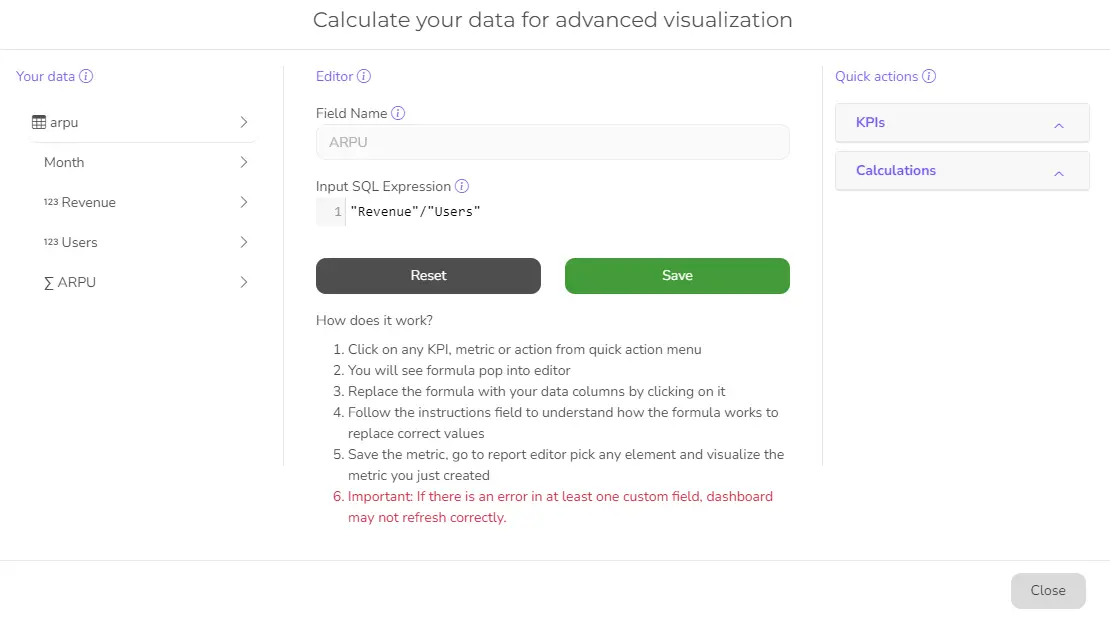
Ajelix BI metric creator example with ARPU formula, screenshot by author
4. Create chart
Now you have created a new column with the “ARPU” metric. The next step would be to visualize this column in a pretty chart.
- Go to “Report Editor”
- Pick the “Smooth Line Chart” or other element
- Add the title “ARPU” or another title
- Set number formatting to 0.00$
- Pick the category “Month”
- Add new created “ARPU” as a data field
Now you have created a chart that you can share with others and update regularly.
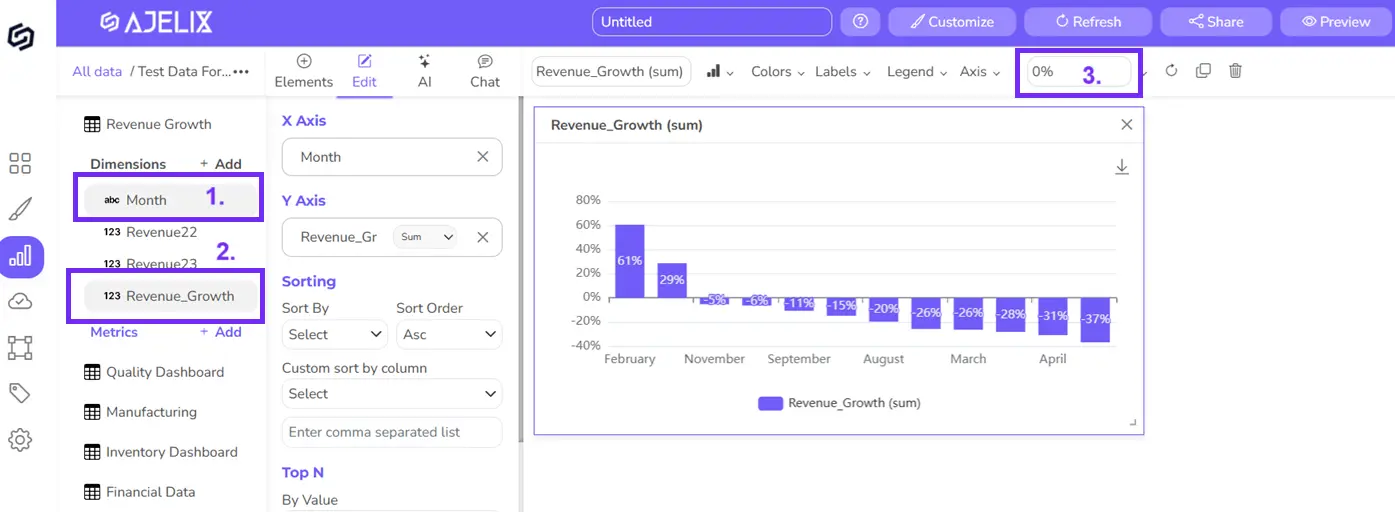
Ajelix BI settings for creating ARPU chart, screenshot from author
Reporting gives you a headache?
Upload your data and create professional reports with agentic AI

Start free
Try free and upgrade whenever
Similar formulas to ARPU
You can use other formulas depending on what aspect of user value you want to understand. Here are some similar formulas to ARPU:
1. Average Revenue Per Paying User (ARPPU)
This is a variation of ARPU that focuses specifically on revenue generated by paying users. It’s particularly useful for businesses with freemium models or a mix of free and paid subscriptions.
Formula: ARPPU = Total Revenue from Paying Users / Number of Paying Users
2. Customer Lifetime Value (CLTV)
This metric goes beyond a single period and estimates the total revenue a customer brings to your business over their entire relationship. It’s a more comprehensive measure of customer value.
CLTV calculation methods can vary, but a common approach is: CLTV = Average Revenue per User (ARPU) * Average Customer Lifespan
3. Customer Acquisition Cost (CAC)
This metric represents the average cost of acquiring a new customer. It’s important to understand CAC in relation to ARPU and CLTV to assess the profitability of your customer acquisition strategies.
Formula: CAC = Total Customer Acquisition Costs / Number of New Customers Acquired
4. Customer Churn Rate
This metric represents the percentage of customers who discontinue using your service or product within a specific period. It’s crucial to track churn rate to identify areas for improvement in customer retention.
Formula: Customer Churn Rate = (Number of Customers Lost in Period / Total Number of Customers at Start of Period) x 100
is aRPU monthly or annual?
ARPU (Average Revenue Per User) can be calculated both monthly and annually, depending on your needs and the specifics of your business.
Monthly ARPU is the most common way to calculate ARPU, especially for subscription-based businesses that have recurring monthly billing cycles.
Annual ARPU might be suitable for businesses with longer customer lifespans or annual billing cycles.
What is a good ARPU?
There’s no single answer to what a “good” ARPU is. It depends heavily on several factors specific to your business and industry. Based on the research from Mondaynote the biggest brands such as Amazon have an ARPU of 752$, Google 256$, and Apple 194$.
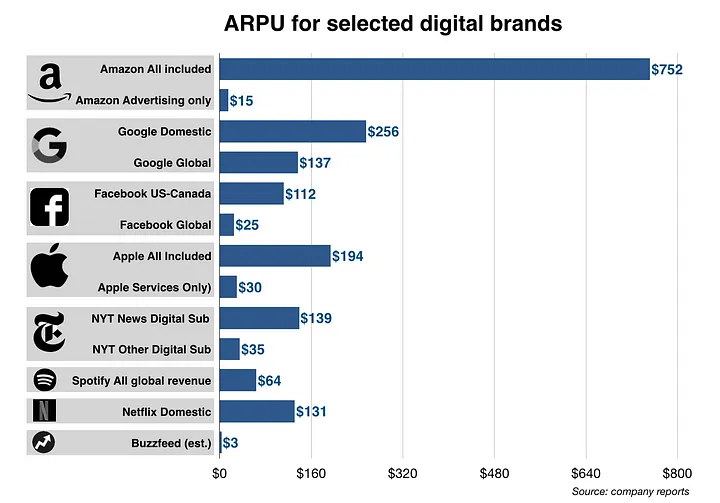
ARPU for most popular digital brands, image from Mondaynote.com
The best way to define a good ARPU is to search for benchmarks in your industry. Monitor your ARPU over time to see if it’s increasing or decreasing. A rising ARPU indicates your strategies to improve customer value are working. So the higher the result, the better.
Conclusion
By understanding how much revenue each customer generates, you can optimize your strategies to acquire high-value customers, improve monetization, and ultimately drive sustainable growth.
So, keep track of your ARPU, analyze trends, and use it to inform your marketing, customer retention, and pricing strategies.
FAQ
Average revenue per user tells you how much money your business makes, on average, from each customer over a specific period (usually monthly).
ARPU isn’t a marketing metric, however, it helps marketing teams make decisions aimed at acquiring high-value customers and maximizing their lifetime value.
ARPU considers ALL your users (paying and non-paying), however, ARPPU focuses only on PAYING users and their average revenue contribution.
From data to report in one minute or less with Ajelix AI Agents


