
A break-even point calculator helps you determine the sales volume (units sold or revenue earned) needed to cover all your business costs (fixed and variable). In simpler terms, it tells you when your business will stop losing money and start making a profit.
Calculate Break Even Point
-
-
Break-even point formula
There are two main formulas for calculating the break-even point, depending on whether you want to understand:
- How many units do you need to sell to reach break-even?
- You know how many units you need to sell but want to understand the break-even price
Break-even point formula for units
BEP = Fixed Costs / (Sell price per unit – variable costs per unit)
This formula will calculate the number of units you need to sell to reach the break-even point.
Break-even point formula for price
BEP = (Fixed Costs + Variable Costs) / Number of units
By calculating this break-even point you can understand the break-even selling price for your units.
How To Calculate Break Even Point?
Watch our video with step by step guide to calculate BEP 👇
What are fixed costs?
Fixed costs are expenses that stay the same regardless of how much your business produces or sells. They’re like rent you pay for your building; you have to pay it every month whether you have a single customer or a hundred.
What Is variable costs?
Variable costs are expenses that change in proportion to your business’s production or sales volume. In other words, the more you produce or sell, the higher your variable costs will be, and vice versa. Imagine the cost of flour for a bakery – the more cookies they bake, the more flour they’ll need to buy.
How can break-even analysis help businesses?
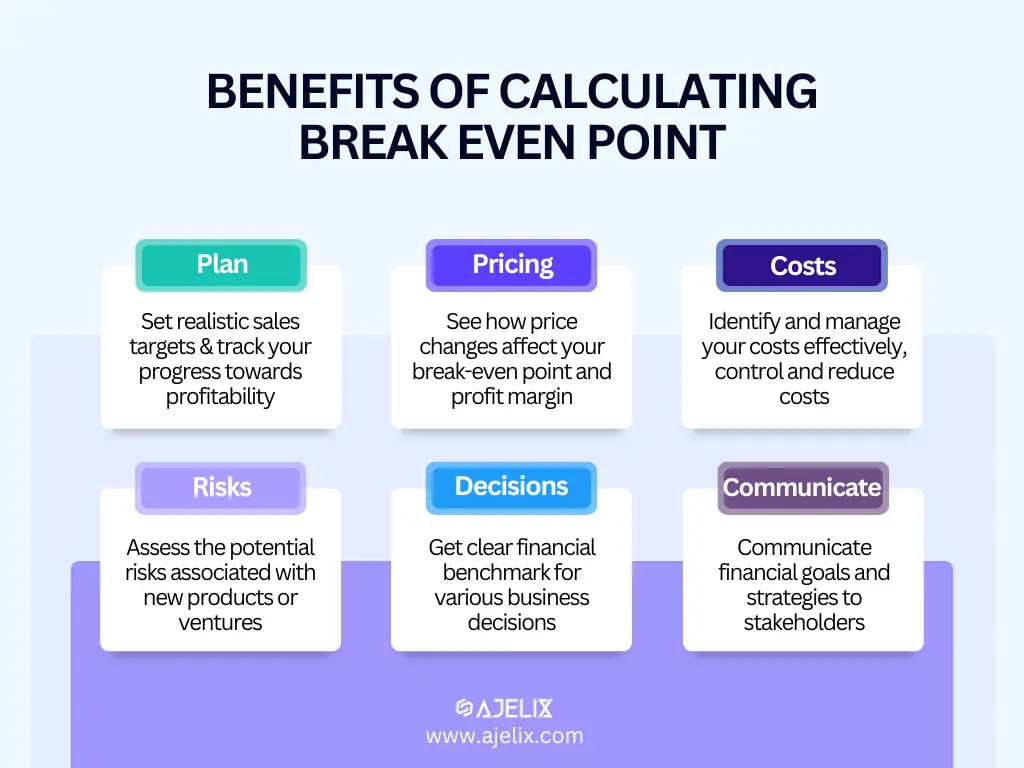
6 benefits of calculating break-even analysis, infographic by author
Break-even analysis, which helps you determine your break-even point, is a valuable tool for businesses for several reasons:
- Planning and Goal Setting: It helps you set realistic sales targets. By understanding how much you need to sell to cover your costs, you can set achievable sales goals and track your progress toward profitability.
- Pricing Strategy: Break-even analysis can inform your pricing decisions. You can see how price changes affect your break-even point and profit margin. This helps you find a price point that balances covering your costs while remaining competitive in the market.
- Cost Control: It encourages you to identify and manage your costs effectively. By analyzing your fixed and variable costs, you can find areas to reduce expenses and improve your overall efficiency.
- Risk Management: Break-even analysis helps you assess the potential risks associated with new products or ventures. You can estimate the sales volume needed to be profitable and make informed decisions about resource allocation.
- Decision Making: It provides a clear financial benchmark for various business decisions. Whether it’s launching a new marketing campaign, expanding your product line, or considering a change in production methods, break-even analysis can help you understand the financial implications.
- Communication: Break-even analysis can be a useful tool for communicating financial goals and strategies to stakeholders. It provides a clear and concise way to explain how sales volume translates into profitability.
FAQ
Why is it important to calculate the break-even point?This metric can help you understand how much you need to sell to turn a profit. This KPI can show you the minimum sales or price required to cover costs.
What happens if my sales are below the break-even point?If your sales are below the break-even point means your revenue isn’t enough to cover all your business expenses.
How can I improve my break-even point?You can reduce costs by lowering fixed costs (rent, salaries) or variable costs (materials, production). The other option is to increase sales price or sell more units to boost revenue per unit sold.
Other calculators


Setup and monitor your KPIs regularly using Ajelix BI


