- Home
- Data Visualization
- Tools
- AI Data Analyst
- Excel Formula Generator
- Excel Formula Explainer
- Google Apps Script Generator
- Excel VBA Script Explainer
- Excel VBA Script Generator
- Excel VBA Code Optimizer
- Excel VBA Code Debugger
- Google Sheets Formula Generator
- Google Apps Script Explainer
- Google Sheets Formula Explainer
- Google Apps Script Optimizer
- Google Apps Script Debugger
- Excel File Translator
- Excel Template Generator
- Excel Add-in
- Your Virtual AI Assistant For Excel Spreadsheets
- AI Answer Generator
- AI Math Solver
- AI Graph Generator
- AI SQL Generator
- Pricing
- Resources
- Home
- Blog
- Calculators
- Revenue Per Employee Calculator: Free & Online
Revenue Per Employee Calculator: Free & Online

Explore other articles
- Top 5 Julius AI Alternatives for Data Analysis in 2025
- No Code Analytics: Business Impact and Top Tools in 2025
- Top Automation Tools for Excel in 2025: Built-In and Third-Party Solutions
- 5 Healthcare Data Analytics Trends 2025
- Which is the Best Analytics Platform for Startup Data Needs in 2025
- 10 Must-Have AI Tools for Startups in 2025
- 7 Best AI Tools for Excel Data Analysis (2025 Comparison)
- Why is AI-driven Data Intelligence the Key to Success?
- The Essential Role of AI in Conversational Analytics
- Which AI Model Will Survive Our Test: Claude vs Perplexity?
Set up dashboard & track KPIs
Revenue per employee calculator is a metric that measures how much revenue each employee generates for a company. It’s a way to assess how efficient your workforce is at bringing in money.
Revenue per employee calculator helps businesses understand if they’re getting a good return on their investment in employees.
Calculate Revenue Per Employee
Revenue per Employee Formula
RPE = Revenue / Current Number of Employees
Here’s a breakdown of each part:
- Revenue: The total income by the company during a specific period, typically a year. You can find this number on the company’s income statement or annual report.
- Current Number of Employees: The total number of people employed at a specific period. This data might come from HR records or payroll figures. We have gathered more than 10+ HR KPIs you can track.
How To calculate revenue per employee?
Time needed: 2 minutes
Step-by-step guide on how to calculate revenue per employee.
- Gather the Required Information
Total Revenue: You’ll need the company’s total revenue for a specific period. This is usually found in the income statement or annual report, often denoted as “Sales” or “Net Sales.”
Number of Employees: Look for the total number of employees currently working for the company. HR records or payroll data are good sources for this information. - Perform the Calculation
Once you have both figures, apply the following formula in Excel or other application: RPE = Total Revenue / Current Number of Employees
- Interpret the Result
The resulting number represents the average revenue generated per employee during the chosen period.
Watch a video on how to use revenue per employee calculator to get this metric 👇
Example:
Let’s say a company has a total revenue of $1,000,000 and 100 employees.
- RPE = $1,000,000 / 100 employees = $10,000
In this example, the company’s RPE is $10,000. This signifies that, on average, each employee generates $10,000 in revenue.
Keep in Mind:
- A higher RPE generally indicates a more productive and profitable workforce.
- However, it’s important to consider factors like industry benchmarks and the type of business before interpreting the RPE.
- For instance, an RPE of $10,000 might be excellent for a consulting firm, but lower for a manufacturing company.
What are the benefits of calculating RPE?
Businesses can reap several benefits by calculating revenue per employee (RPE). Here’s how:
- Gauge Workforce Efficiency: RPE provides a snapshot of how effectively your employees generate revenue. A rising RPE over time suggests increasing productivity, possibly due to improved processes, training, or a stronger sales team.
- Identify Areas for Improvement: A low RPE might indicate inefficiencies or underperformance in certain departments. Analyzing RPE across departments can help pinpoint areas needing improvement, like streamlining workflows or providing targeted training.
- Make Strategic Staffing Decisions: RPE helps assess staffing needs. If revenue isn’t keeping pace with employee growth, RPE might suggest the need for a hiring freeze or explore ways to optimize existing staff roles.
- Benchmarking Against Competitors: Although RPE can’t be directly compared across industries, businesses within similar sectors can use it for benchmarking. This allows them to see how their employee productivity stacks up against competitors.
- Evaluate Resource Allocation: A high RPE might indicate the company is getting a good return on its investment in employees. This can justify allocating additional resources, like training or better equipment, to further enhance employee productivity.
- Identify Pricing Strategies: RPE can help determine if price increases are feasible. If your RPE is high, it suggests your employees are already generating significant revenue, potentially allowing for price adjustments without impacting sales volume too much.
Other calculators
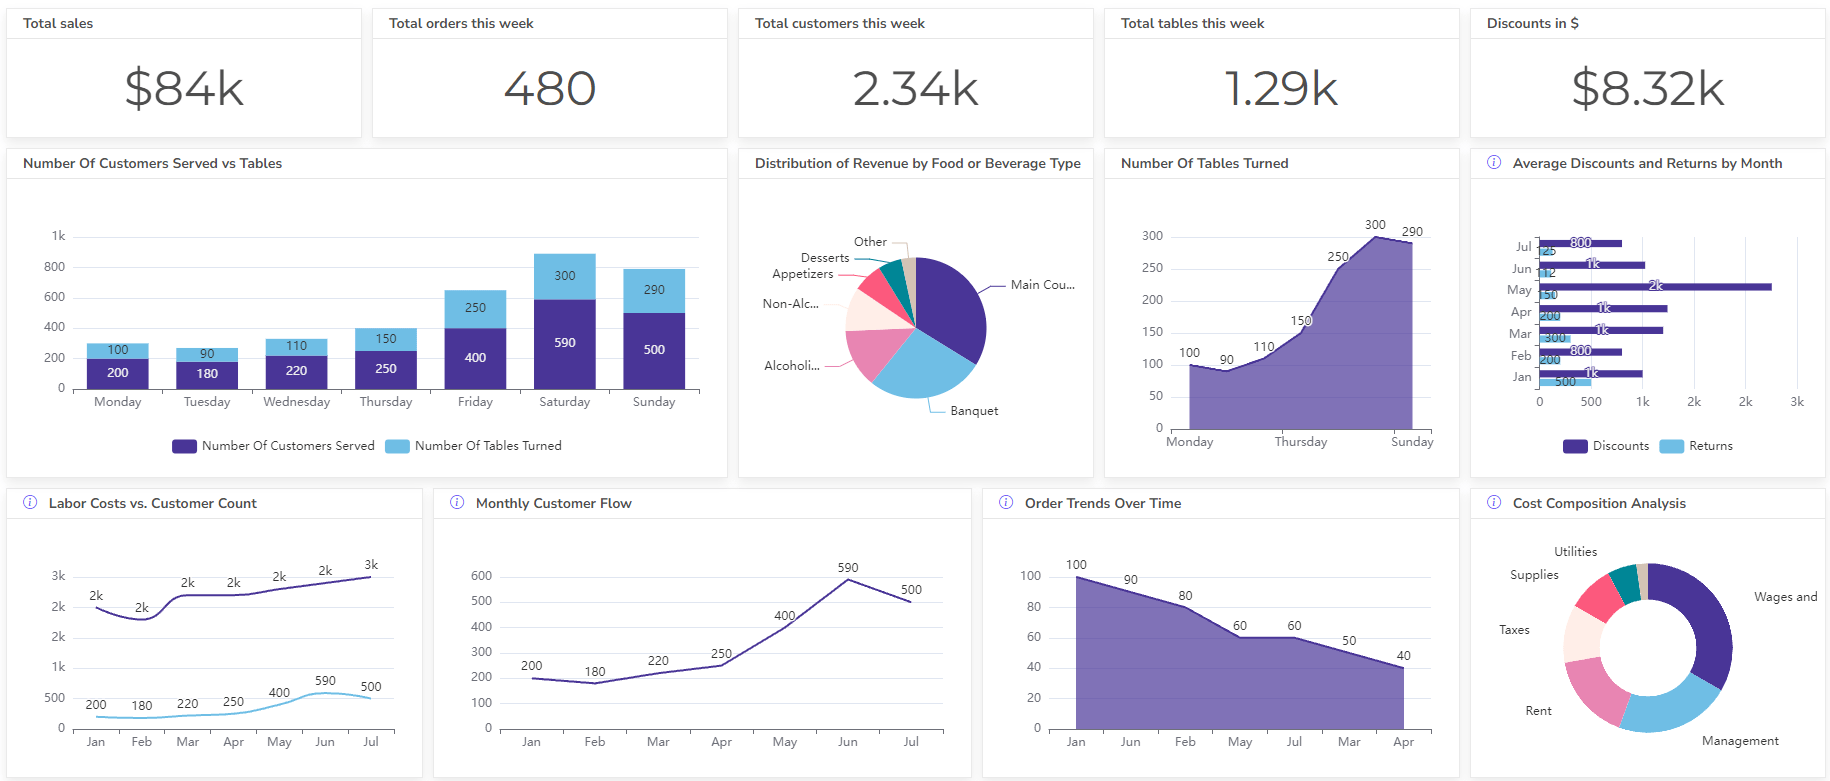
Setup and monitor your KPIs regularly using Ajelix BI


