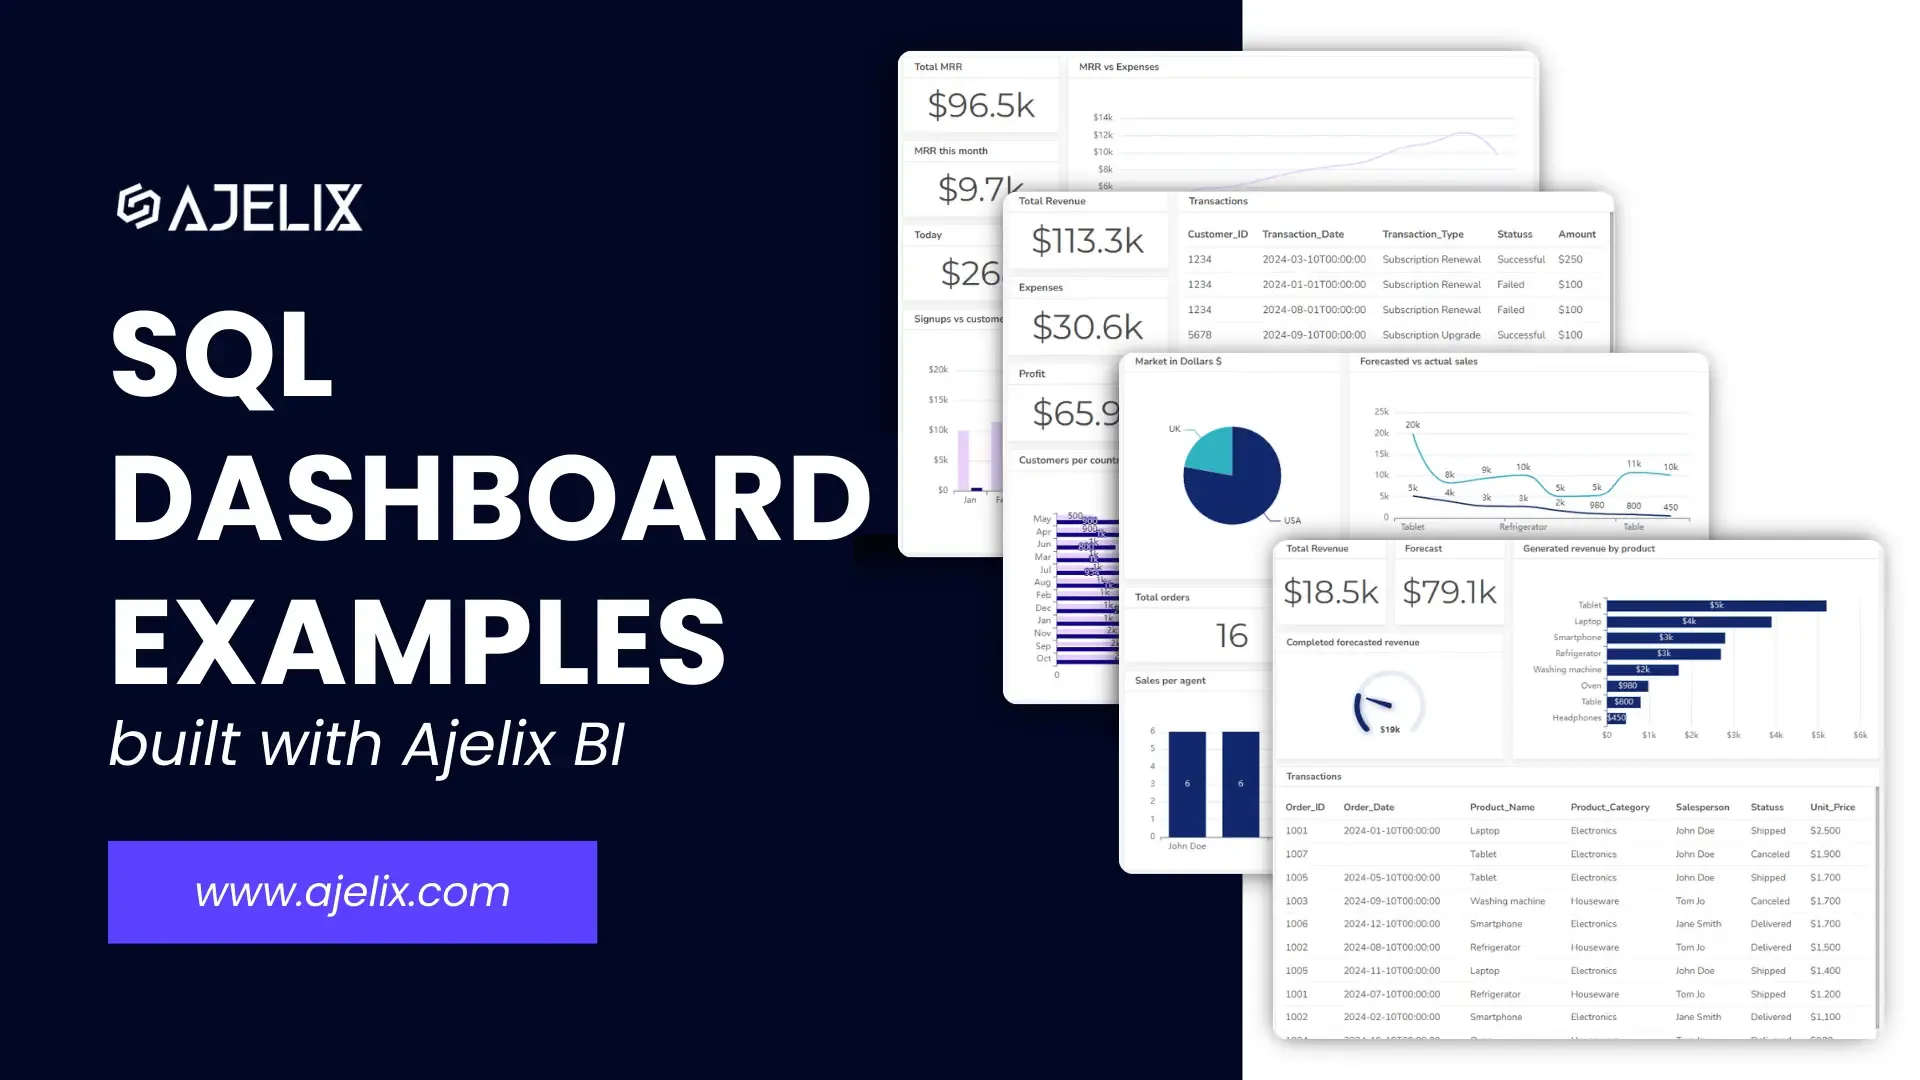
SQL Dashboard Examples: Create A Real-Time Dashboard
SQL dashboards give executives and business founders a powerful tool to monitor key metrics and identify trends to make informed strategic choices.
Using SQL queries allows these dashboards to deliver real-time insights into your organization’s performance, letting you stay ahead of the competition and drive sustainable growth.
This article will explore the benefits of SQL dashboards, provide practical examples, and demonstrate how to connect SQL, MySQL, and PostgreSQL databases to dashboards using Ajelix BI.
Change the way you work with agentic AI
One-click dashboards,KPI tracking, and AI-powered insights—for work that actually gets done.

What is an SQL dashboard?
An SQL dashboard visually represents data extracted from a database using Structured Query Language (SQL). It provides a centralized, interactive interface for users to explore, analyze, and understand key metrics and trends within their data.
Key features and benefits of SQL dashboards
- Data visualization: present data in various formats, such as charts, graphs, and tables to comprehend complex information.
- Real-time updates: refresh data automatically to ensure users can access the latest insights.
- Customization: tailor dashboards to meet specific needs and preferences.
- Collaboration: share reports with colleagues.
Common use cases for SQL dashboards
- Business intelligence: analyzes sales performance, customer behavior, and operational efficiency. Discover the best business intelligence tools in our article.
- Financial reporting: track revenue, expenses, and profitability. See more than 20 financial KPIs here.
- Marketing analytics: measure campaign effectiveness and customer acquisition costs. See CMO dashboard examples and build it yourself.
- Human resources: monitor employee turnover, productivity, and satisfaction. Here’s a list of the top 15 HR KPIs.
- Operations management: Optimize supply chain, inventory, and production processes. You can create an operational dashboard by following this guide or view more than 10 operations KPIs.
MySQL Dashboard
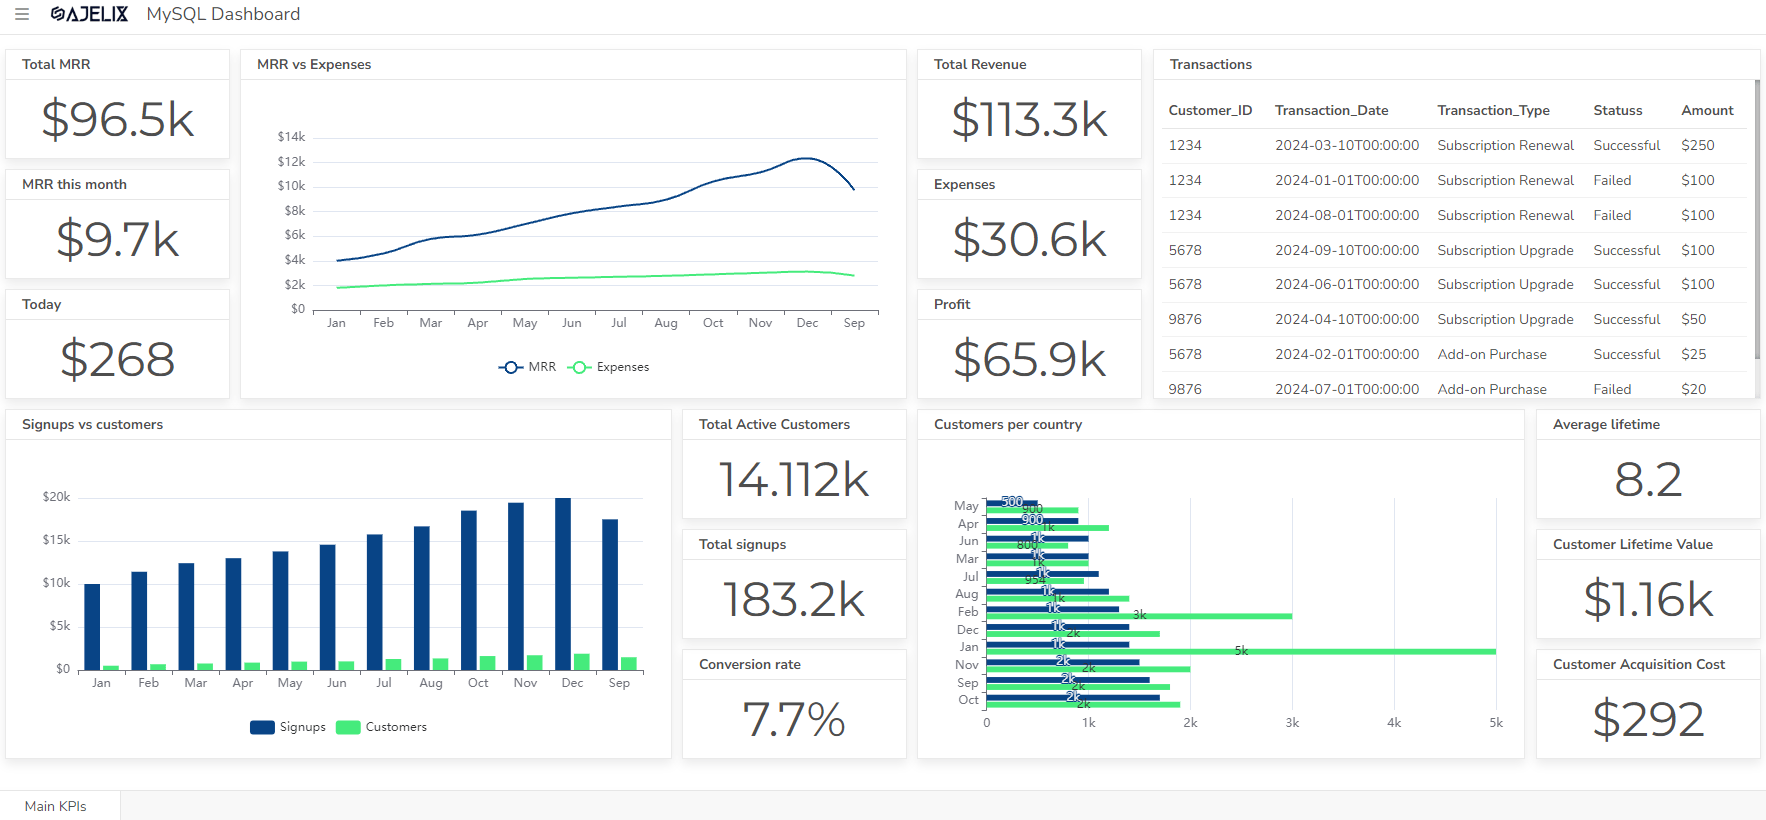
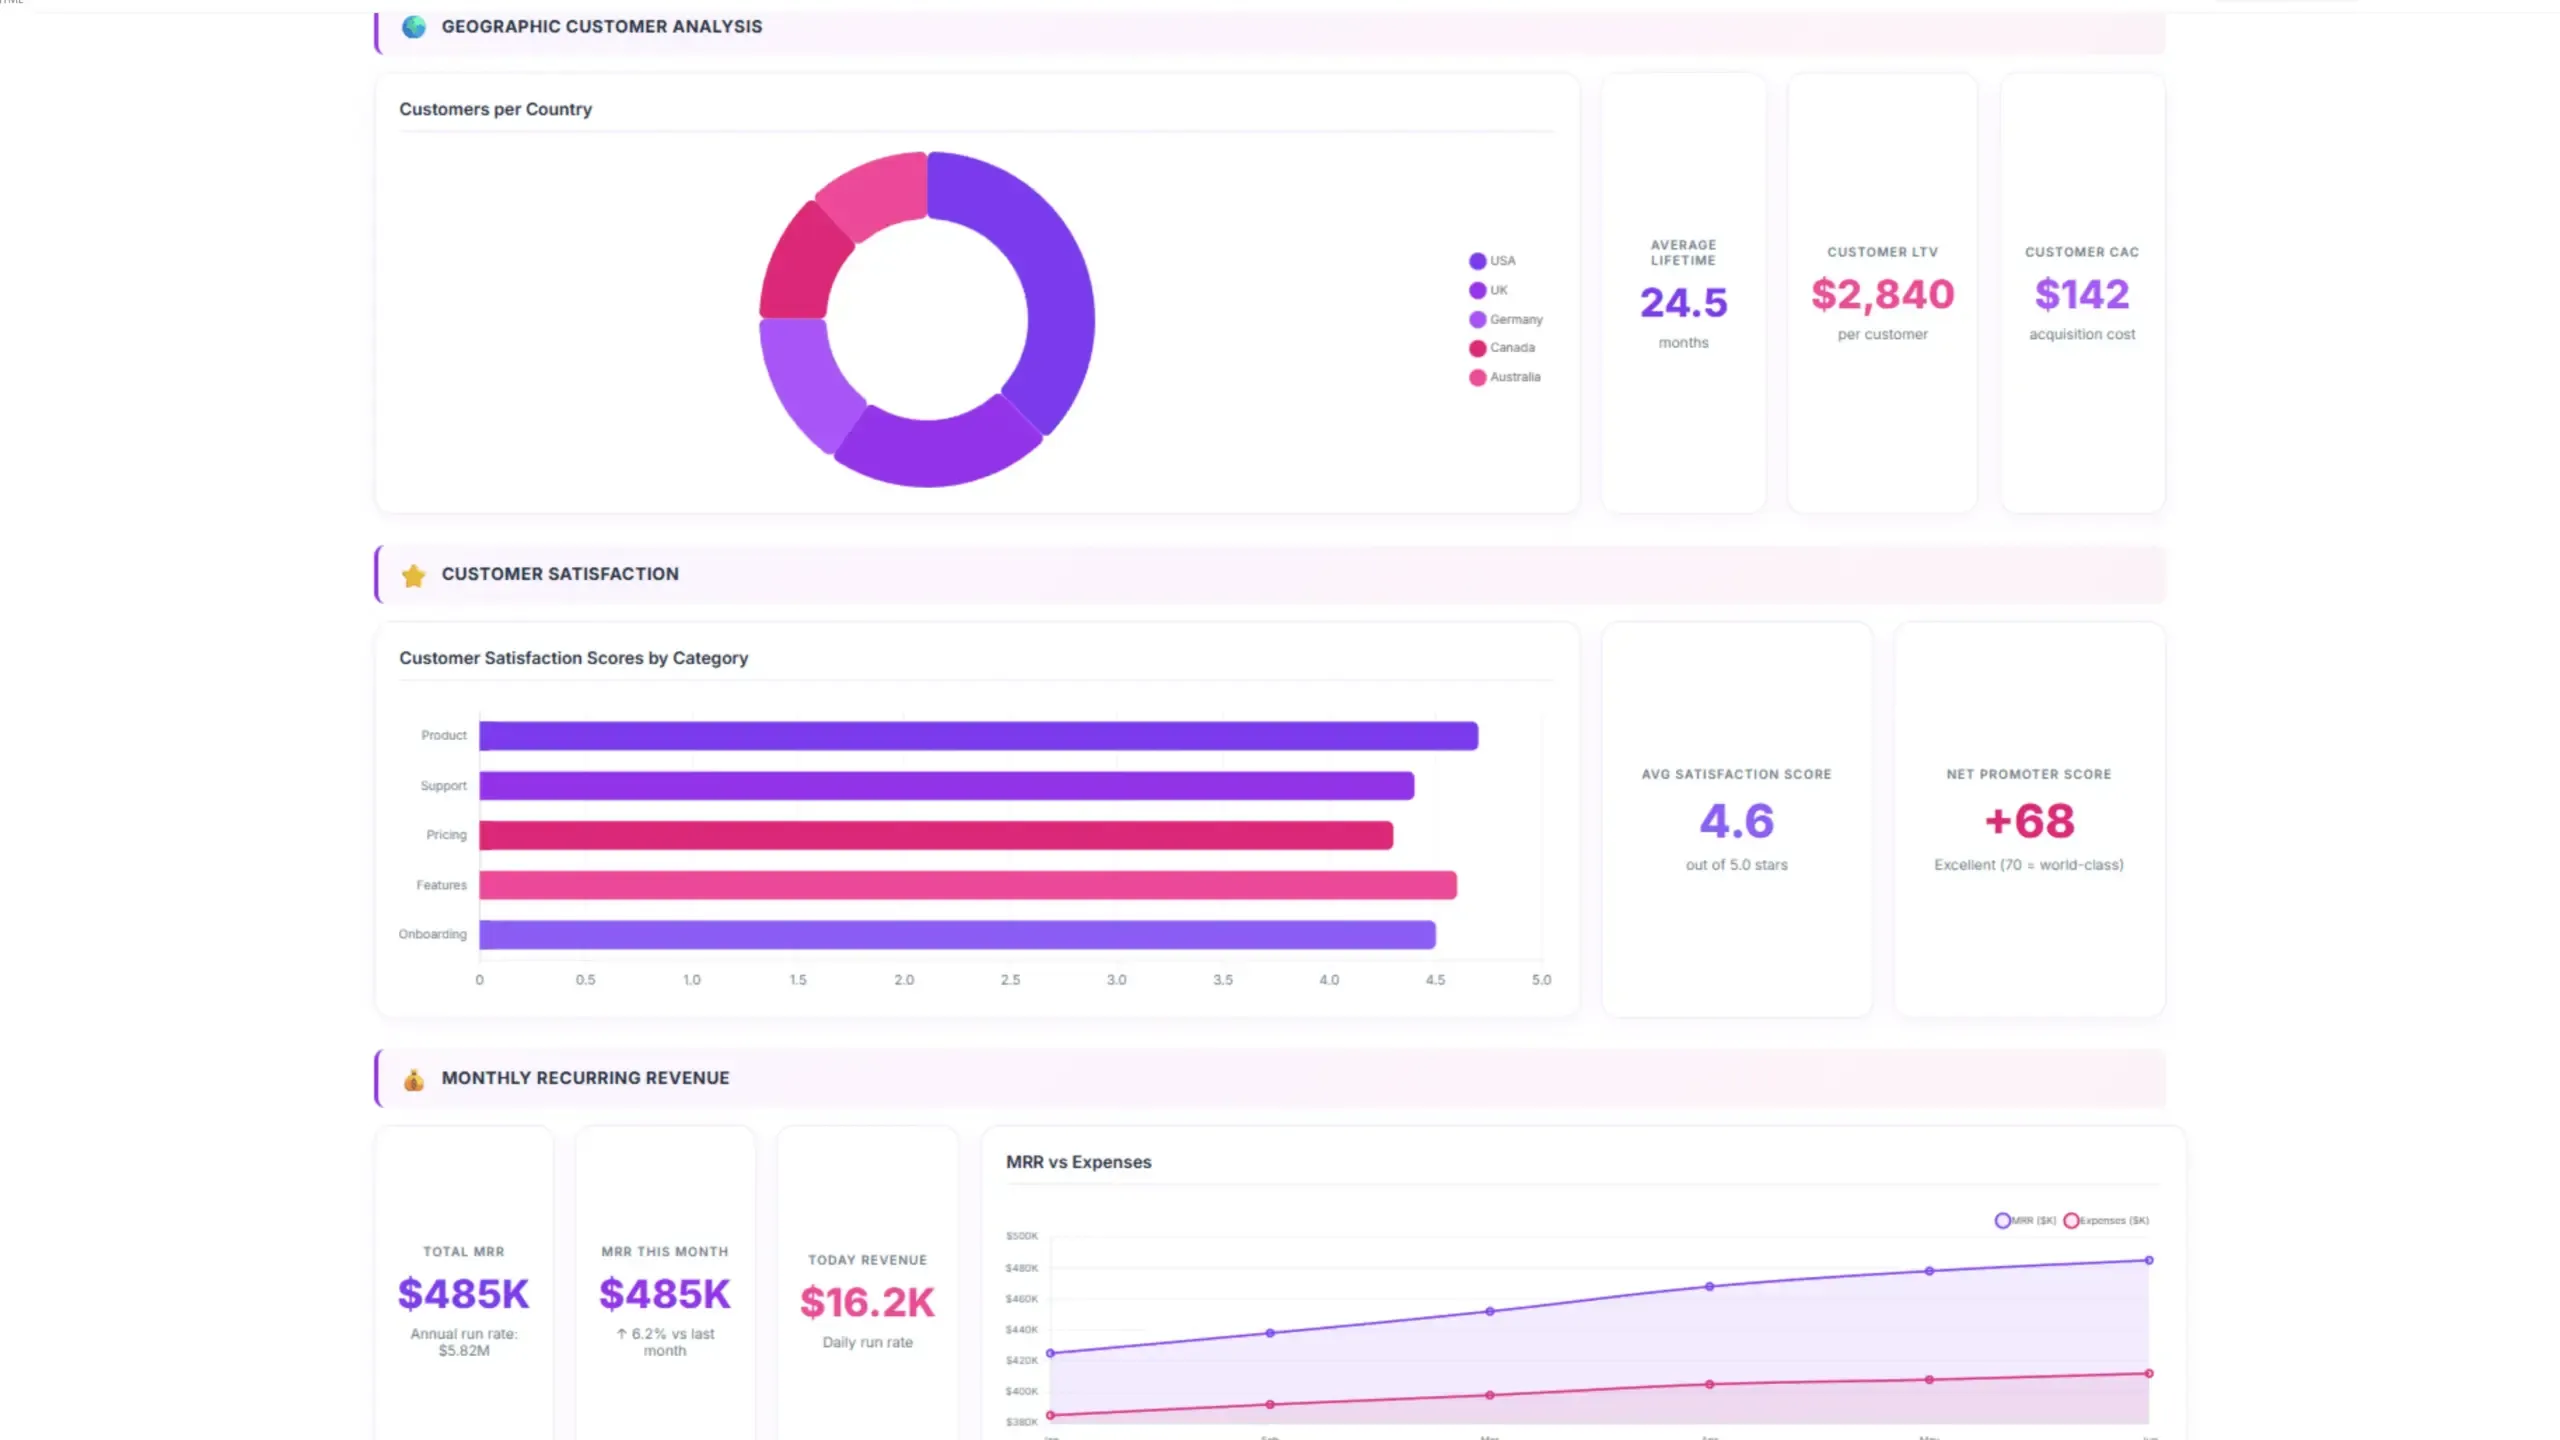
A real-time MySQL dashboard provides a dynamic and interactive view of your database data, allowing you to monitor key metrics, follow cash flow, and identify anomalies.
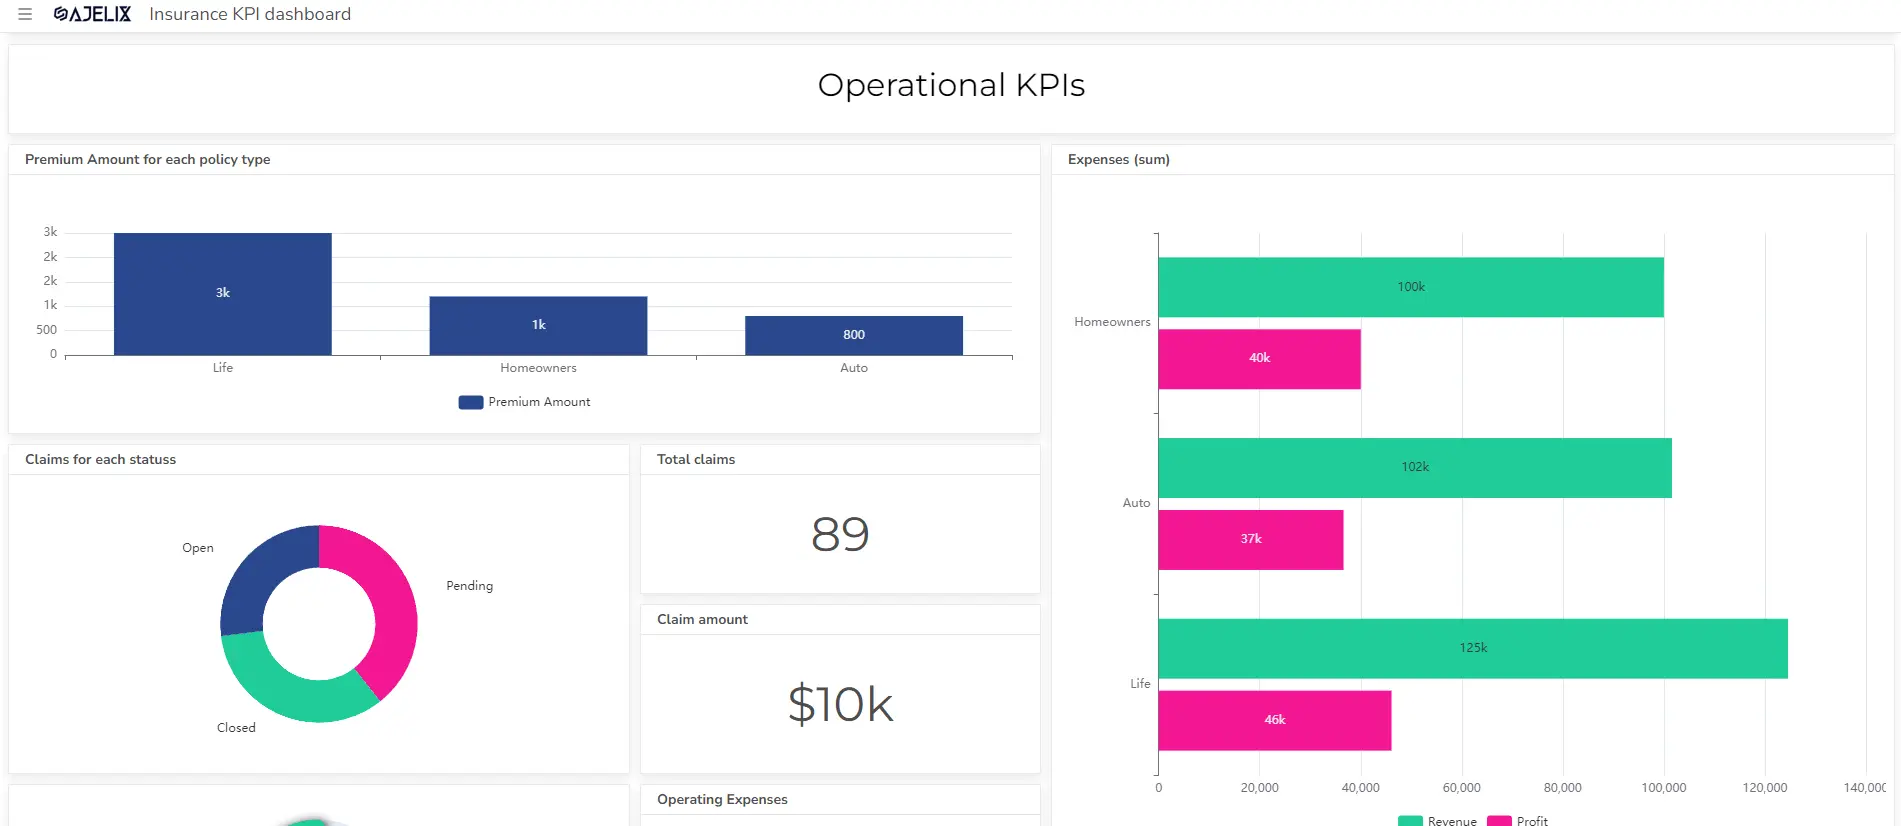
In the dashboard example, you can see key metrics for SaaS business. Some of the metrics are:
- Total, monthly, and daily MRR.
- Financial metrics such as revenue, expenses, profit
- All transactions with status information and amounts
- Registered users vs subscribers and conversion rates
- Customer lifetime value and acquisition cost
This dashboard shows live, up-to-date information. If you use MySQL Server, you can easily connect it to your dashboard and watch your company’s data change in real-time.
How to connect MySQL?
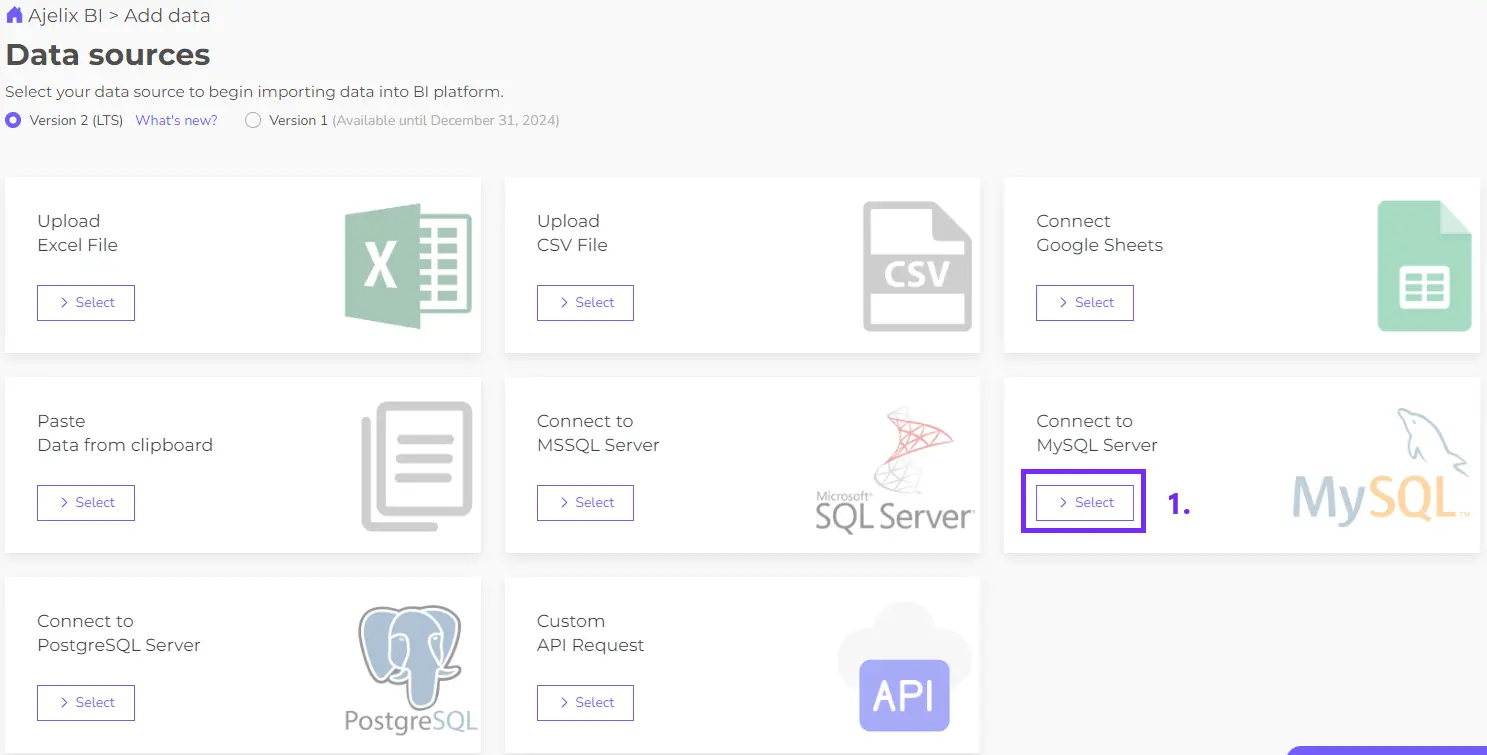
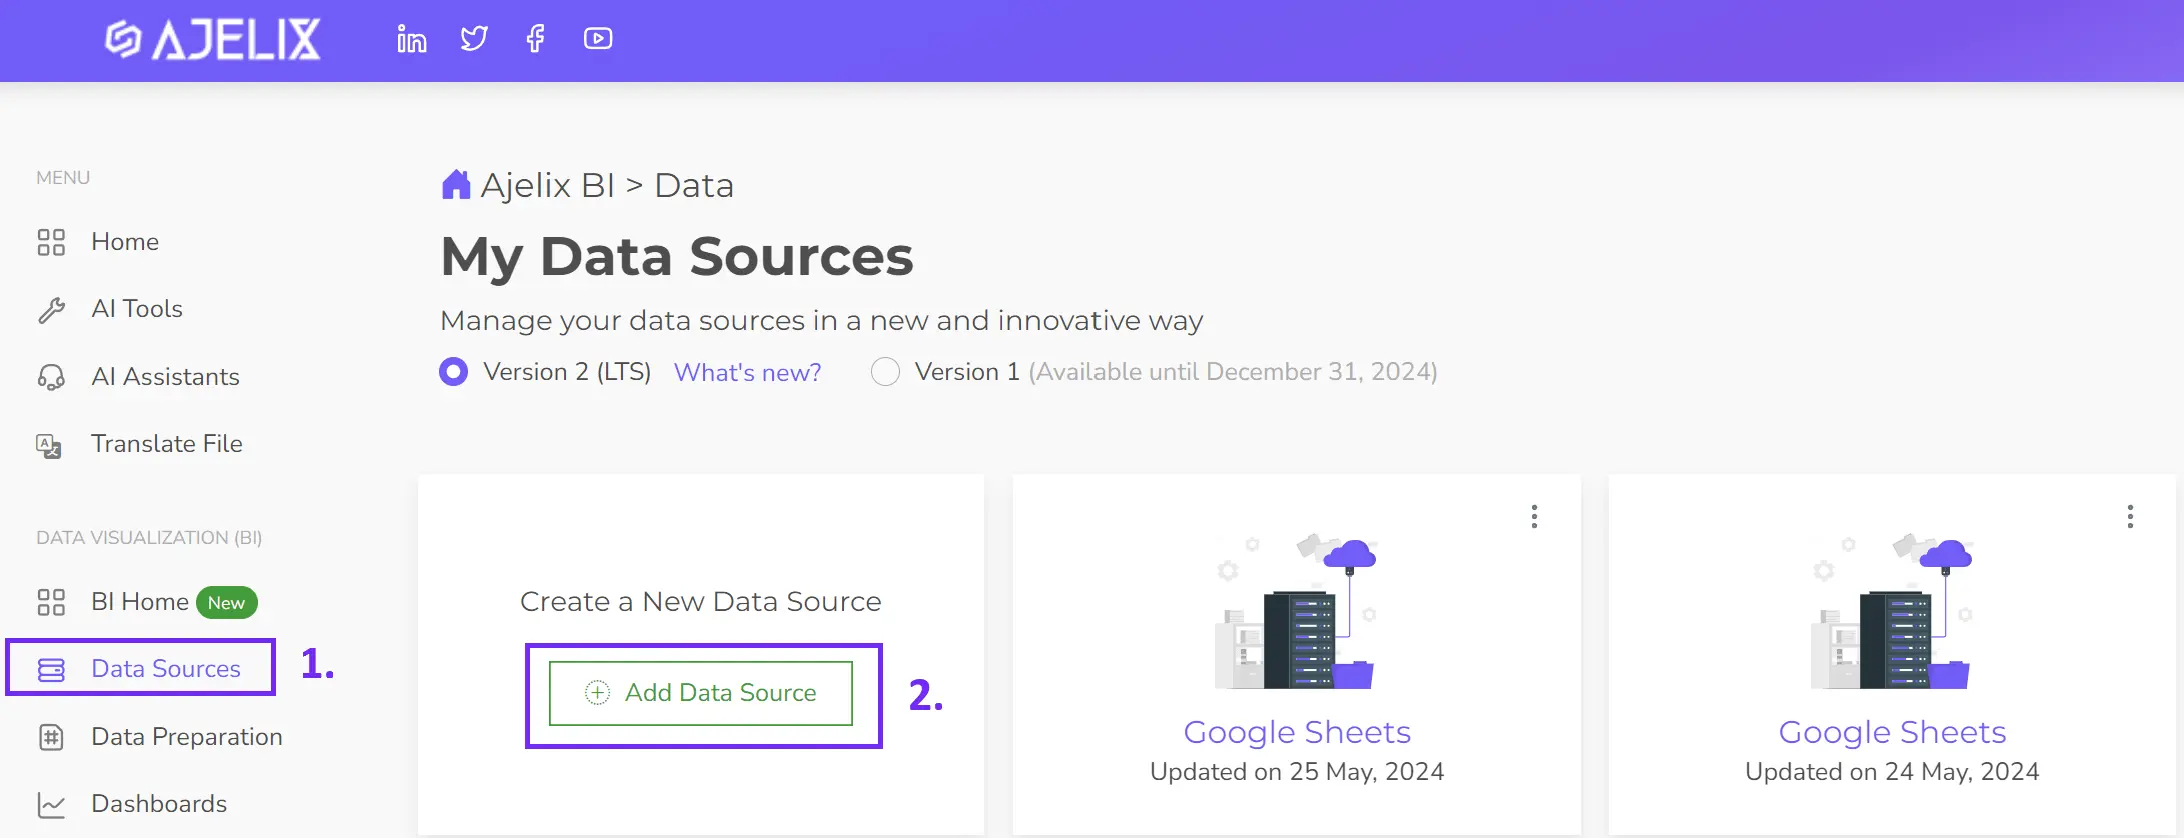
1. The first step to add a data source in Ajelix BI is to navigate to the Data Sources section and click Add data source.
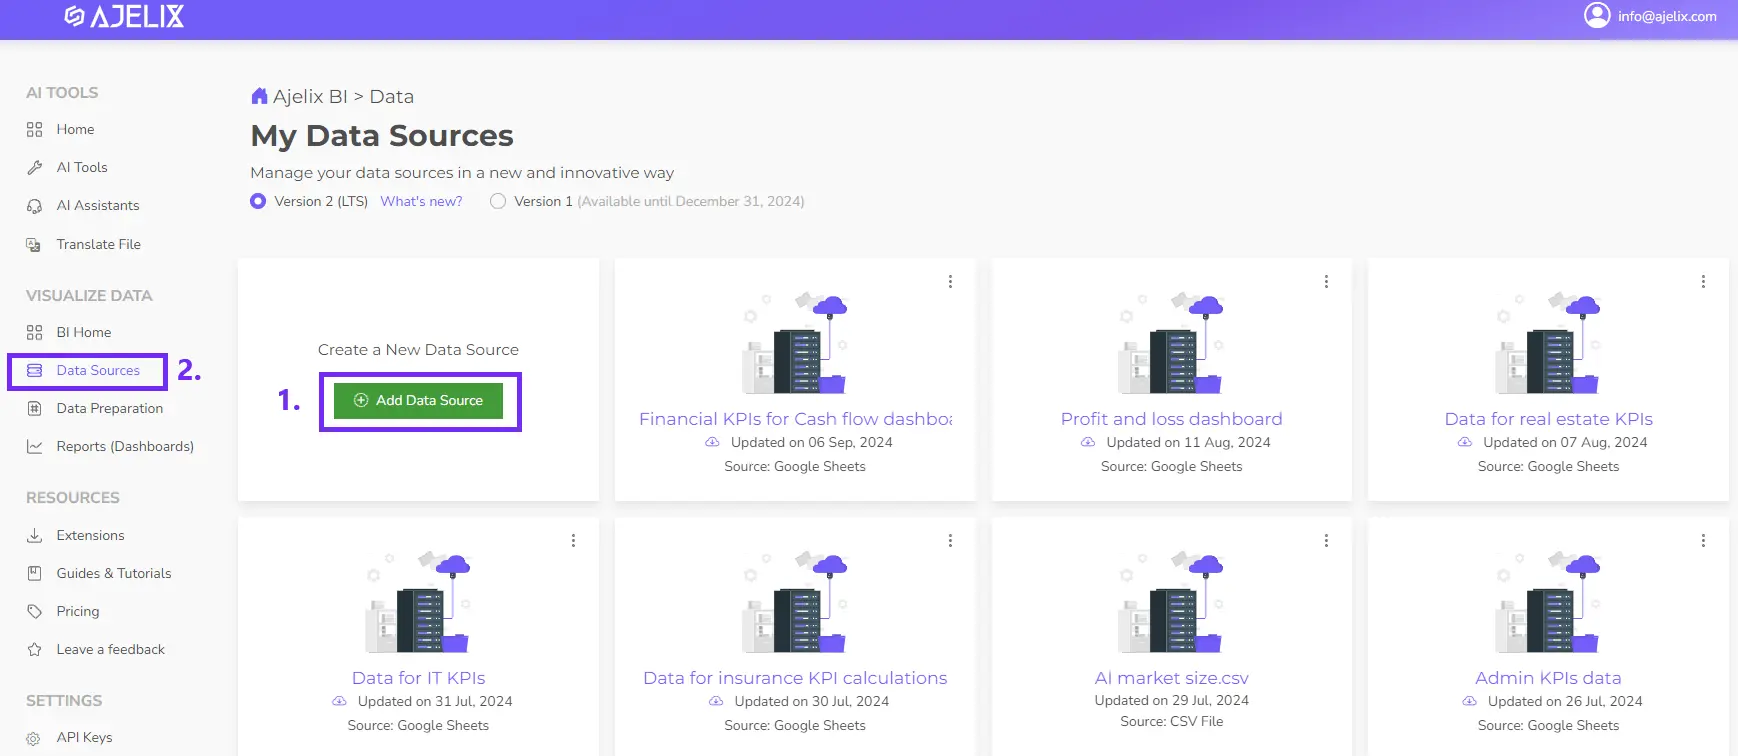
2. Select MySQL: Choose MySQL as the data source type.
3. Configure Settings: Fill in the necessary details:
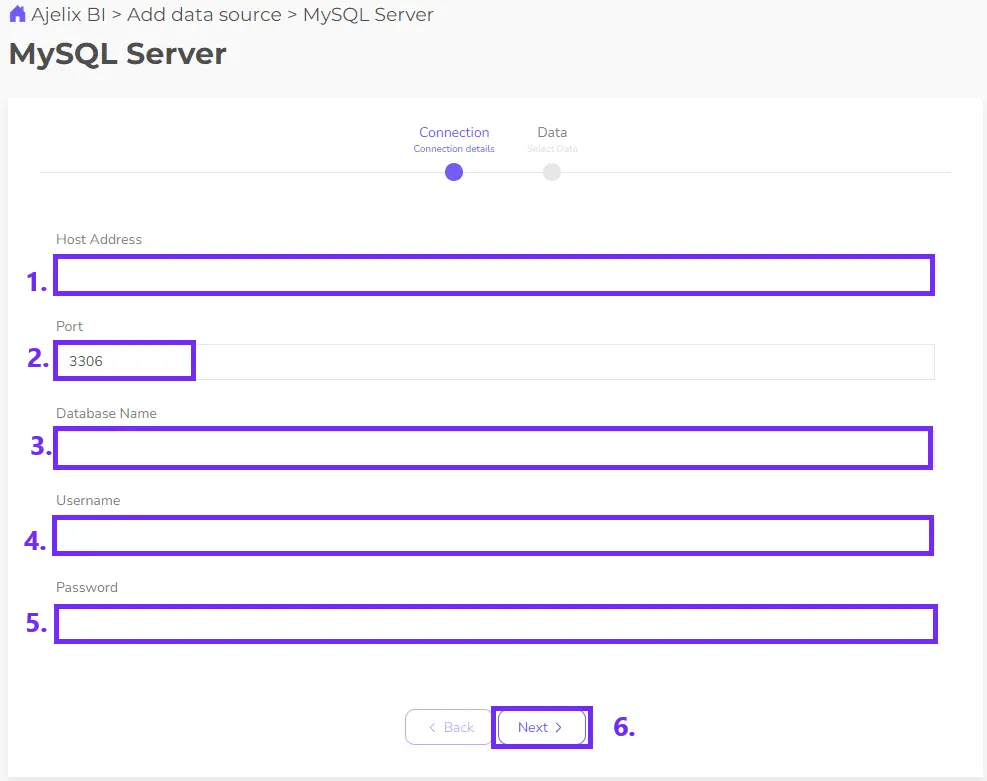
- Host Address: Add the URL of your MySQL server (e.g., jdbc:mysql://localhost:3306/your_database).
- Port: the default port is already set but make sure that your server has the same port
- Database Name: The name of your MySQL database.
- Username: Your MySQL username.
- Password: Your MySQL password.
- Click Next
If the connection is successful, you will be forwarded to the next step where you can select the tables and write SQL queries.
Postgre SQL Dashboard
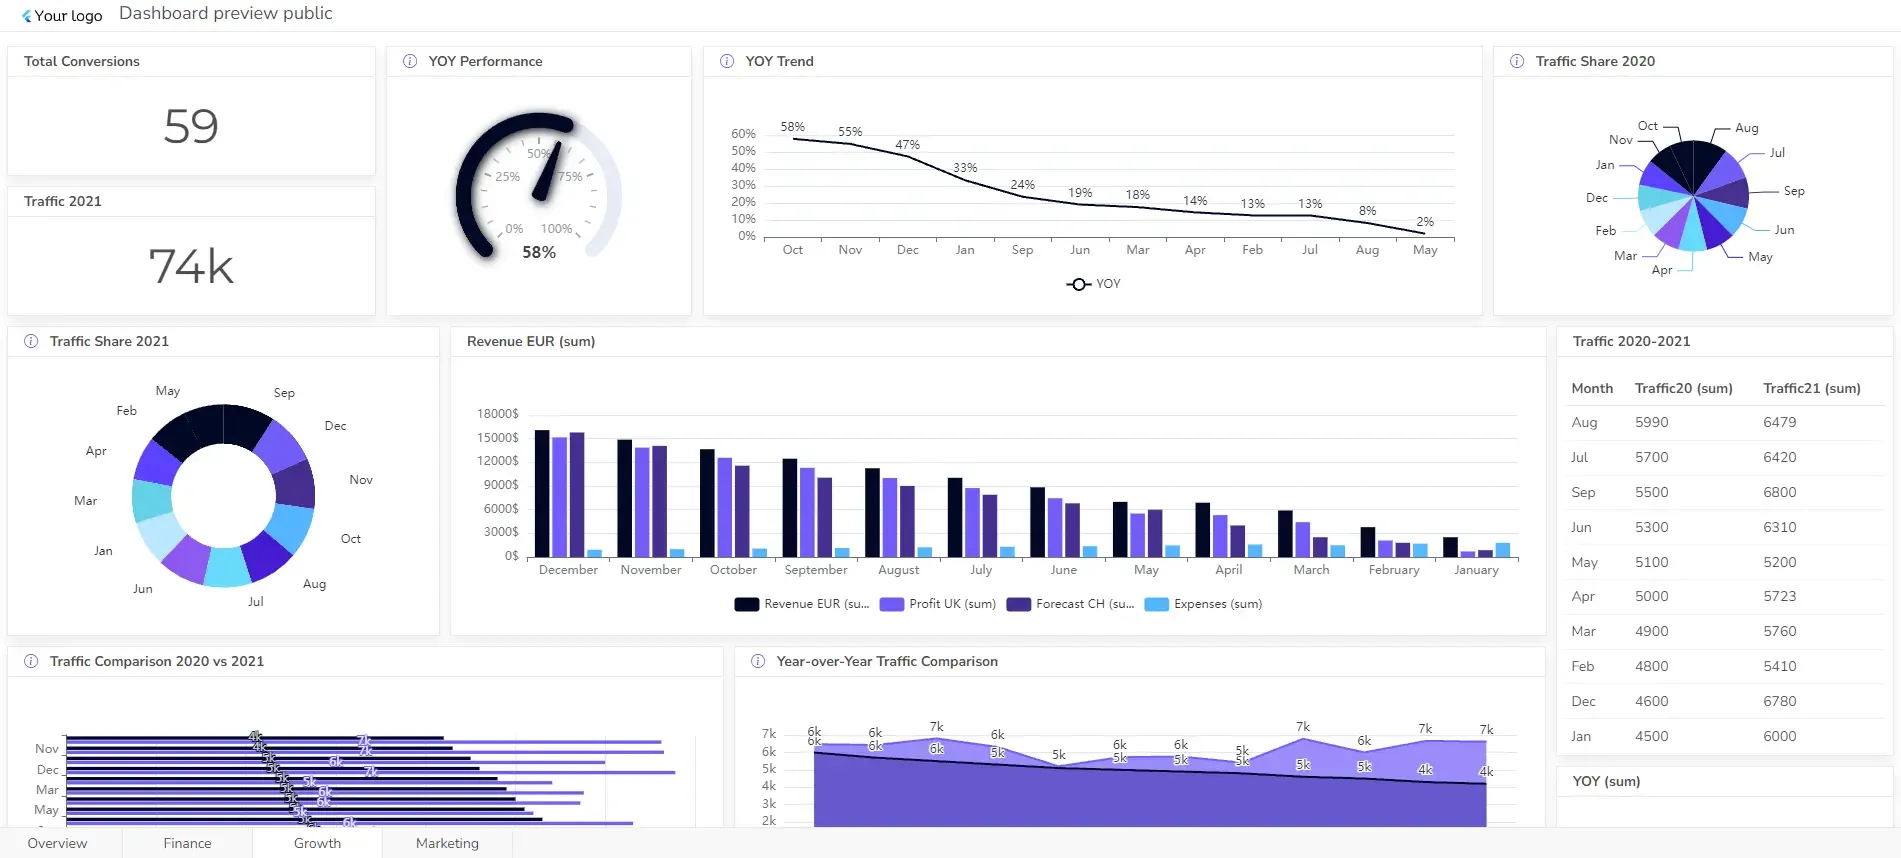
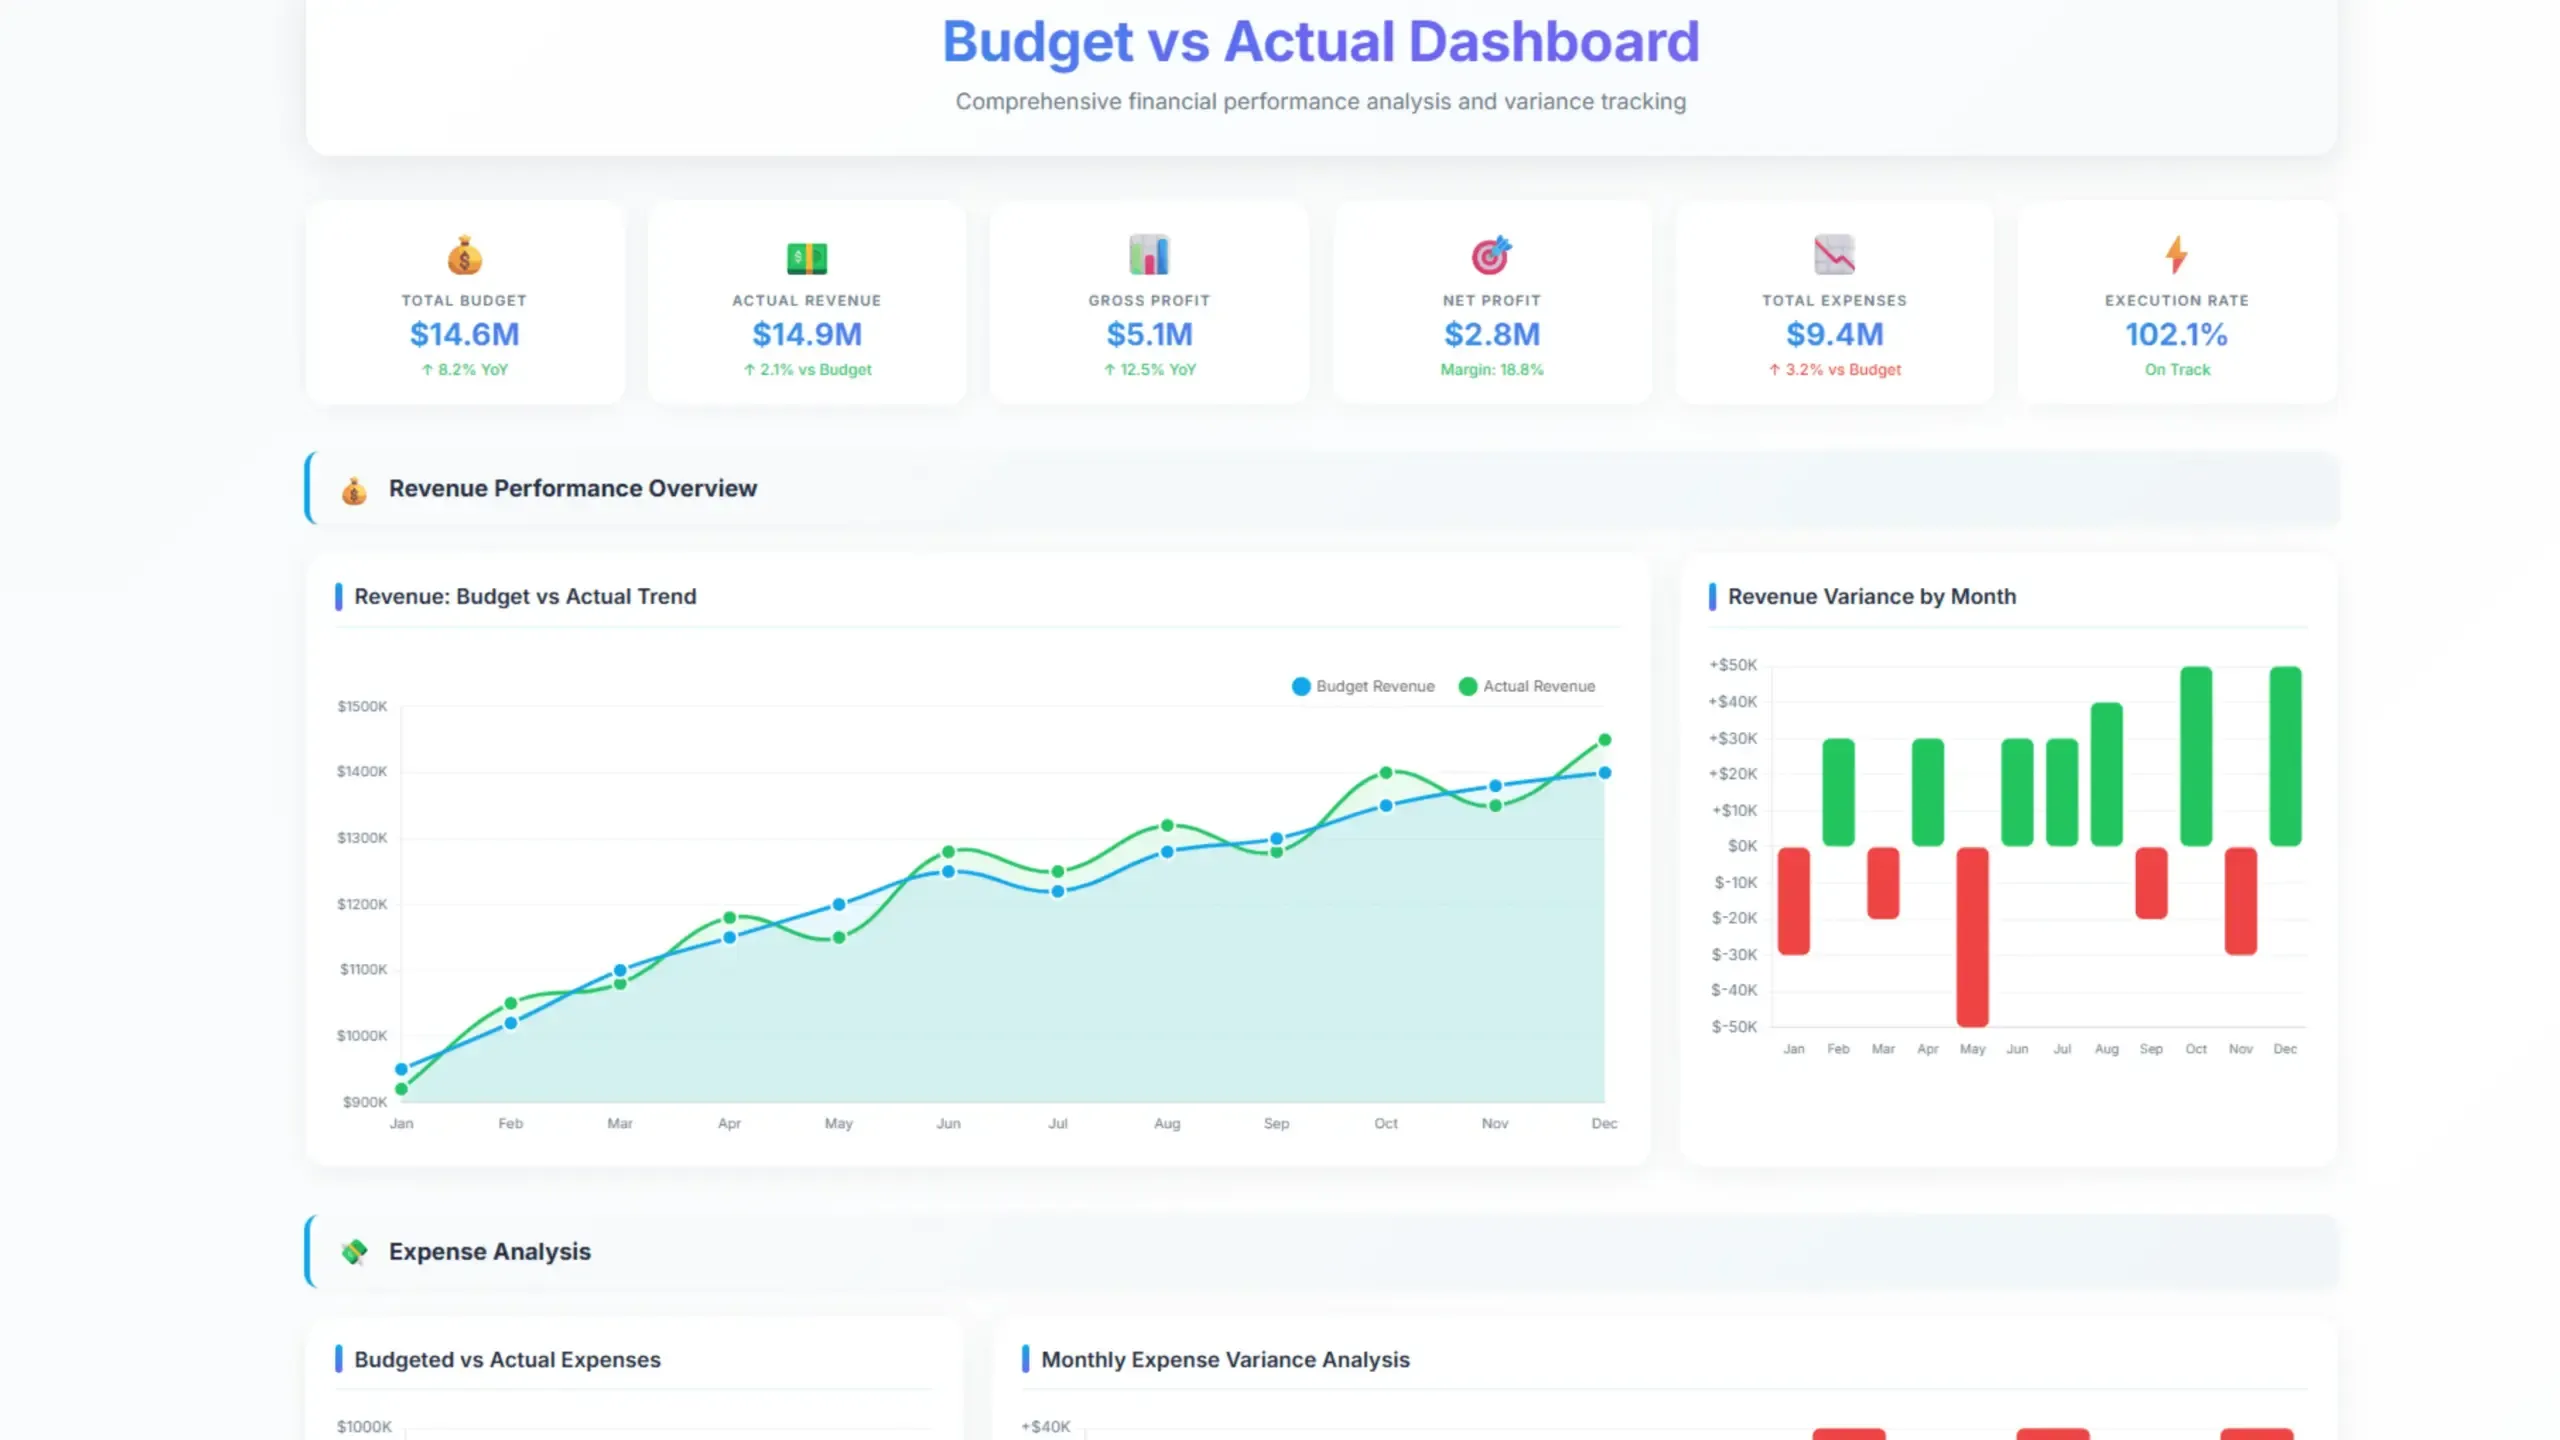
You can create dynamic dashboards for your small business using a PostgreSQL connection to calculate and visualize key metrics.
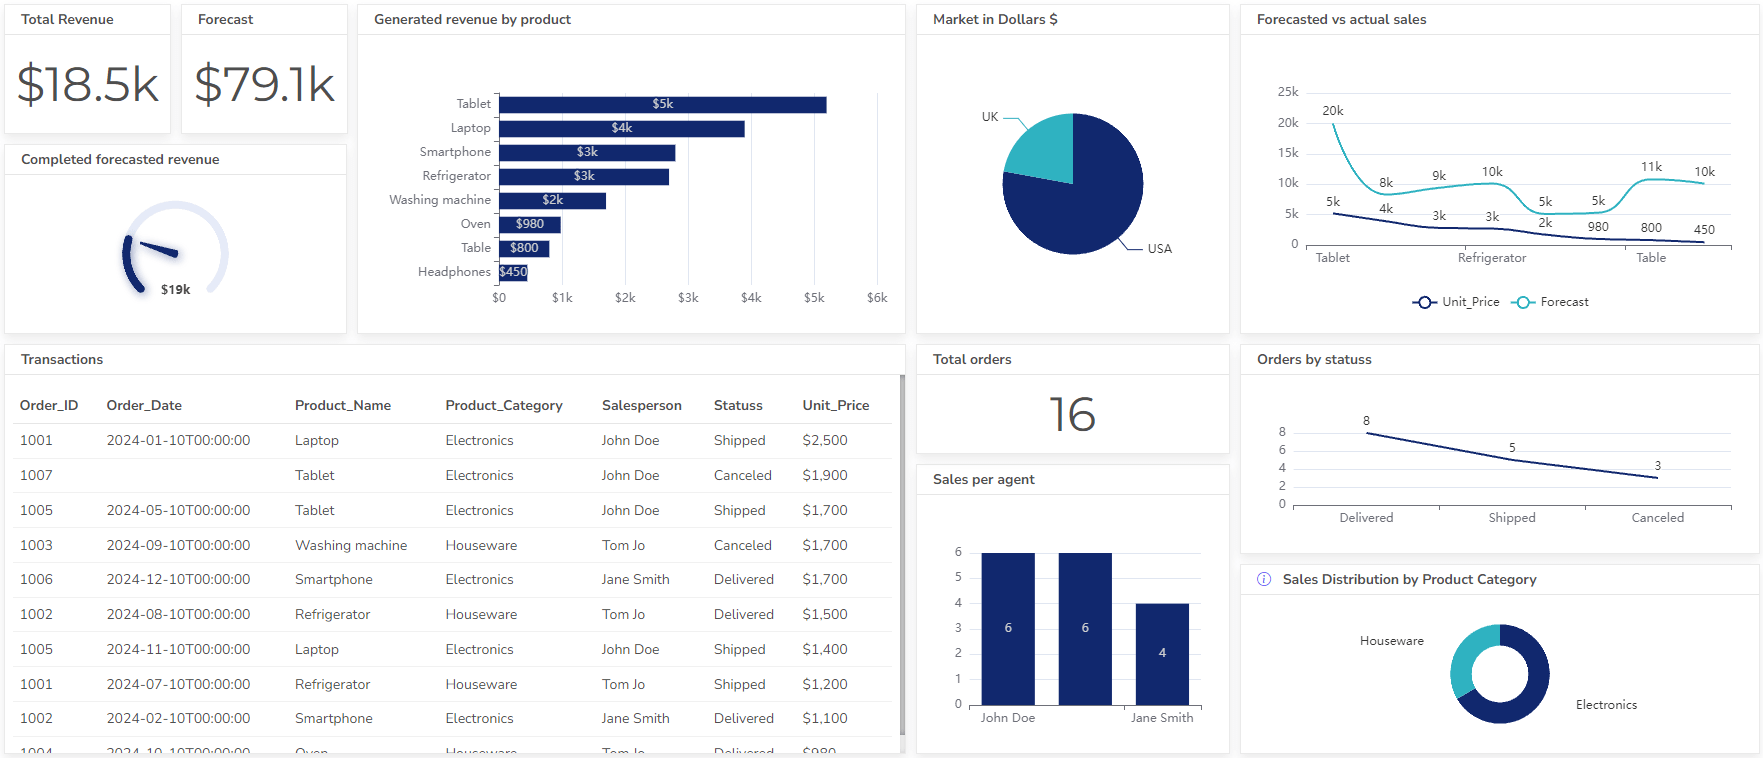
In the example, you can see a sales dashboard that uses live connection from PostgreSQL to visualize total revenue, sales by region, customer segmentation, and product performance. Here are the metrics used in this dashboard:
- Total revenue vs forecasted
- Product category performance by sales
- Market distribution
- Transactions with status
- Performance of each sales agent
- Status for each order
Microsoft SQL Dashboard
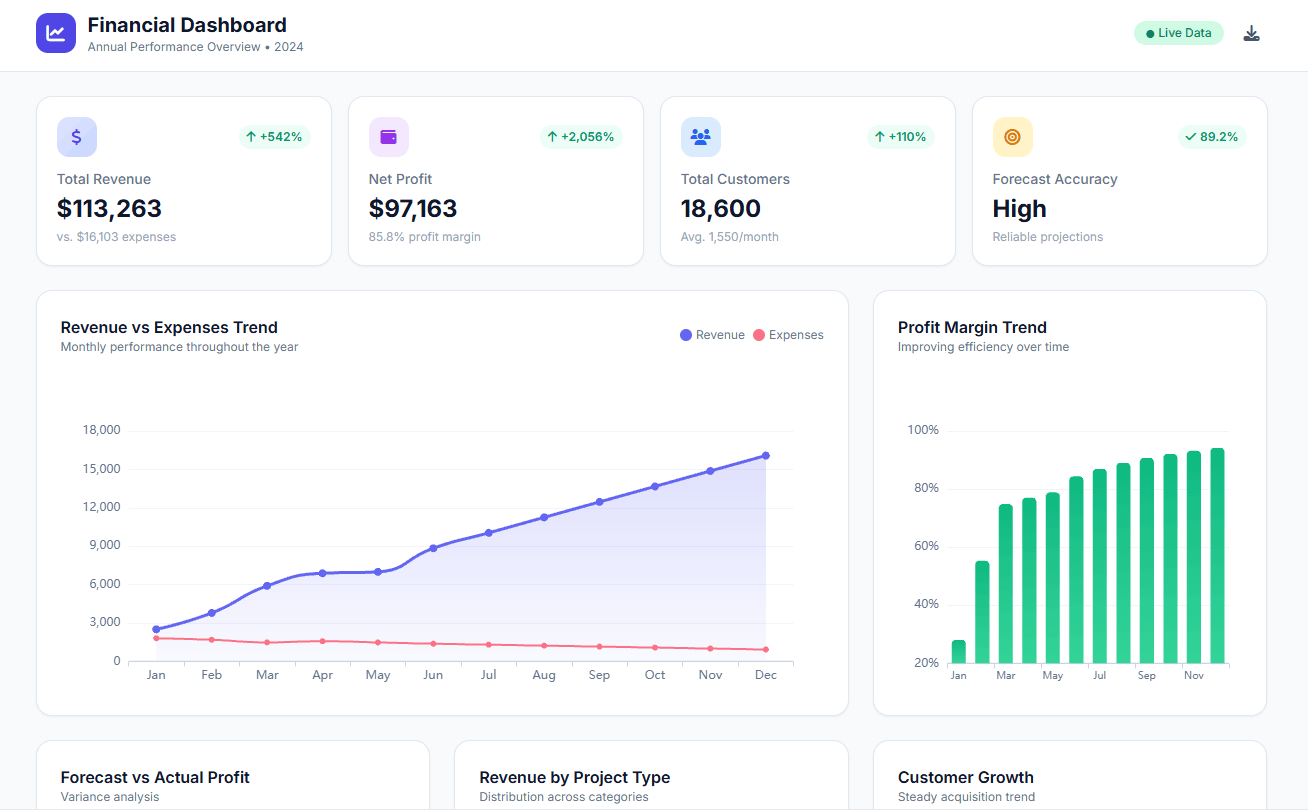
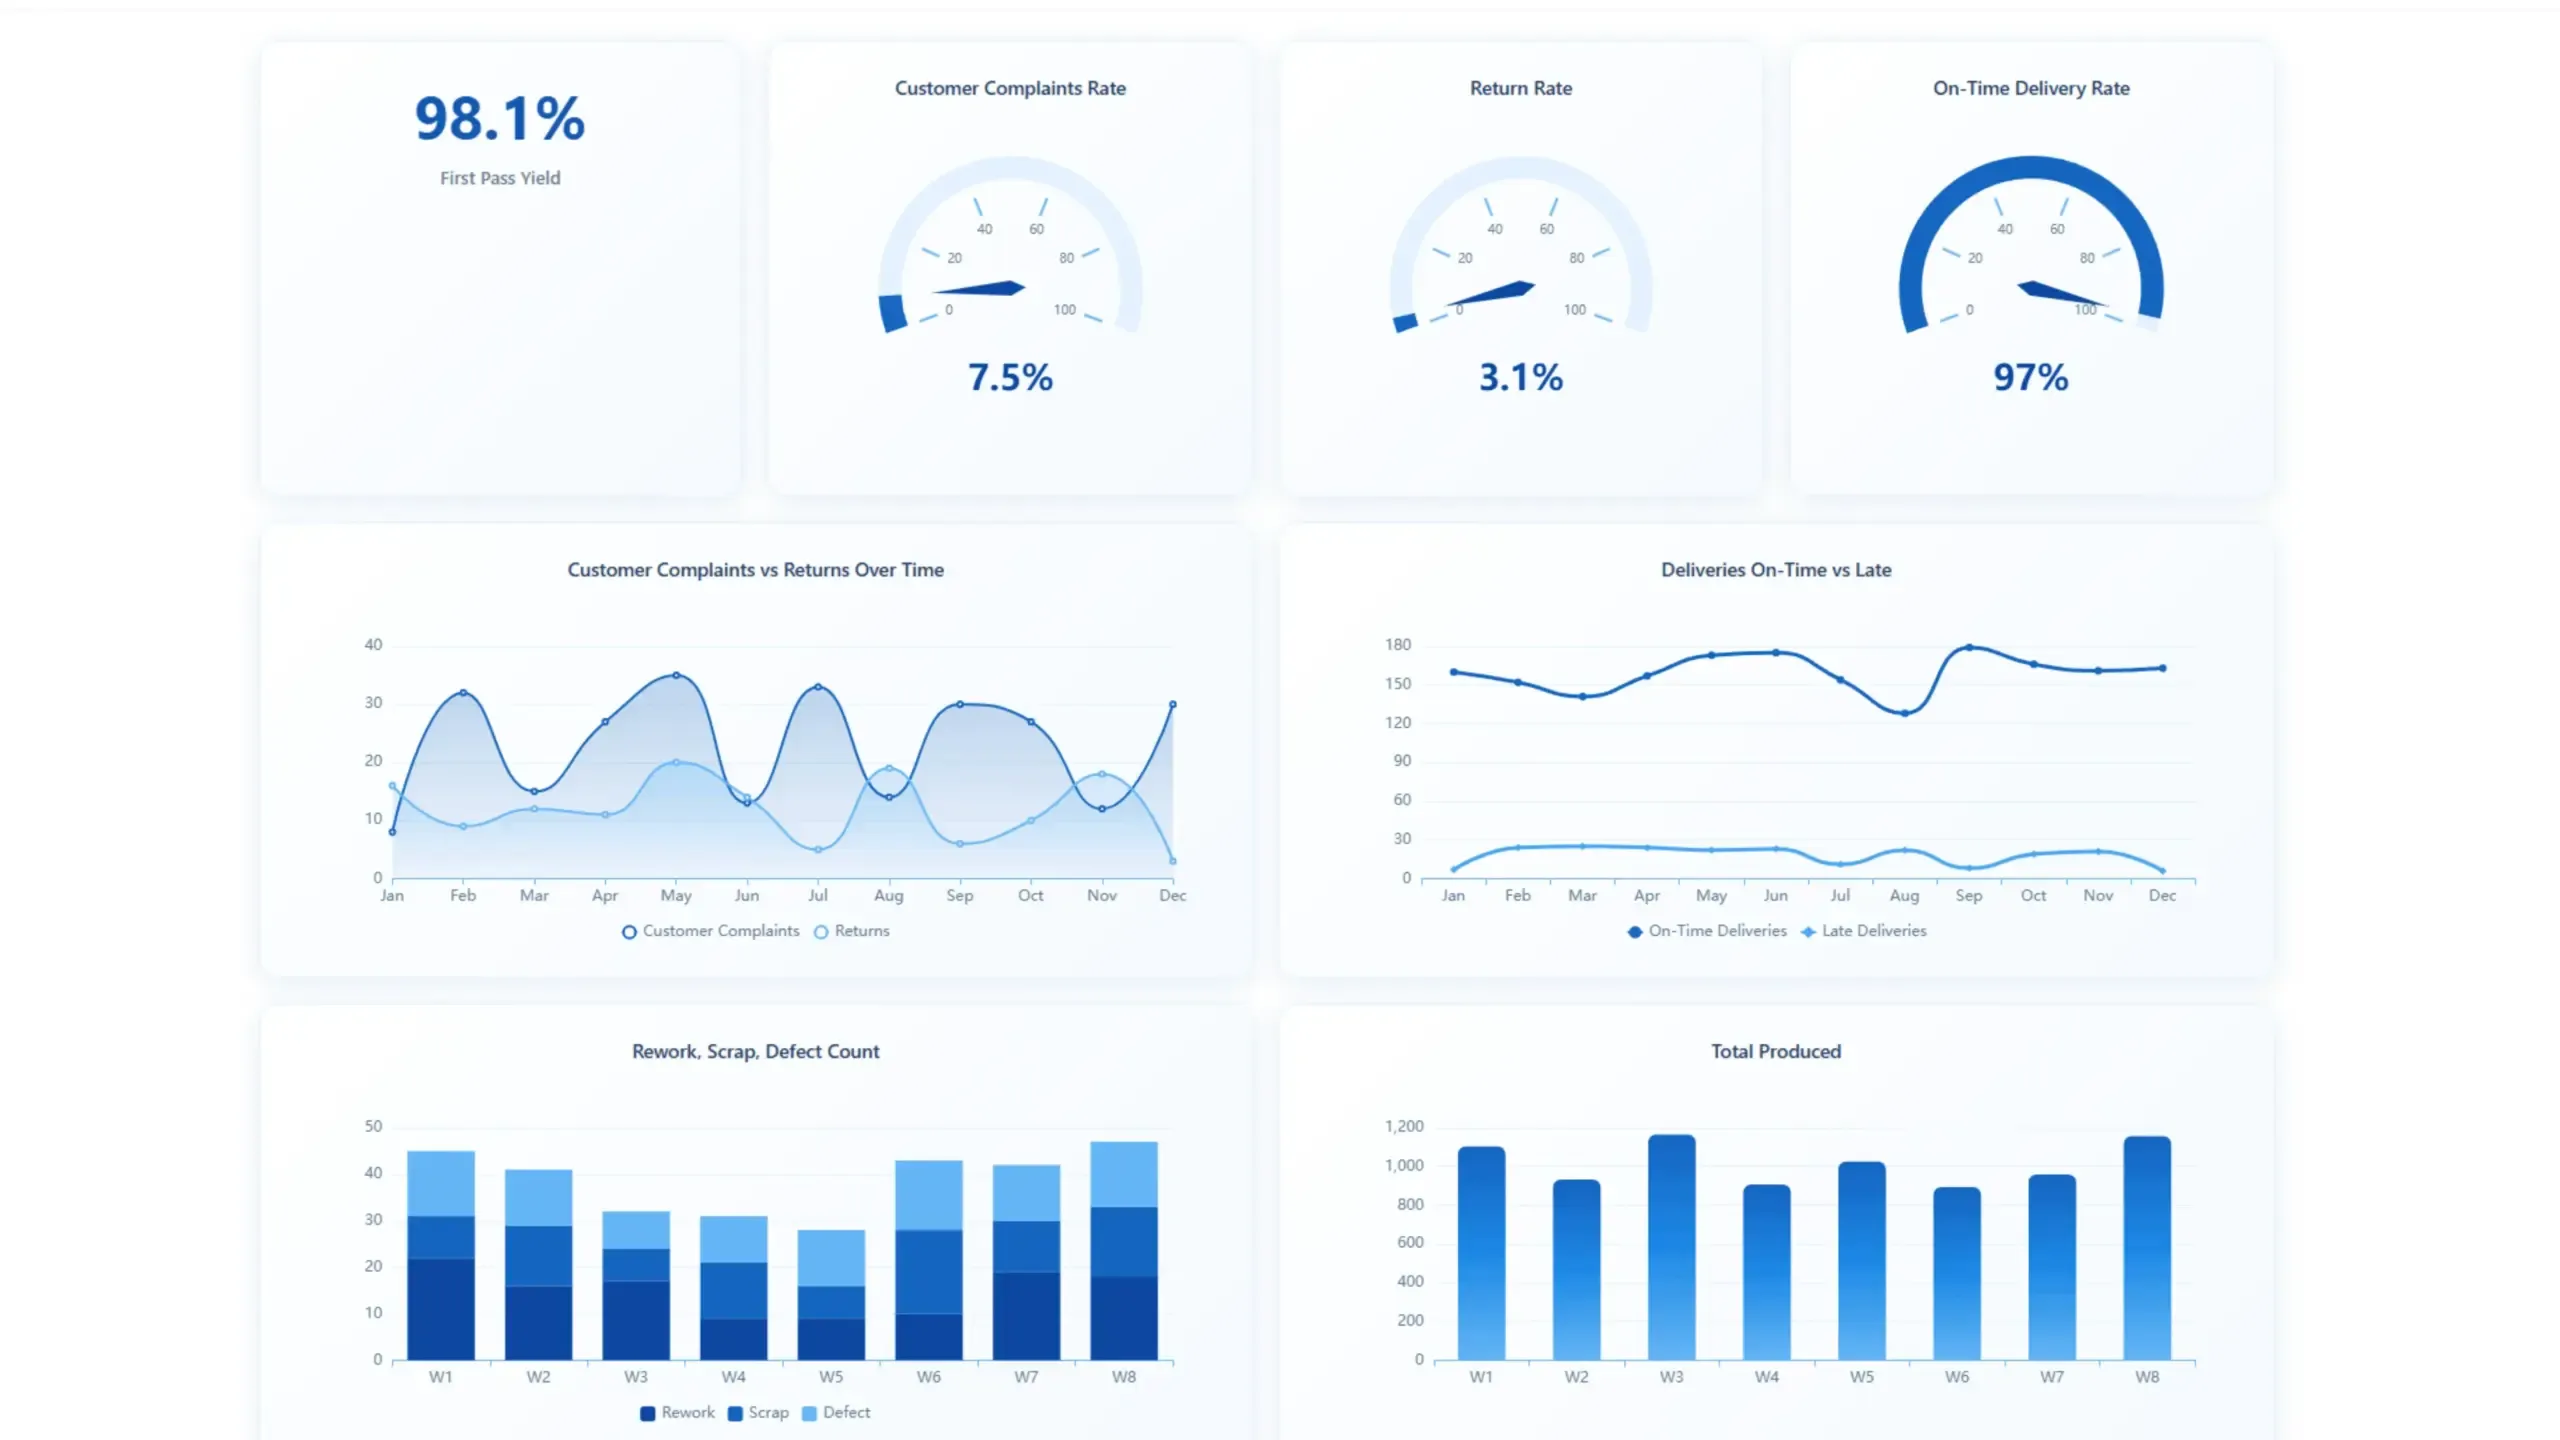
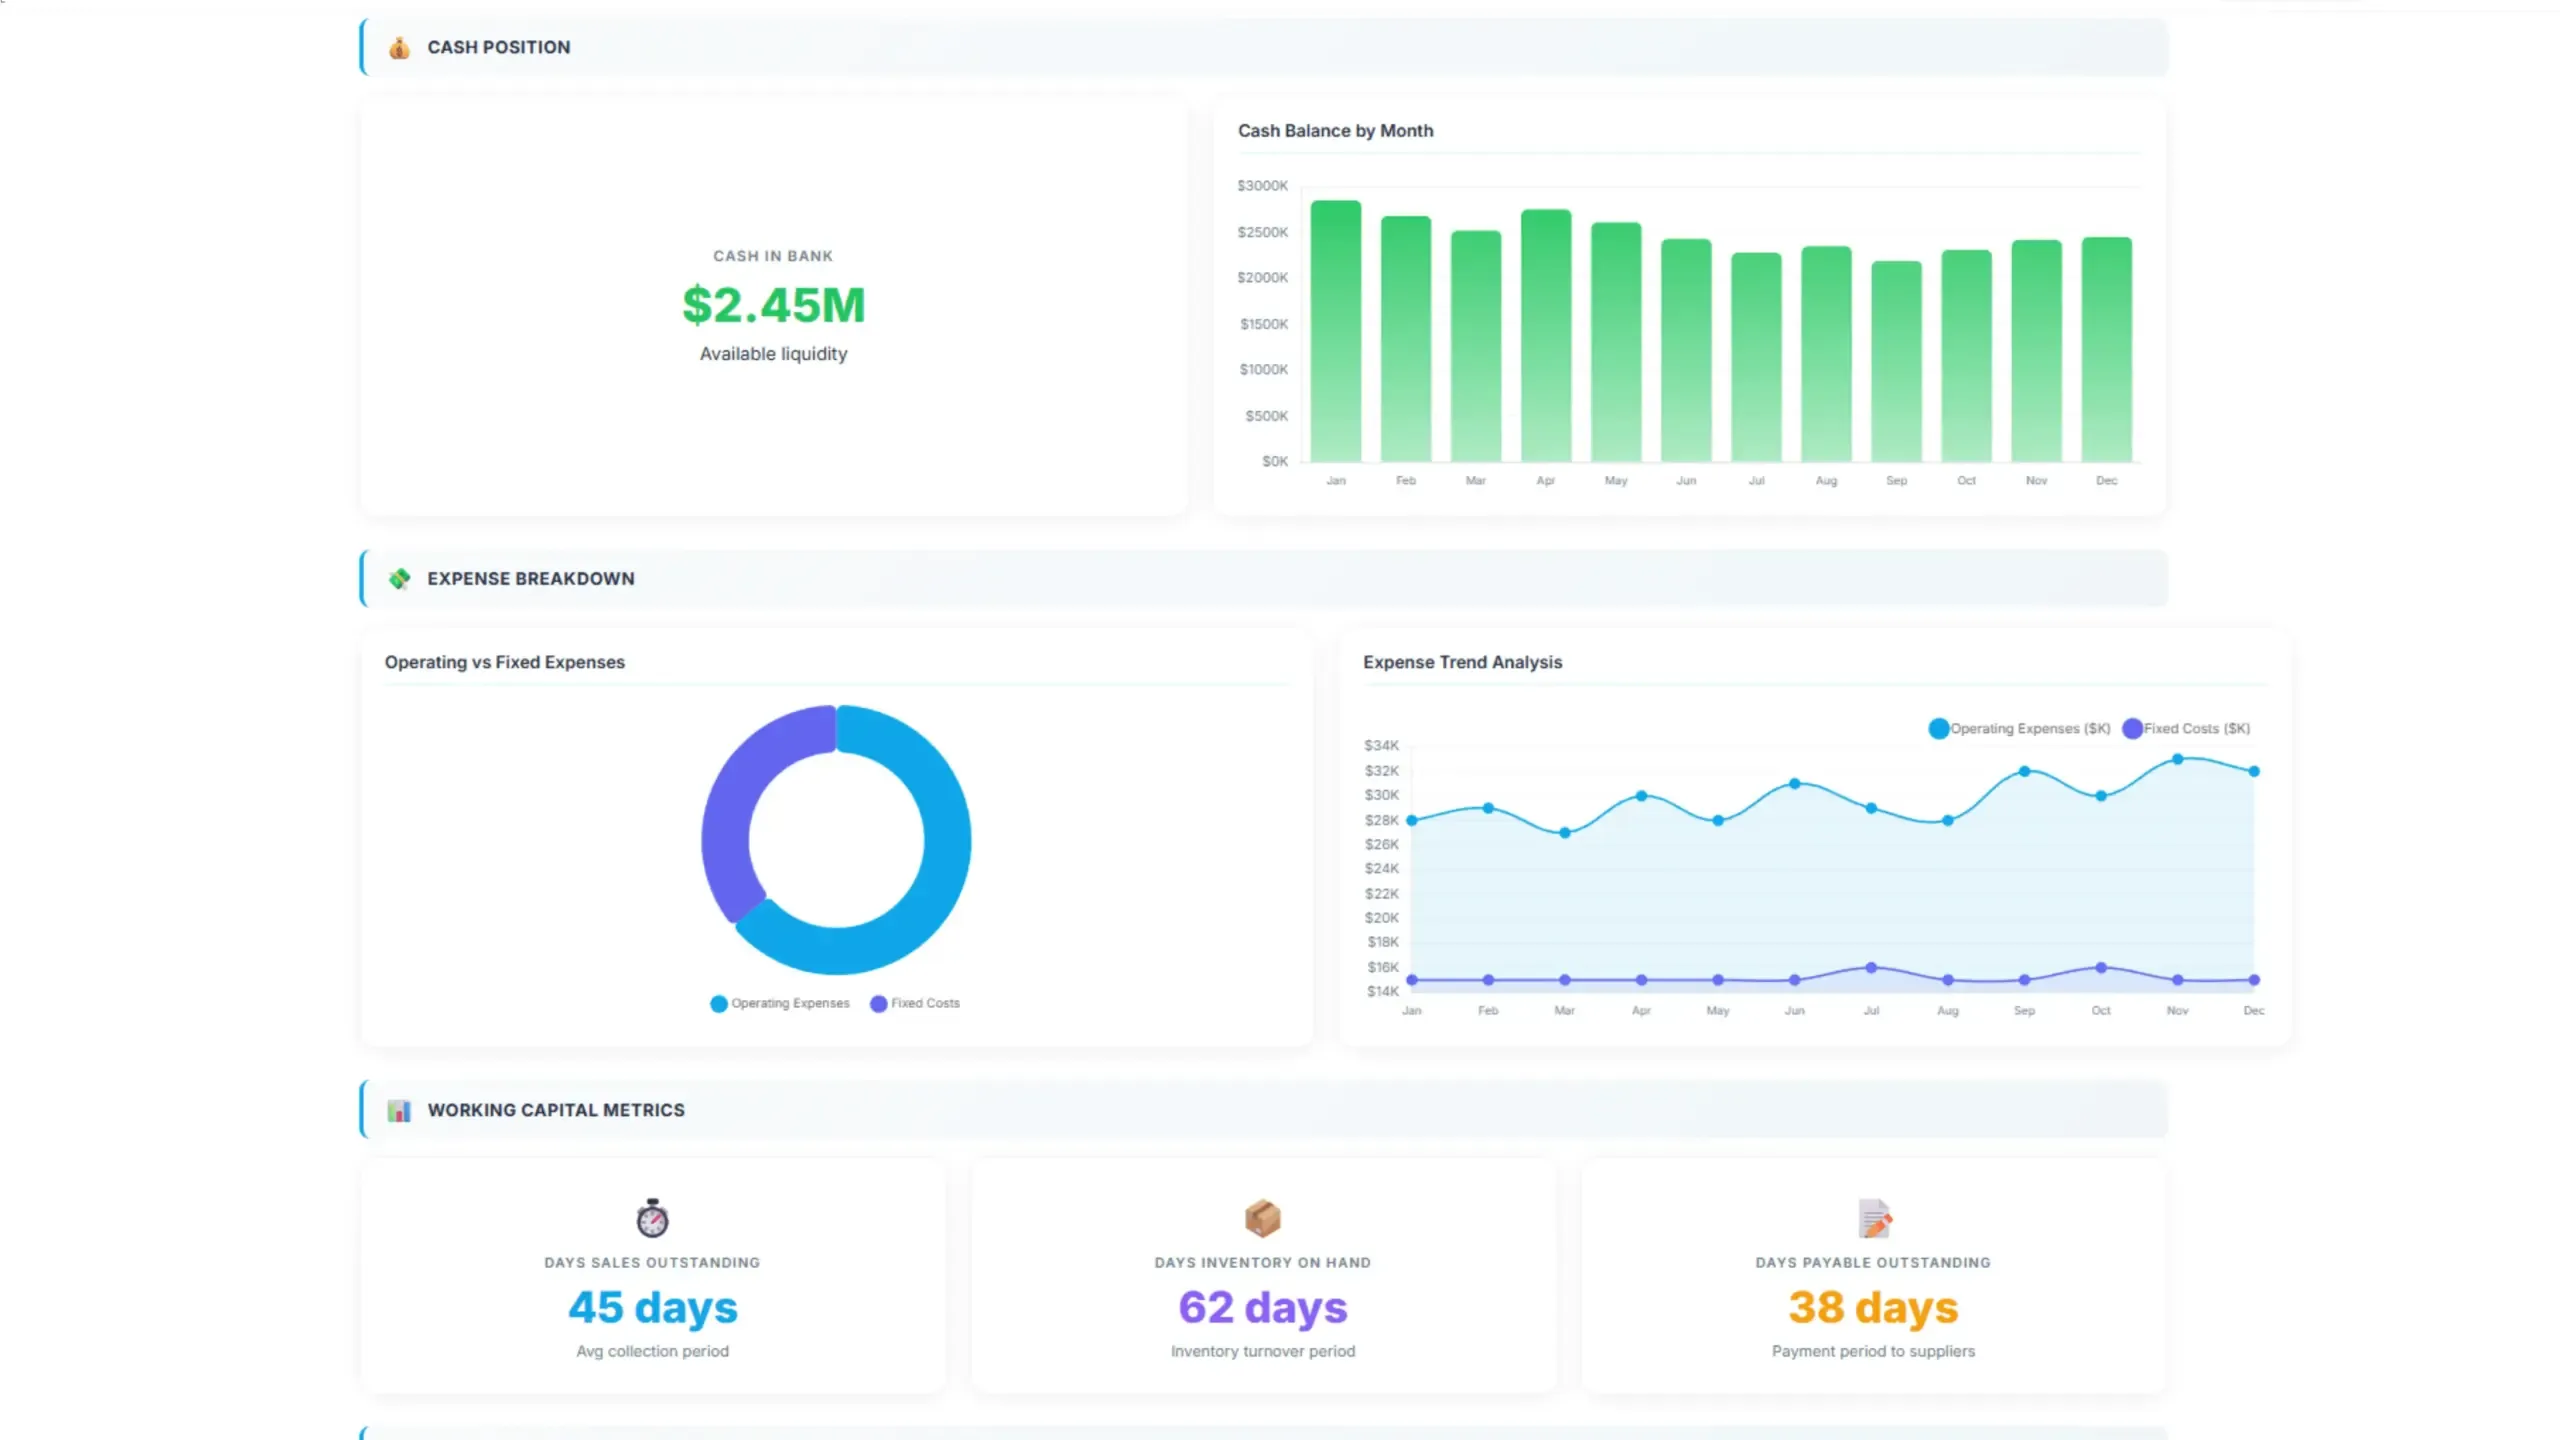
Create a dynamic financial dashboard that provides real-time data using Microsoft SQL Server’s connection.
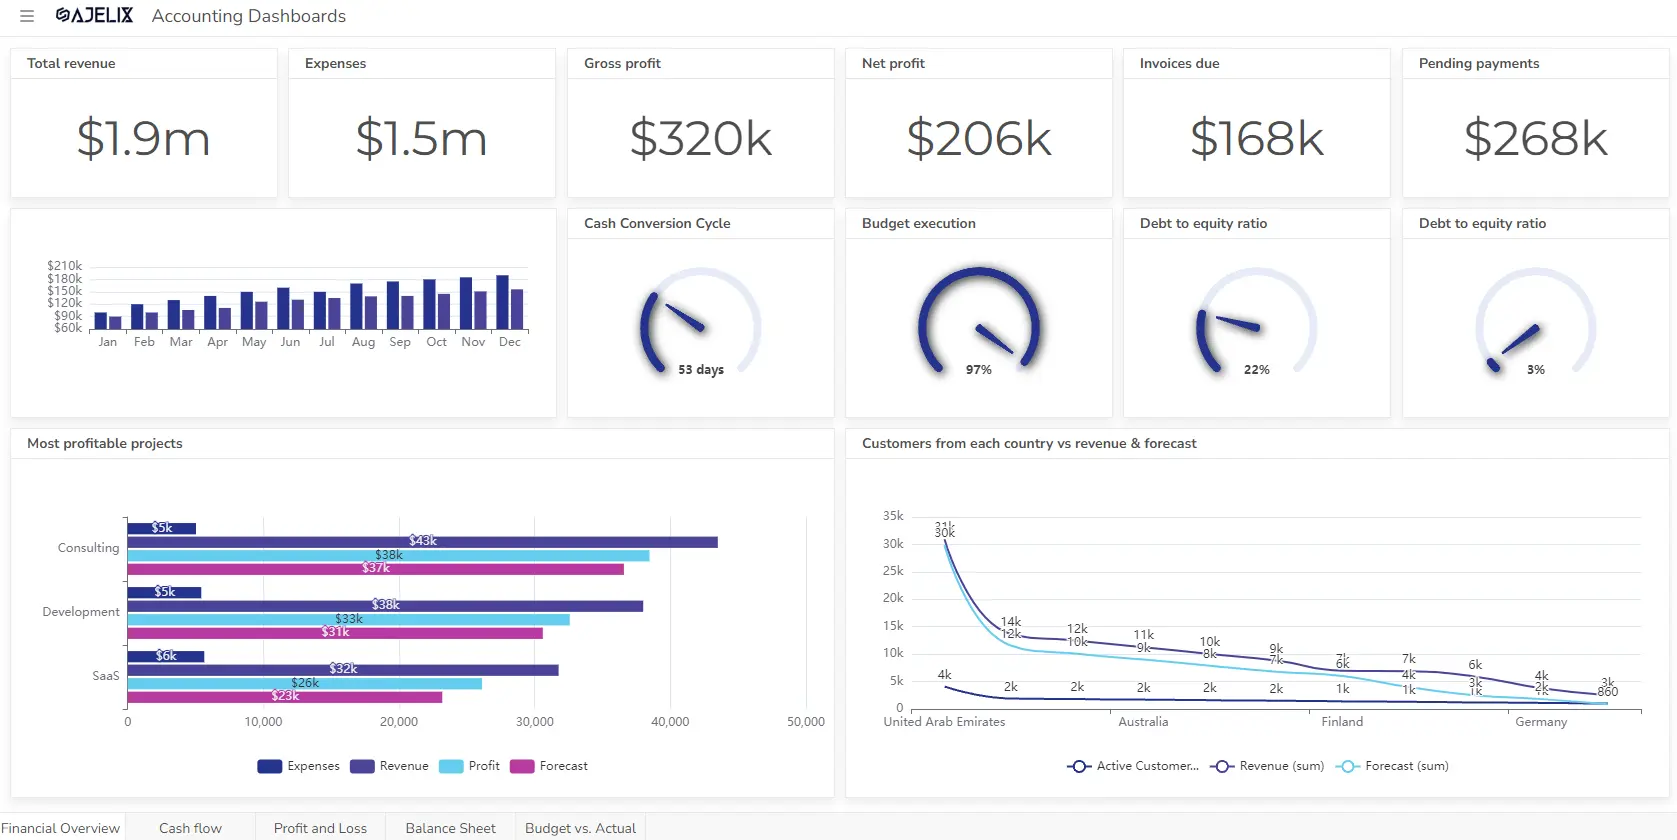
By connecting SQL Server you can visualize key financial metrics such as revenue, expenses, profit margins, and cash flow. In the dashboard above you can see visualized KPIs such as:
- Overview of profitable and non-profitable projects
- Cash conversion cycle
- Budget execution
- Debt to equity cycle
- Debt to equity ratio
- Country overview by revenue and expenses
SQL Server’s performance and scalability ensure that your dashboard can deliver real-time updates.
Struggling with manual calculations & tiring setups?
Let agentic AI do the heavy lifting.
Start free
Fast sign up & easy setup
How To Create SQL Dashboard?
Time needed: 5 hours
Here’s a step-by-step guide on creating an SQL dashboard using PostgreSQL, MySQL, MSSQL connections, and using Ajelix BI platform for visualization. P.S. You can use Ajelix BI free version to create this dashboard.
- Connect your data source
Start building your dashboard by connecting your data. Go to the data sources menu, select Add data source, and choose one of the SQL connections.
- Setup SQL connection
Connect to the server by filling in the necessary details for your SQL server. Insert data to configure your server:
1. Host Address: Add the URL of your MySQL server (e.g., jdbc:mysql://localhost:3306/your_database).
2. Port: the default port is already set but make sure that your server has the same port
3. Database Name: The name of your MySQL database.
4. Username: Your MySQL username.
5. Password: Your MySQL password.
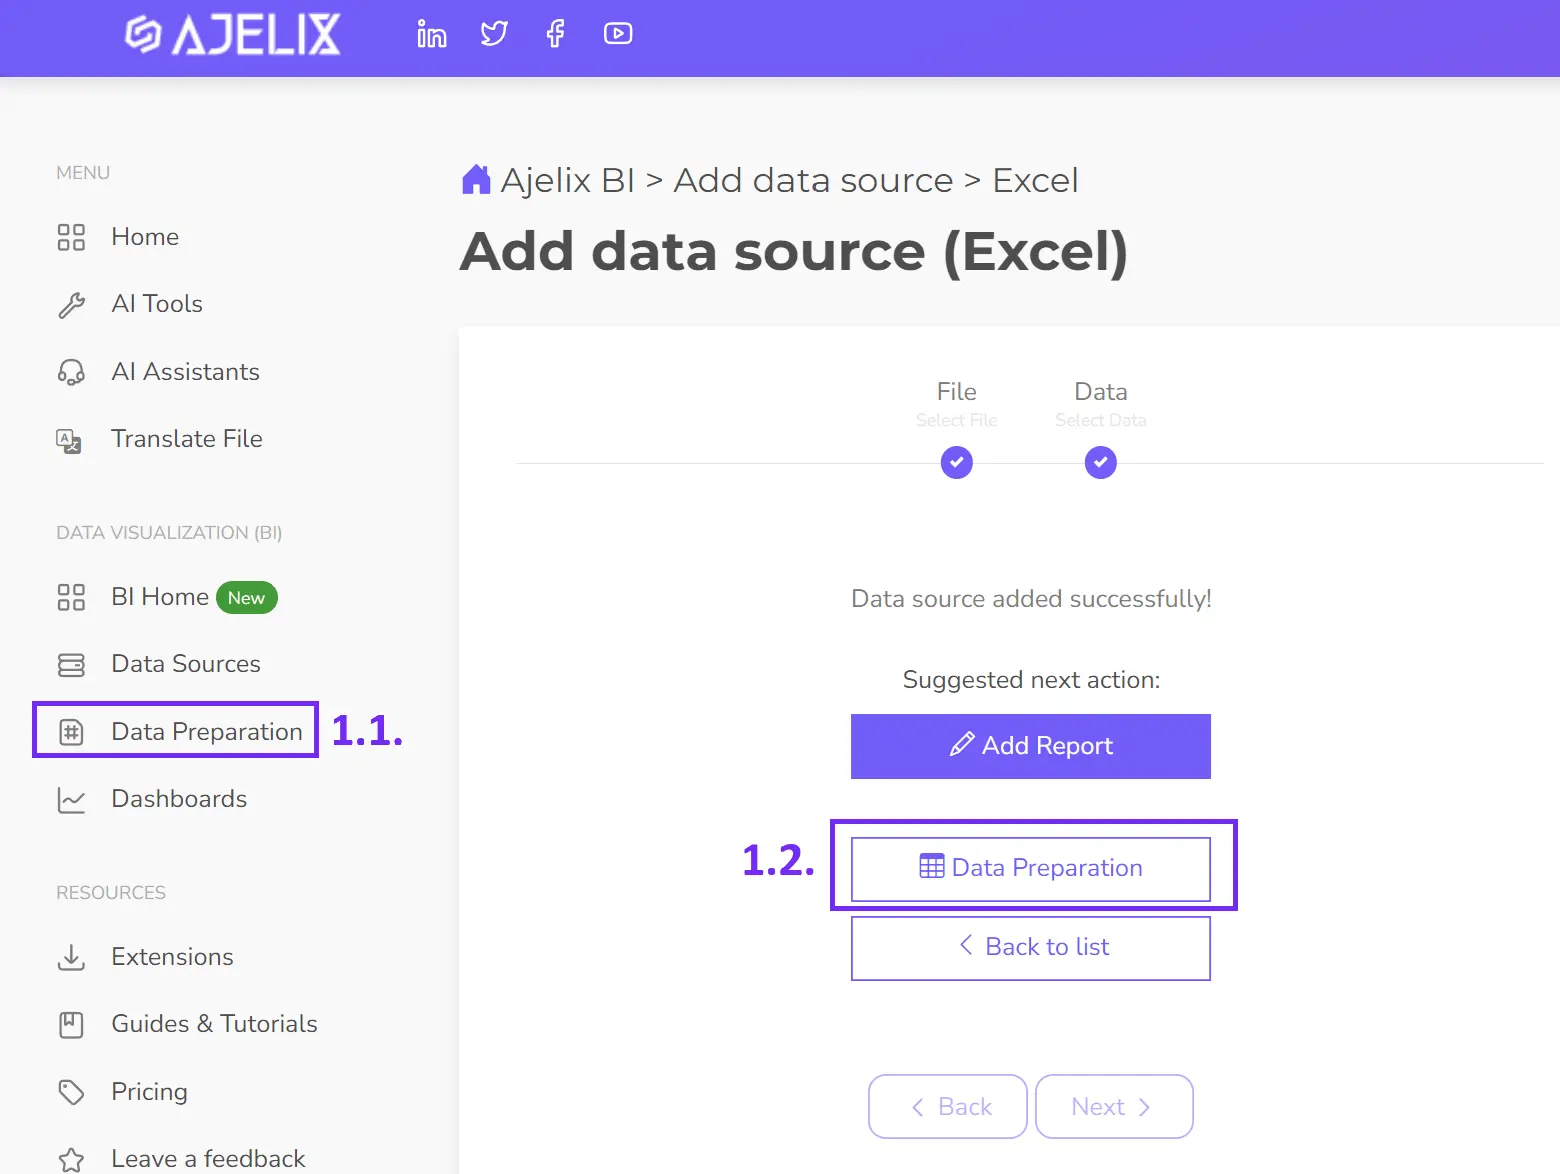
6. Click Next - Clean and transform your data
Once you have connected data you can prepare it before visualization. In this step you can calculate, transform, and filter using a data preparation tool and SQL queries. Ajelix BI offers formatting and filtering options to ensure accurate insights.
- Create KPIs & metrics
Follow the steps to create KPIs:
1. Select your data source.
2. Create a new measure.
3. Define a clear KPI name.
4. Enter the calculation formula.
5. Save your changes.
If you need help with formulas you can find over 100 metrics and formulas for different industries on our blog.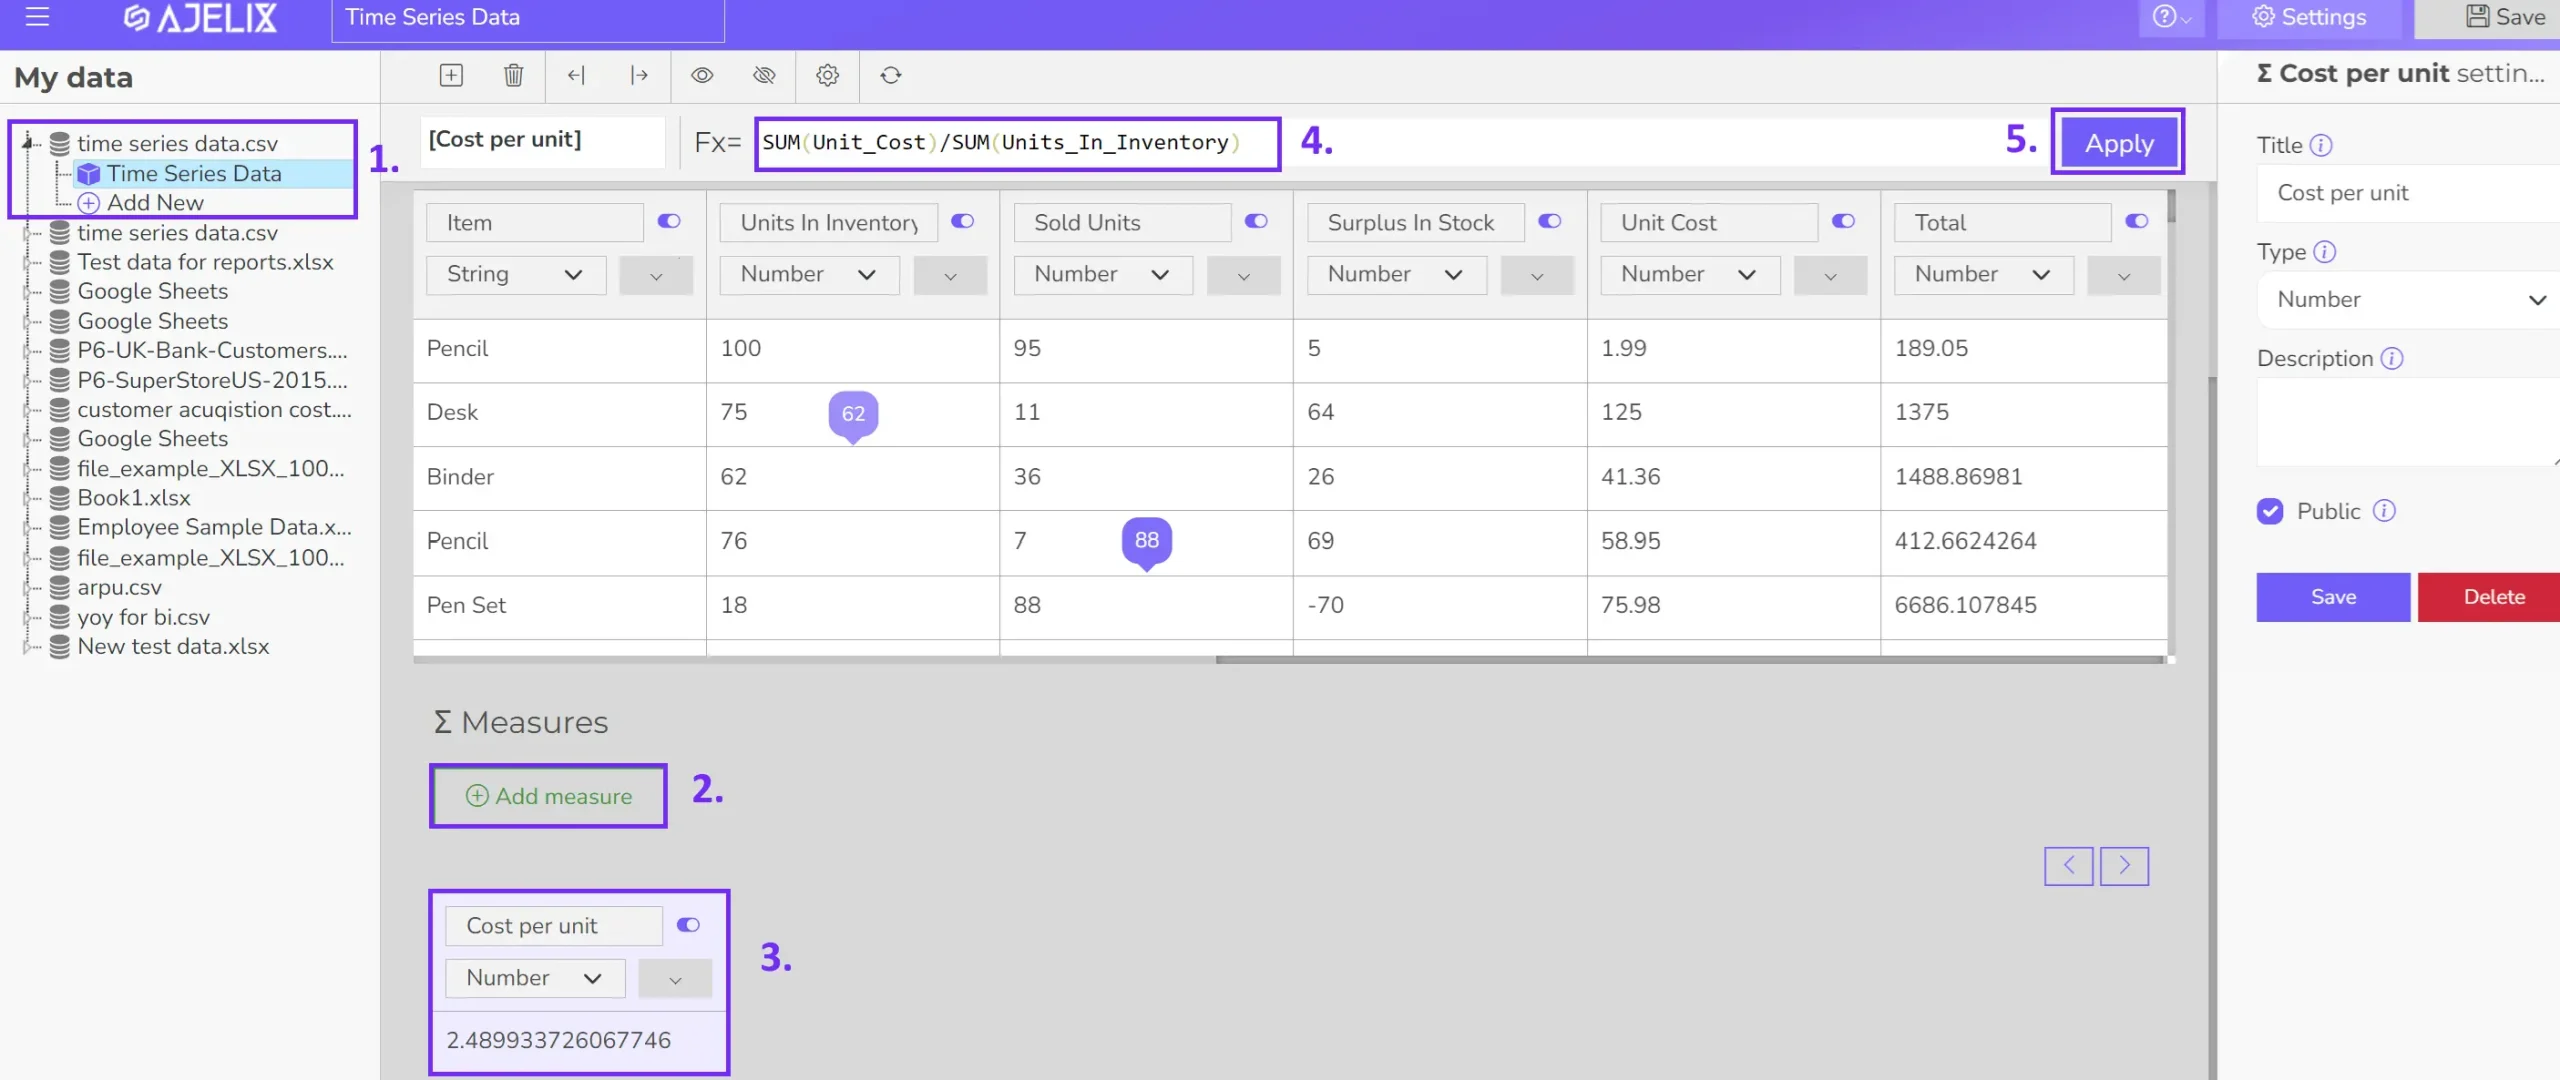
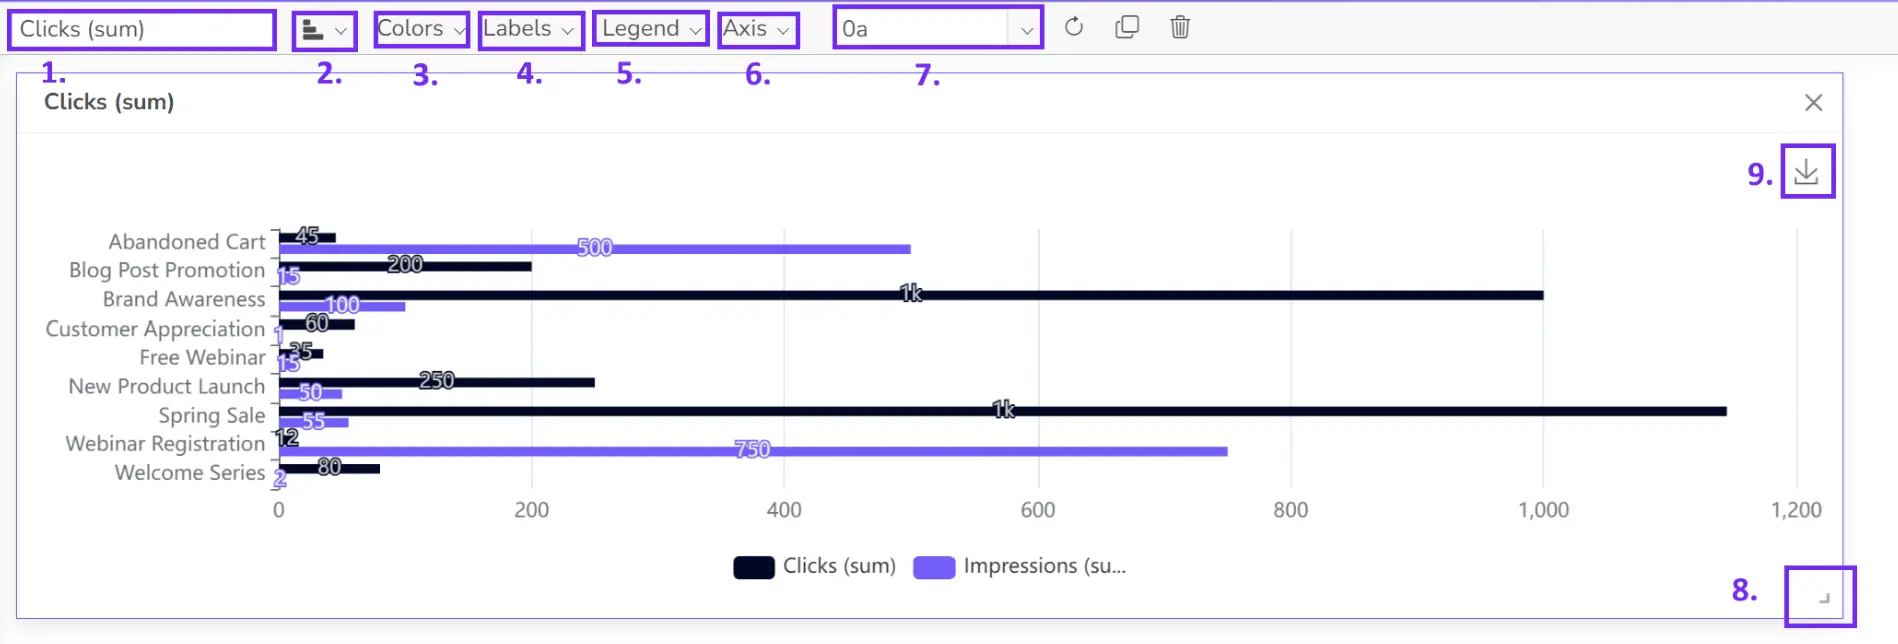
- Build your visualizations
Once you have created KPIs and the data is ready go to the dashboard page and create a new dashboard. Visualize your data by choosing from cards, gauges, line graphs, and more. Easily drag and drop data columns to populate your charts. Or, let Ajelix BI’s AI do the work for you with automated chart creation. If you need guides to help you get started visit our documentation page.
- Customize your dashboard
Add titles, change colors, and customize your chart to meet your brand guidelines using extensive customization options.
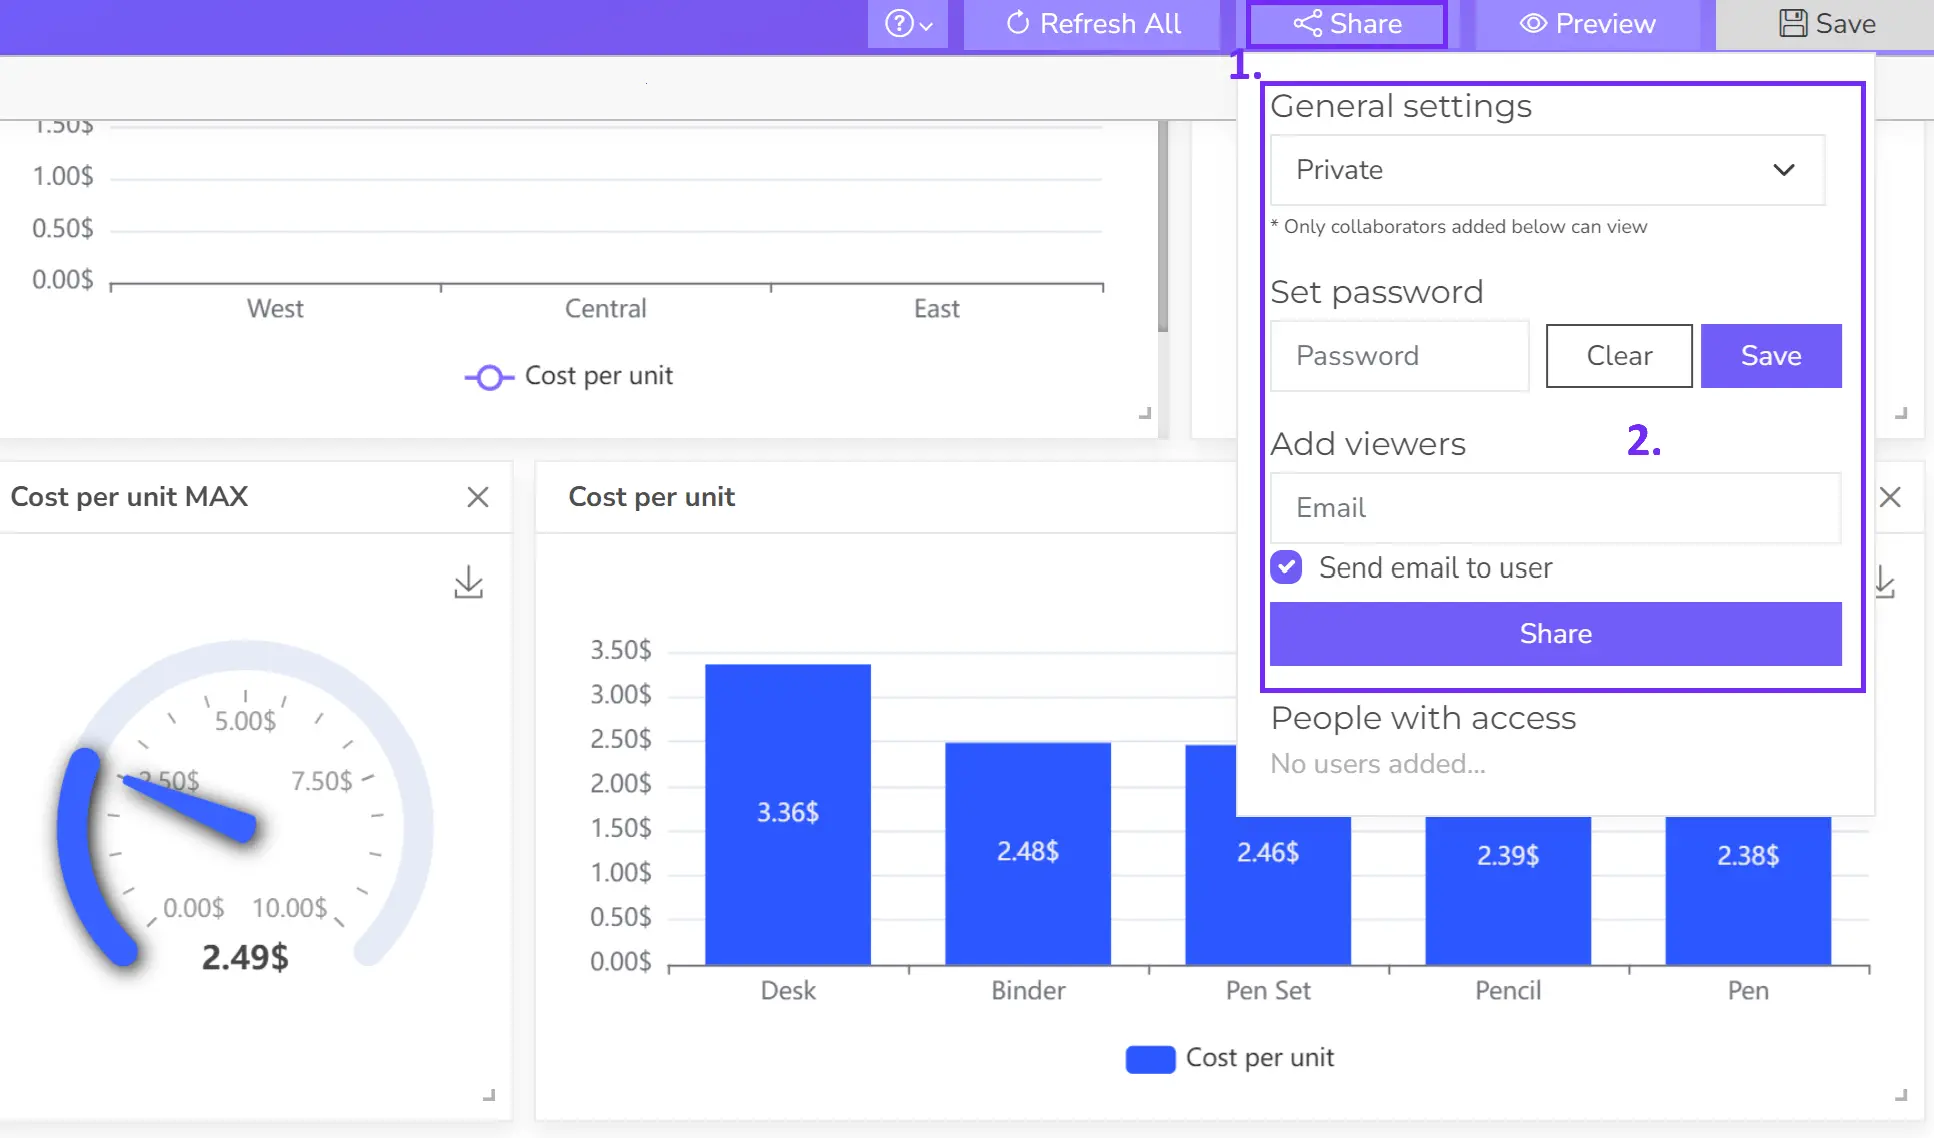
- Share your dashboard
Once happy, publish your dashboard and share it with relevant users for real-time insights.
Reporting gives you a headache?
Upload your data and create professional reports with agentic AI

Start free
Try free and upgrade whenever
5 SQL dashboard tools: Software to create a Real-time dashboard using SQL
Here are 5 popular dashboard tools that can connect to SQL databases:
- Ajelix BI: an easy-to-use business intelligence platform offering a wide range of AI features for data visualization, reporting, and analysis. It integrates with various MySQL, MSSQL, and PostgreSQL databases and provides a user-friendly interface for creating interactive dashboards.
- Tableau: A powerful data visualization tool known for its drag-and-drop interface and ability to create stunning dashboards. Tableau supports a variety of SQL databases and offers a rich set of visualizations.
- Power BI: Microsoft’s business intelligence tool that provides a flexible and scalable platform for data analysis and reporting. Power BI connects to a wide range of SQL databases and offers a variety of visualizations and features.
- Looker: A cloud-based business intelligence platform that offers advanced data exploration and analysis capabilities. Looker integrates with SQL databases and provides a customizable dashboarding experience.
- Qlik Sense: A self-service business intelligence tool that allows users to explore data and create interactive dashboards. Qlik Sense supports a variety of SQL databases and offers a unique associative engine for data exploration.
FAQ
An SQL dashboard is a visual representation of data from an SQL database. It provides a real-time view of key metrics and trends, helping users make informed decisions.
Most popular SQL databases, such as MySQL, PostgreSQL, SQL Server, and Oracle, can be integrated with dashboard tools.
There are many tools available for creating SQL dashboards, including Tableau, Power BI, Looker, Grafana, and Ajelix BI.
The process typically involves configuring a data source within the dashboard tool and providing the database connection details (URL, username, password).
Yes, most dashboard tools allow you to customize the appearance of your dashboard, including colors, fonts, and layouts.
Explore other dashboards


Ready to create your dashboard?