Management Dashboard Examples With KPIs & Metrics

A well-designed management dashboard example is a game-changer for organizations looking to stay agile and proactive.
With the right KPIs and metrics, dashboards turn data into actionable insights, helping managers at all levels track performance and progress toward strategic goals.
In this article, we’ll dive into examples of management dashboards and highlight key metrics that can impact business outcomes.
Change the way you work with agentic AI
One-click dashboards,KPI tracking, and AI-powered insights—for work that actually gets done.

What is a management dashboard?
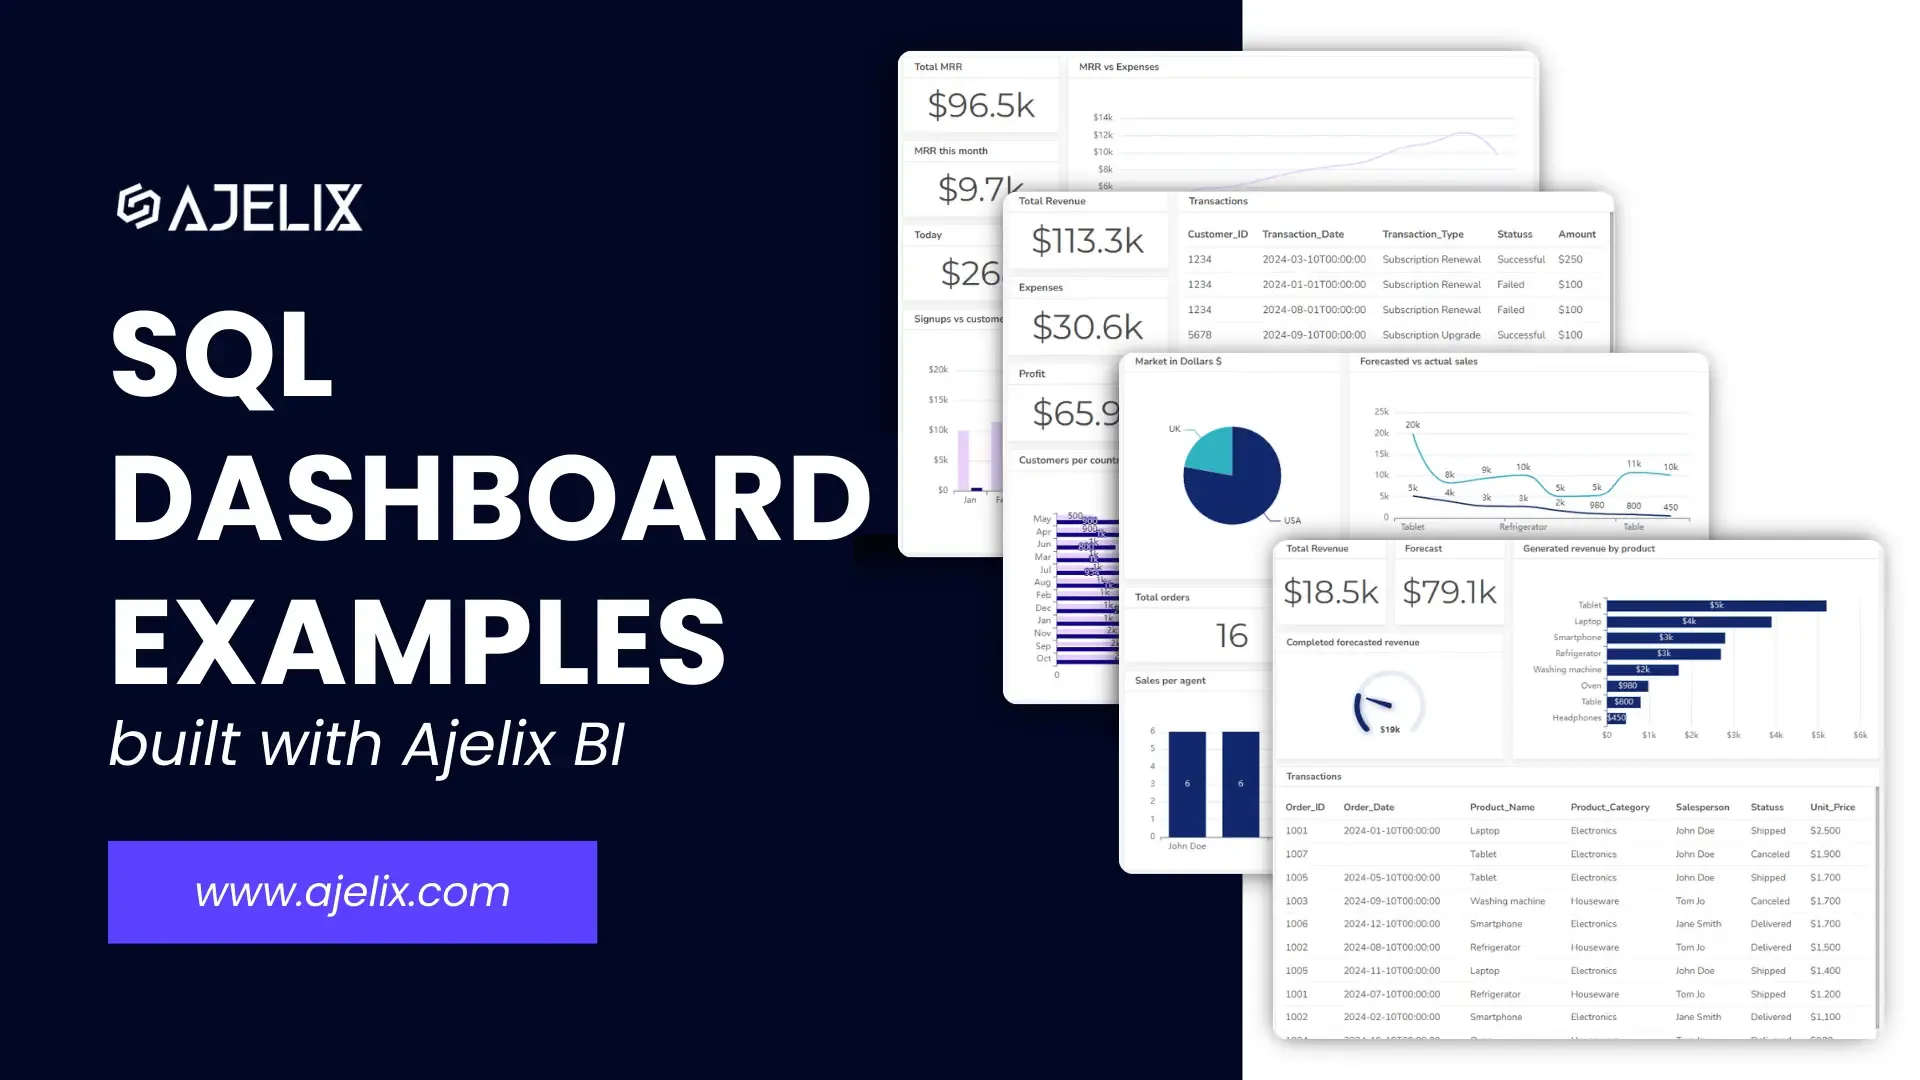
A management dashboard is a digital tool that consolidates and visualizes an organization’s key performance indicators (KPIs), metrics, and essential data in a way that is easily accessible and understandable.
These dashboards serve as a real-time snapshot of business performance, tailored to meet the needs of executives and managers by highlighting the information that directly impacts strategic decision-making.
7 Types of Management Dashboard Examples
Management dashboards can be categorized based on their specific functions and target audiences. Here are some common types:
- Operational dashboard
- Financial dashboard example for management
- Marketing Management Dashboard
- Sales management dashboard
- HR dashboard example
- Customer service dashboard
- Executive dashboard example
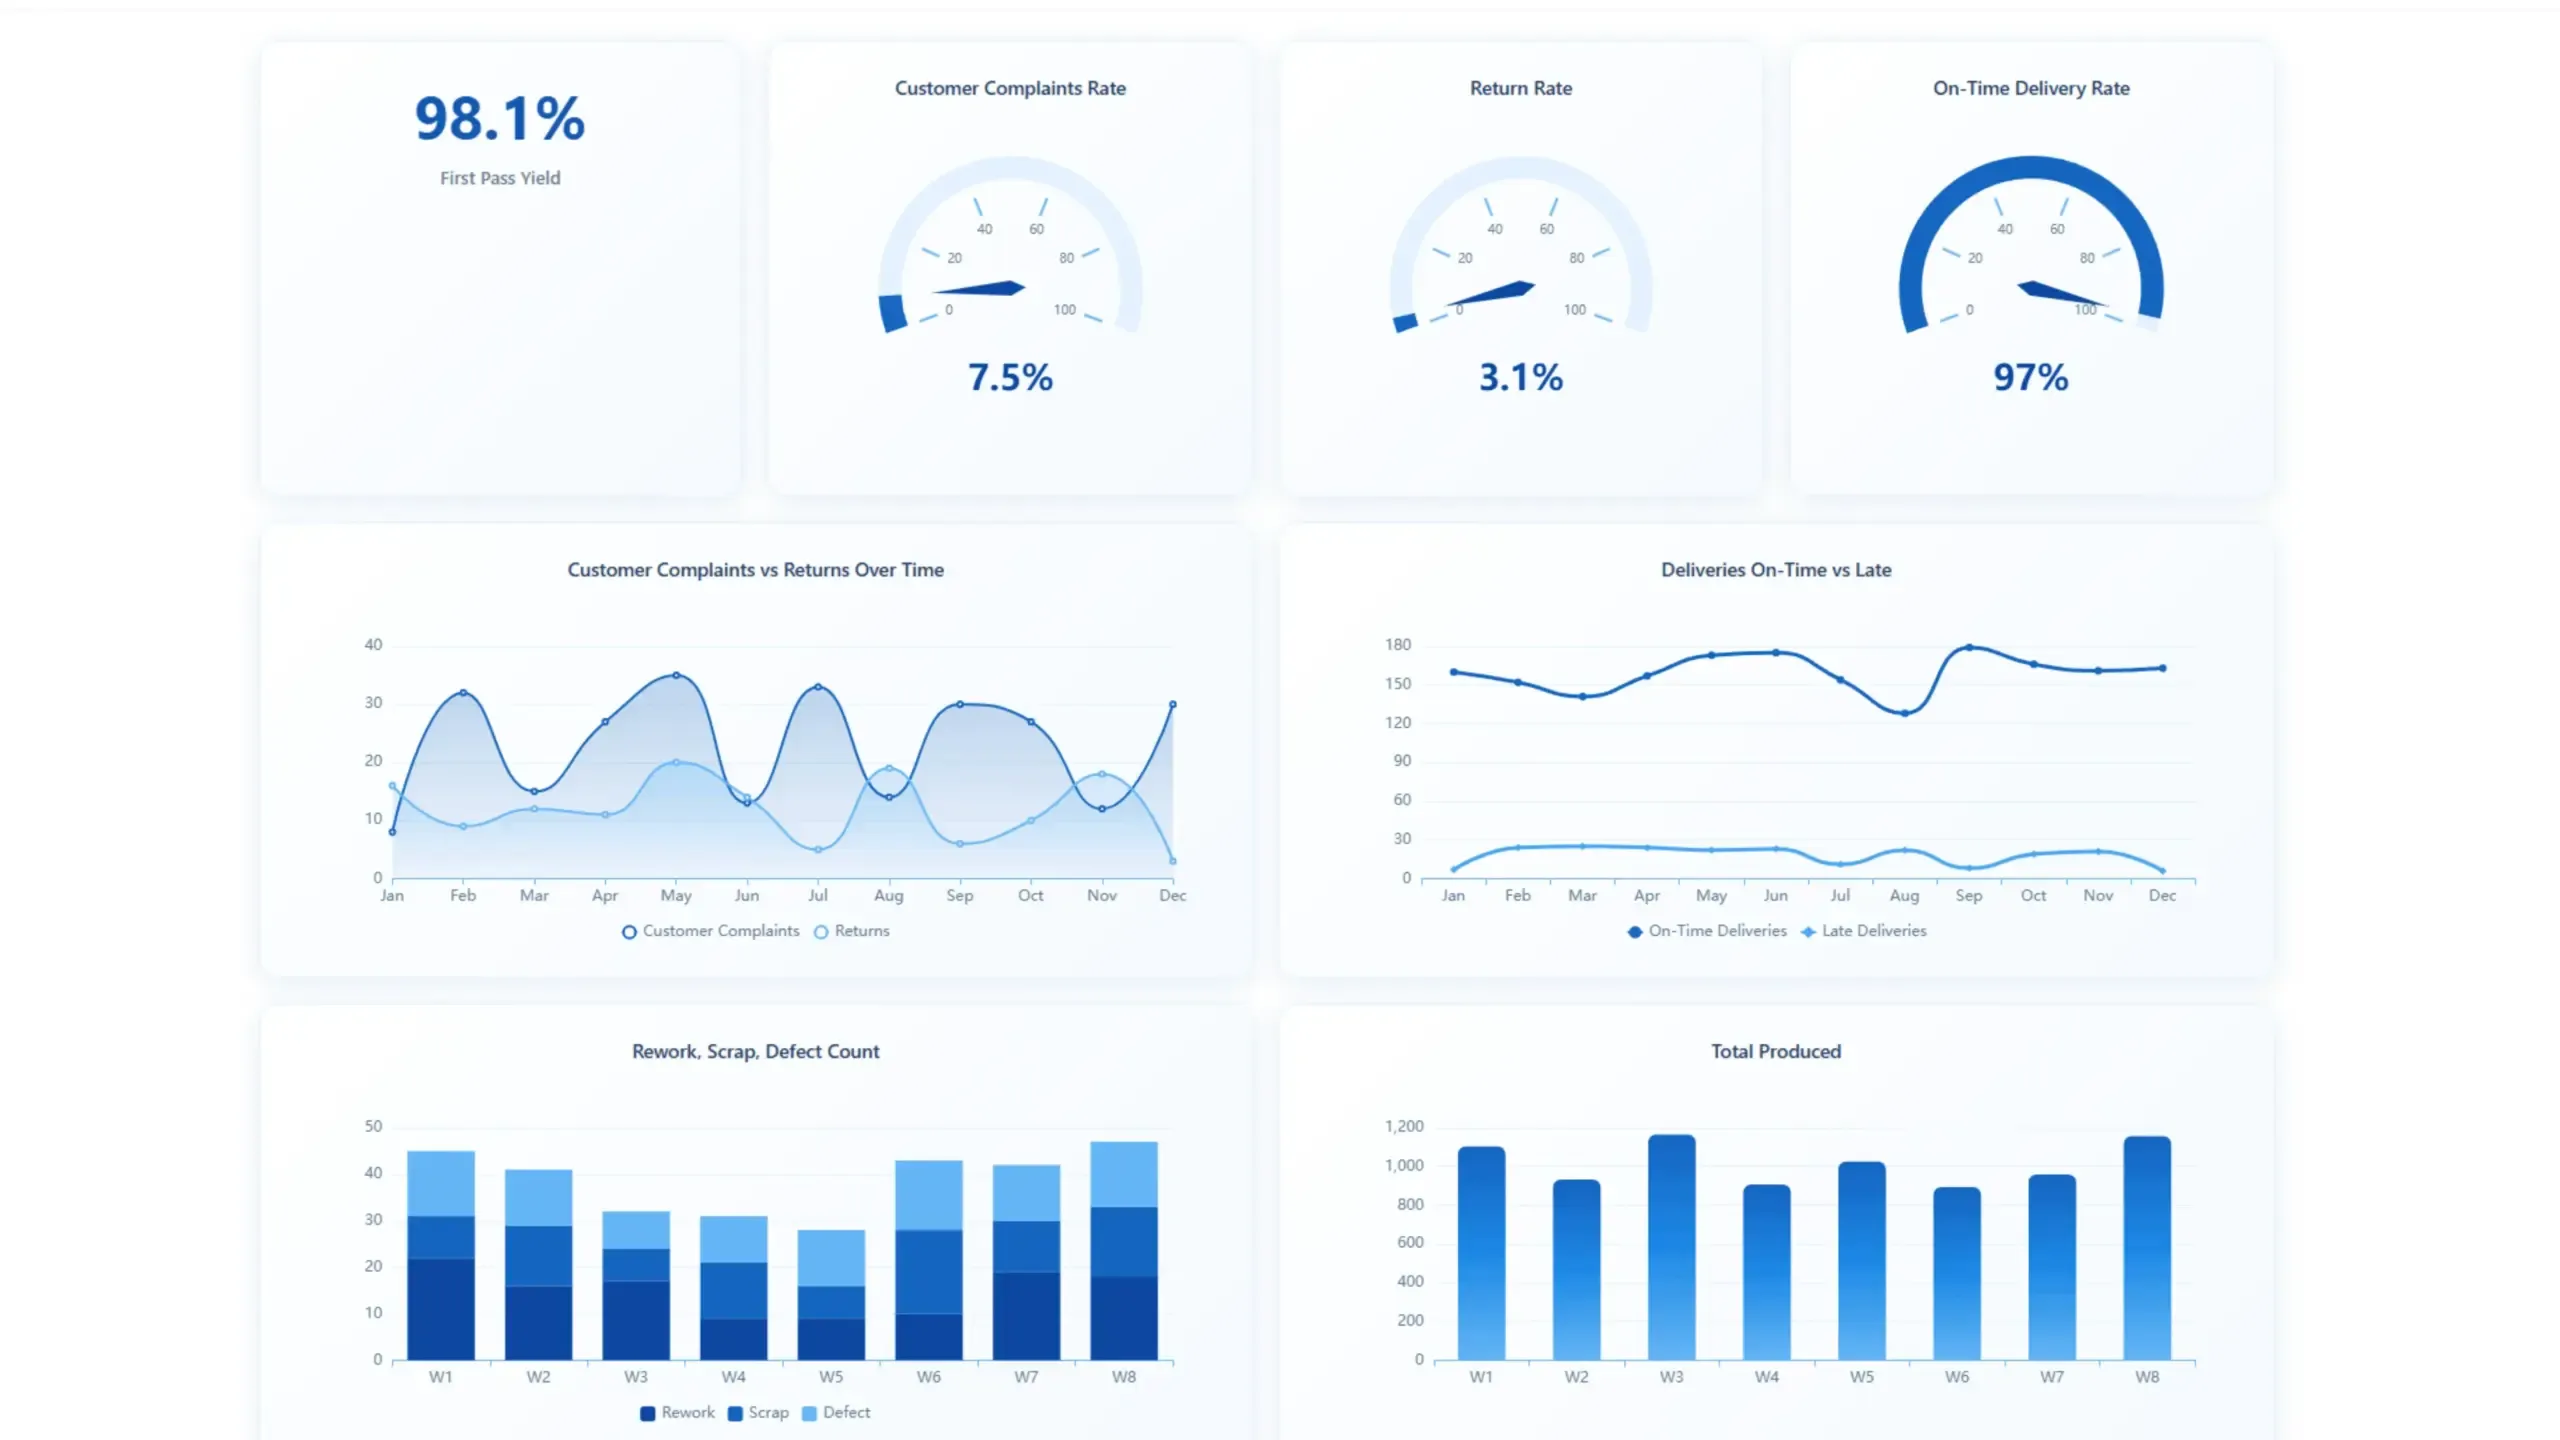
1. Operational Dashboard Example For Management
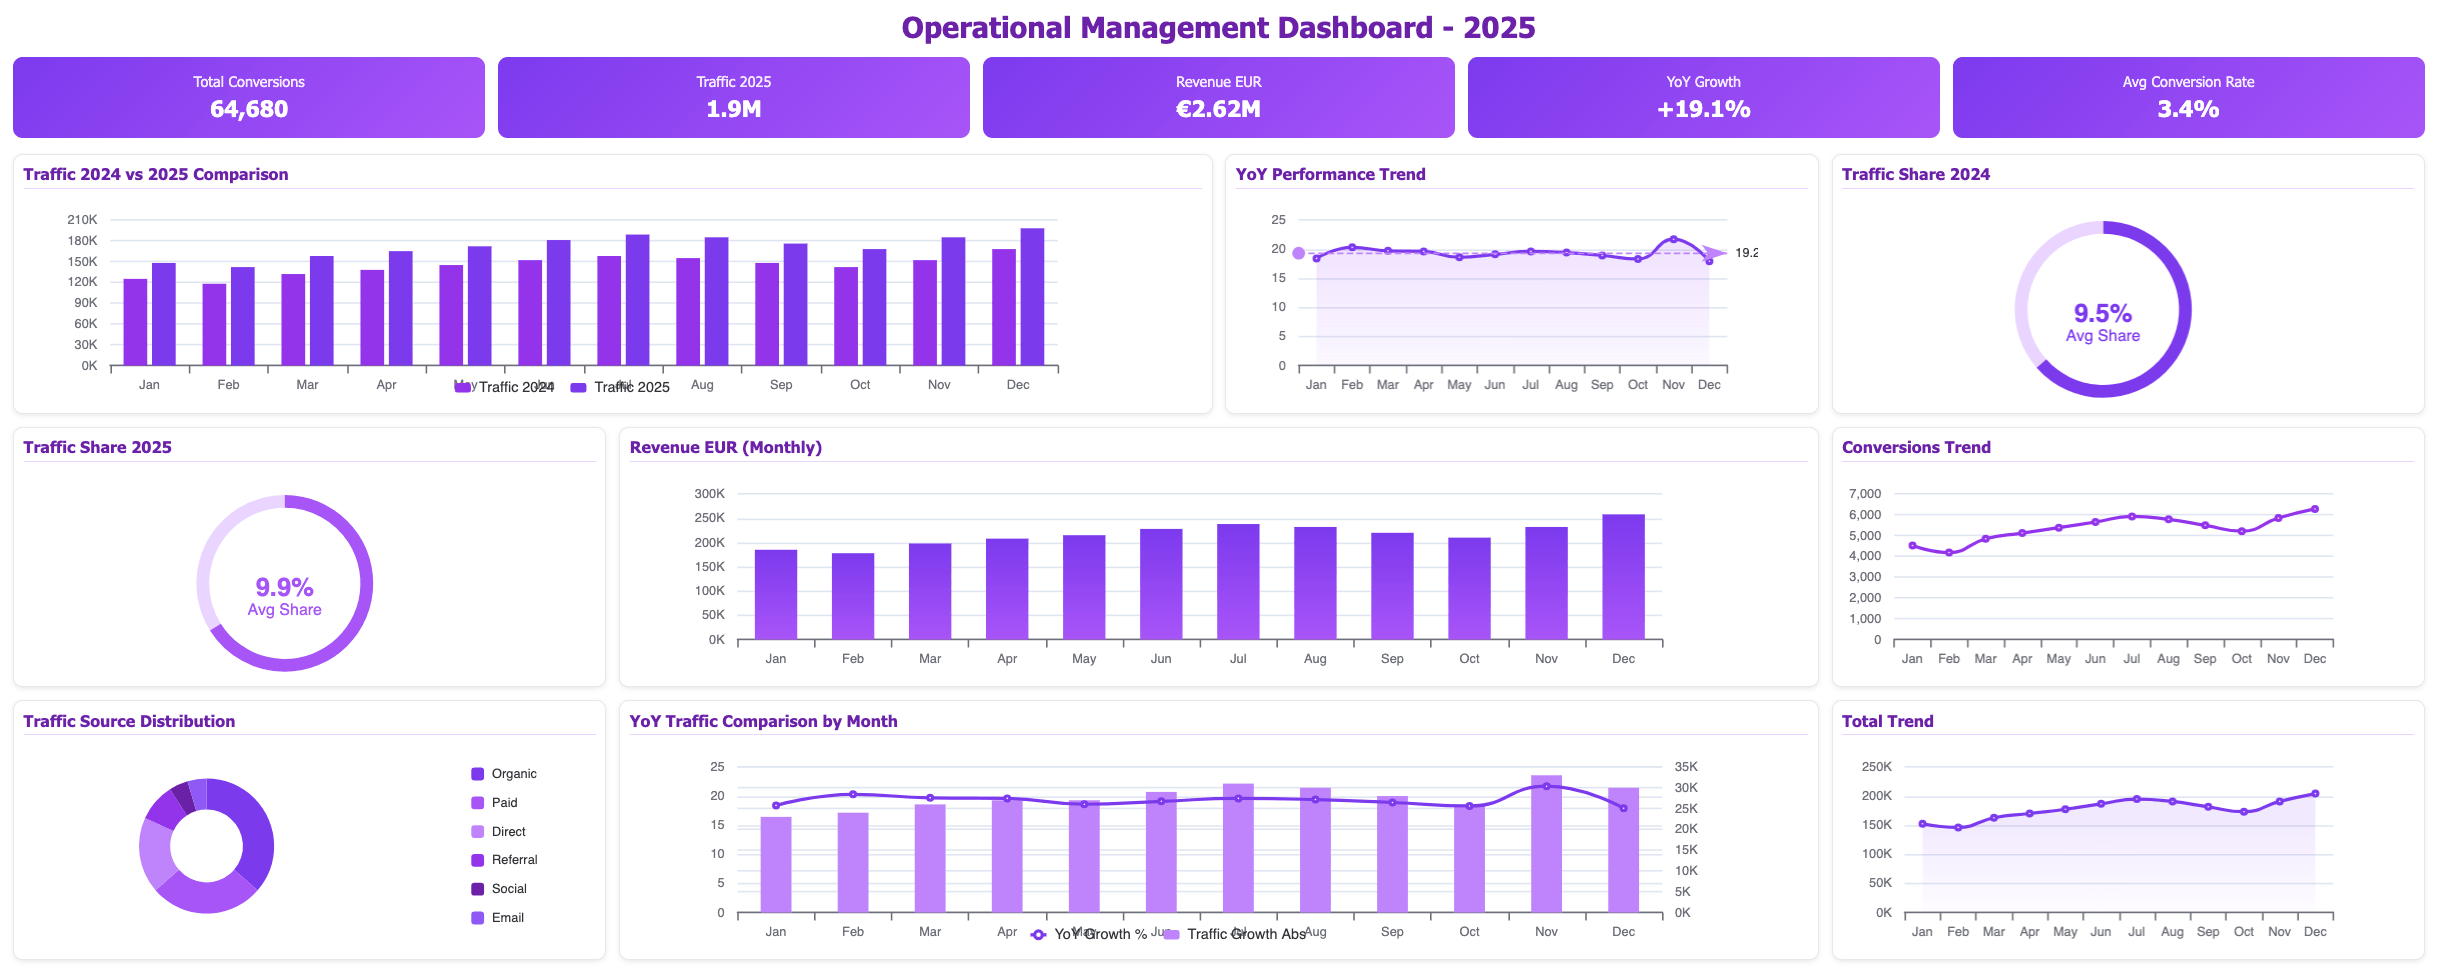
- Purpose: Monitor day-to-day operations and identify issues that impact productivity or efficiency.
- Key metrics: Production rates, inventory levels, financial metrics, year-over-year growth, customer satisfaction, and employee turnover.
- Example: A manufacturing plant might use a manufacturing operational dashboard to track machine downtime, production output, and quality control metrics.
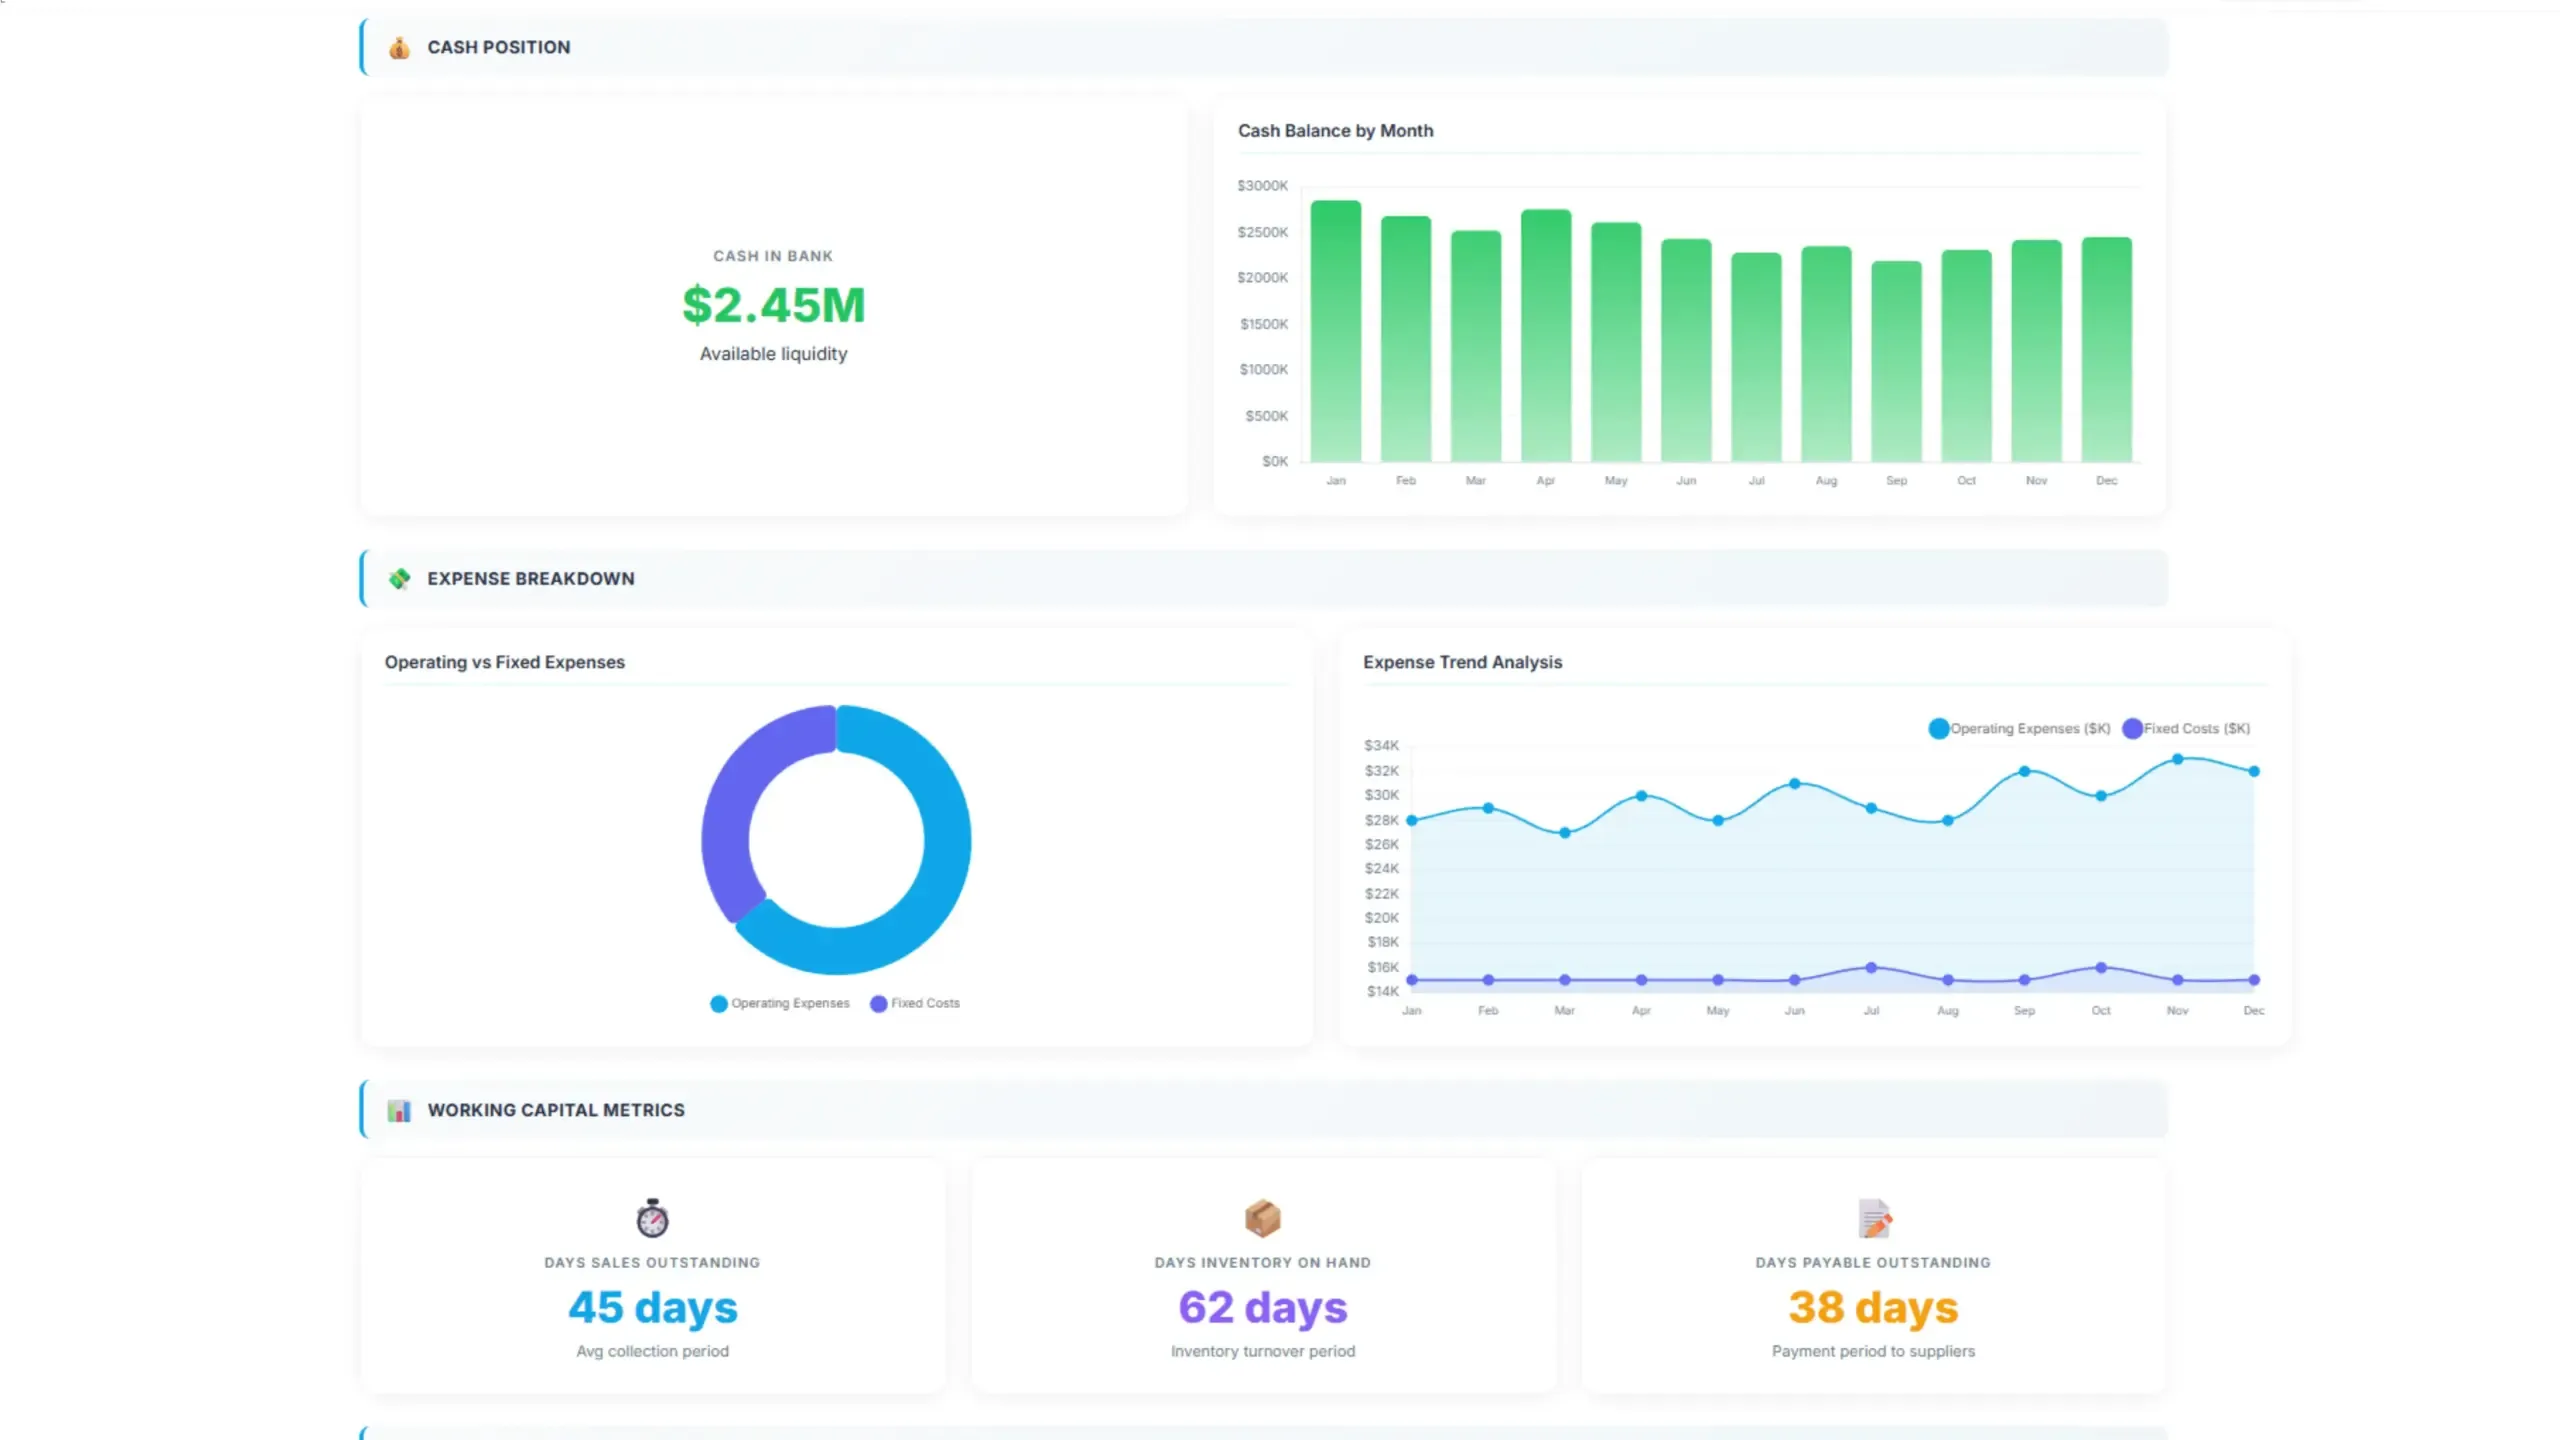
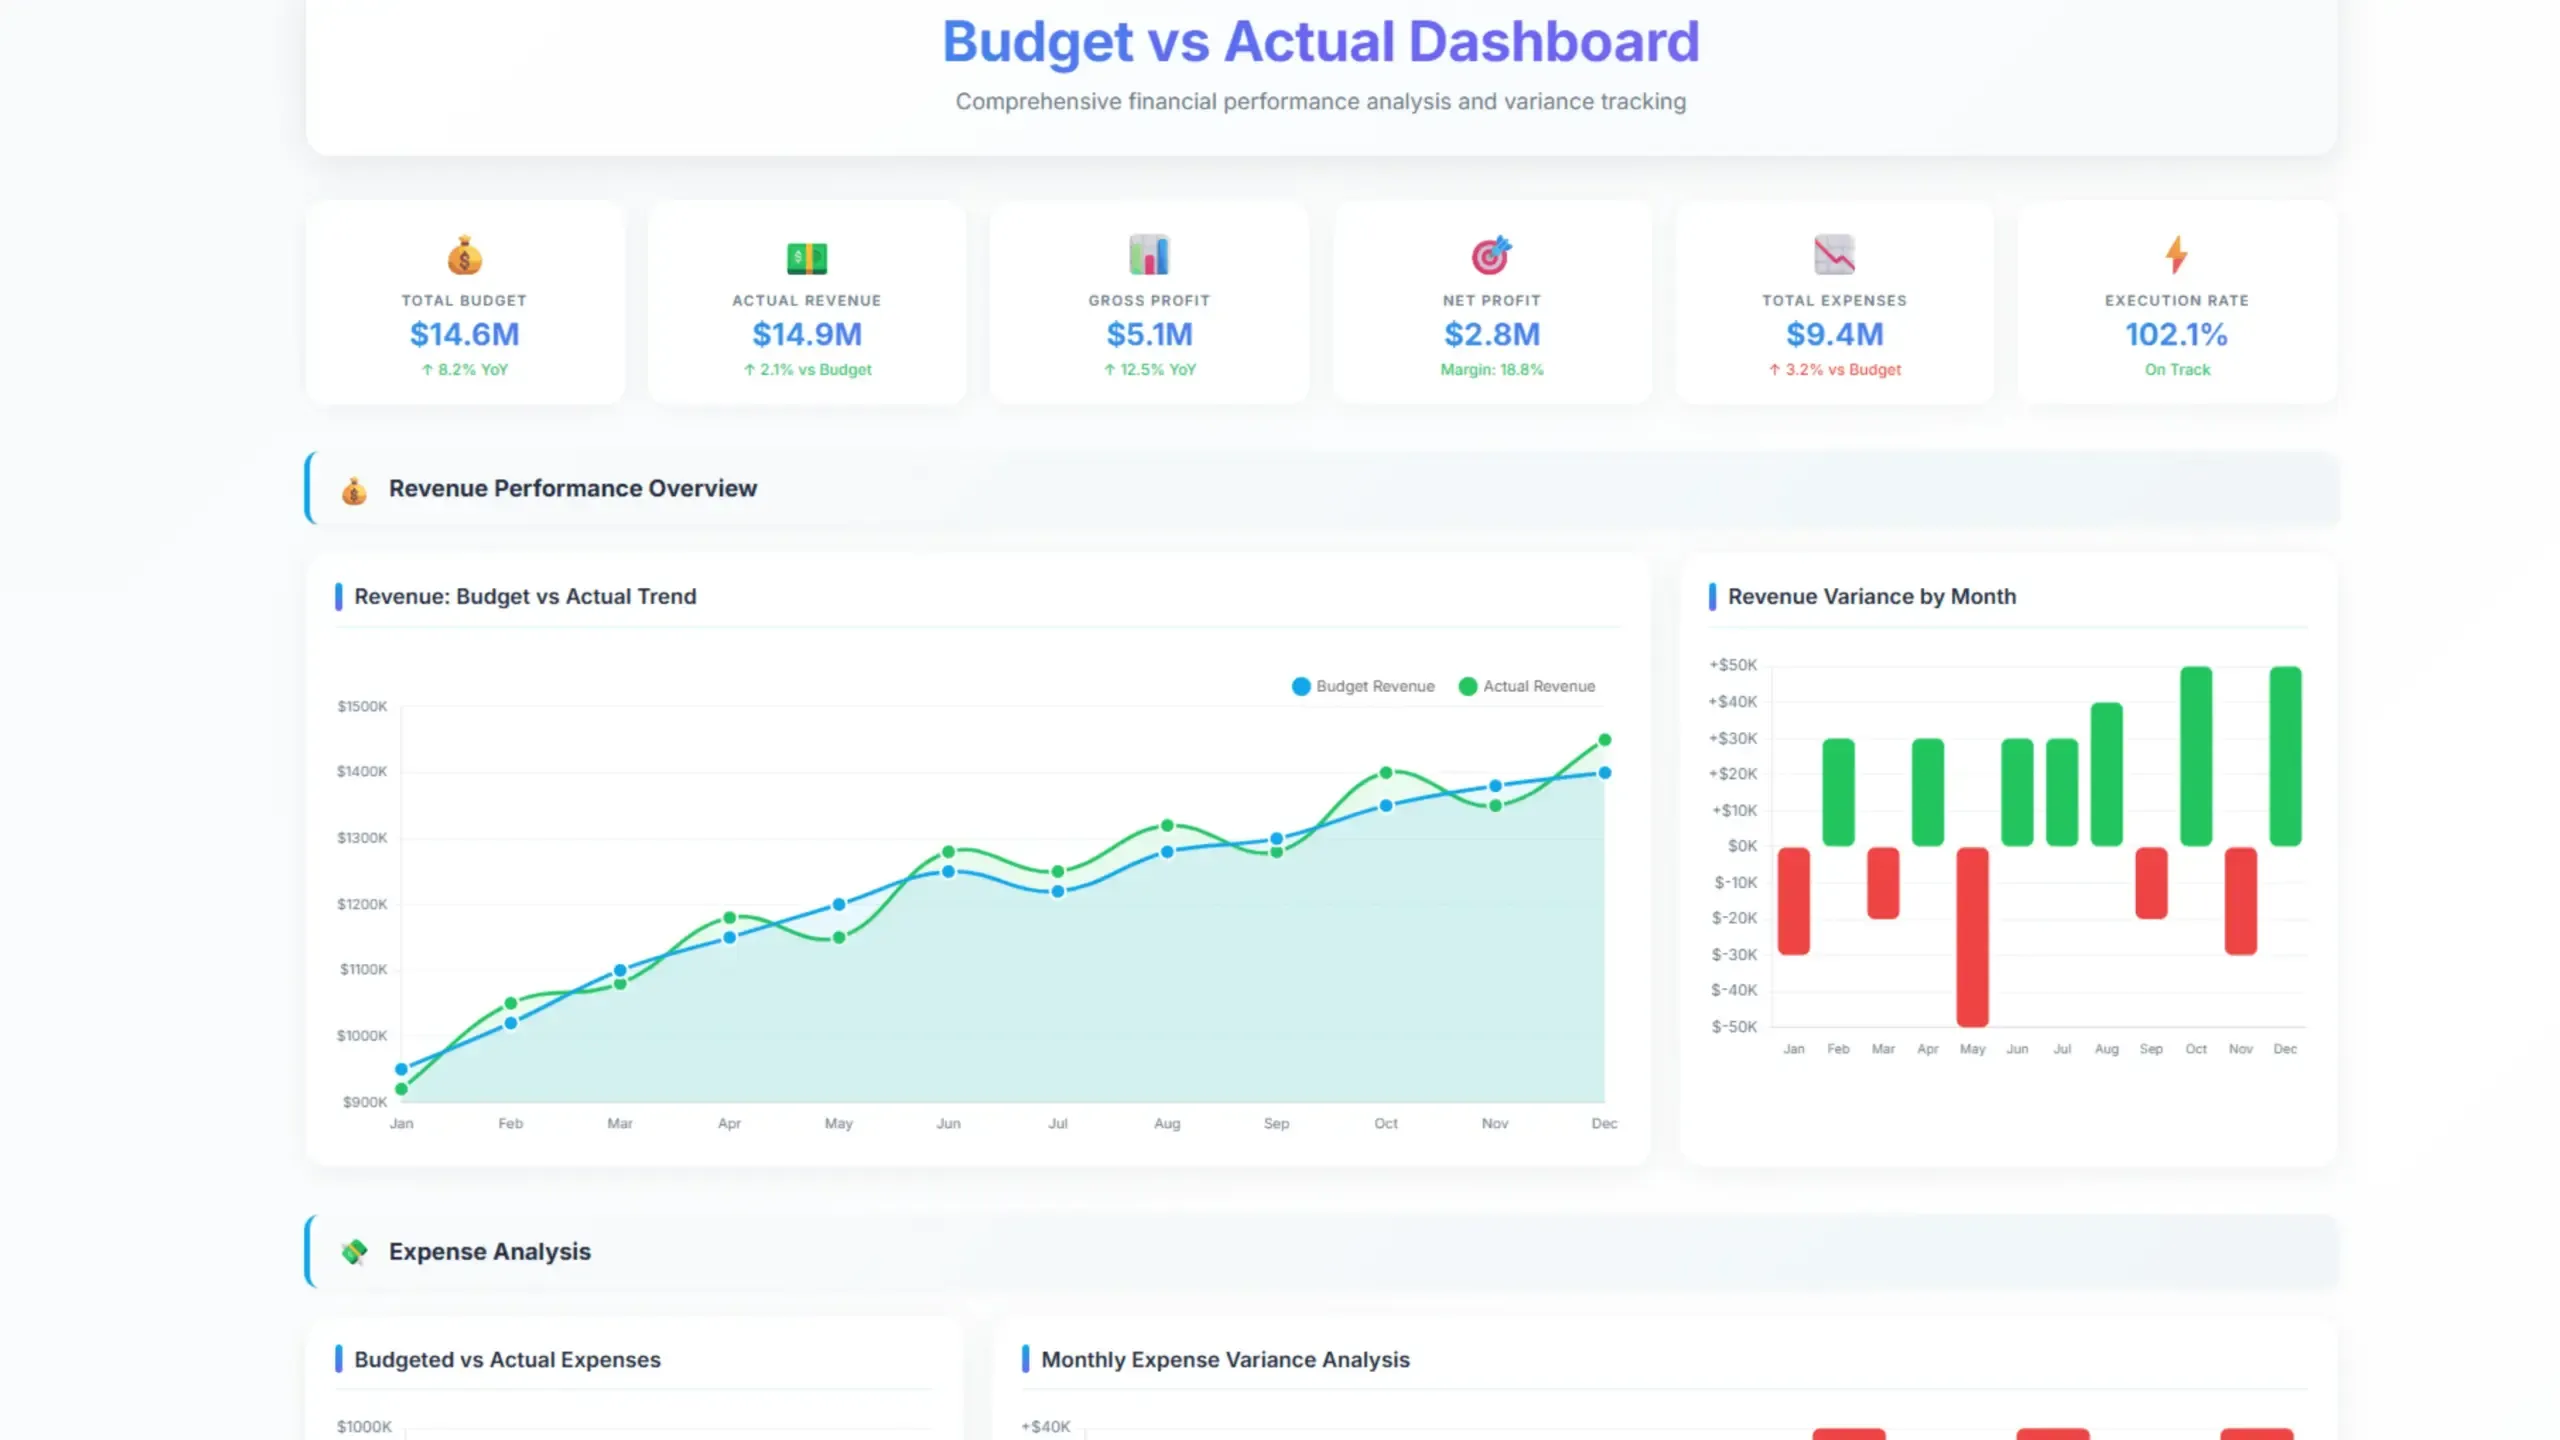
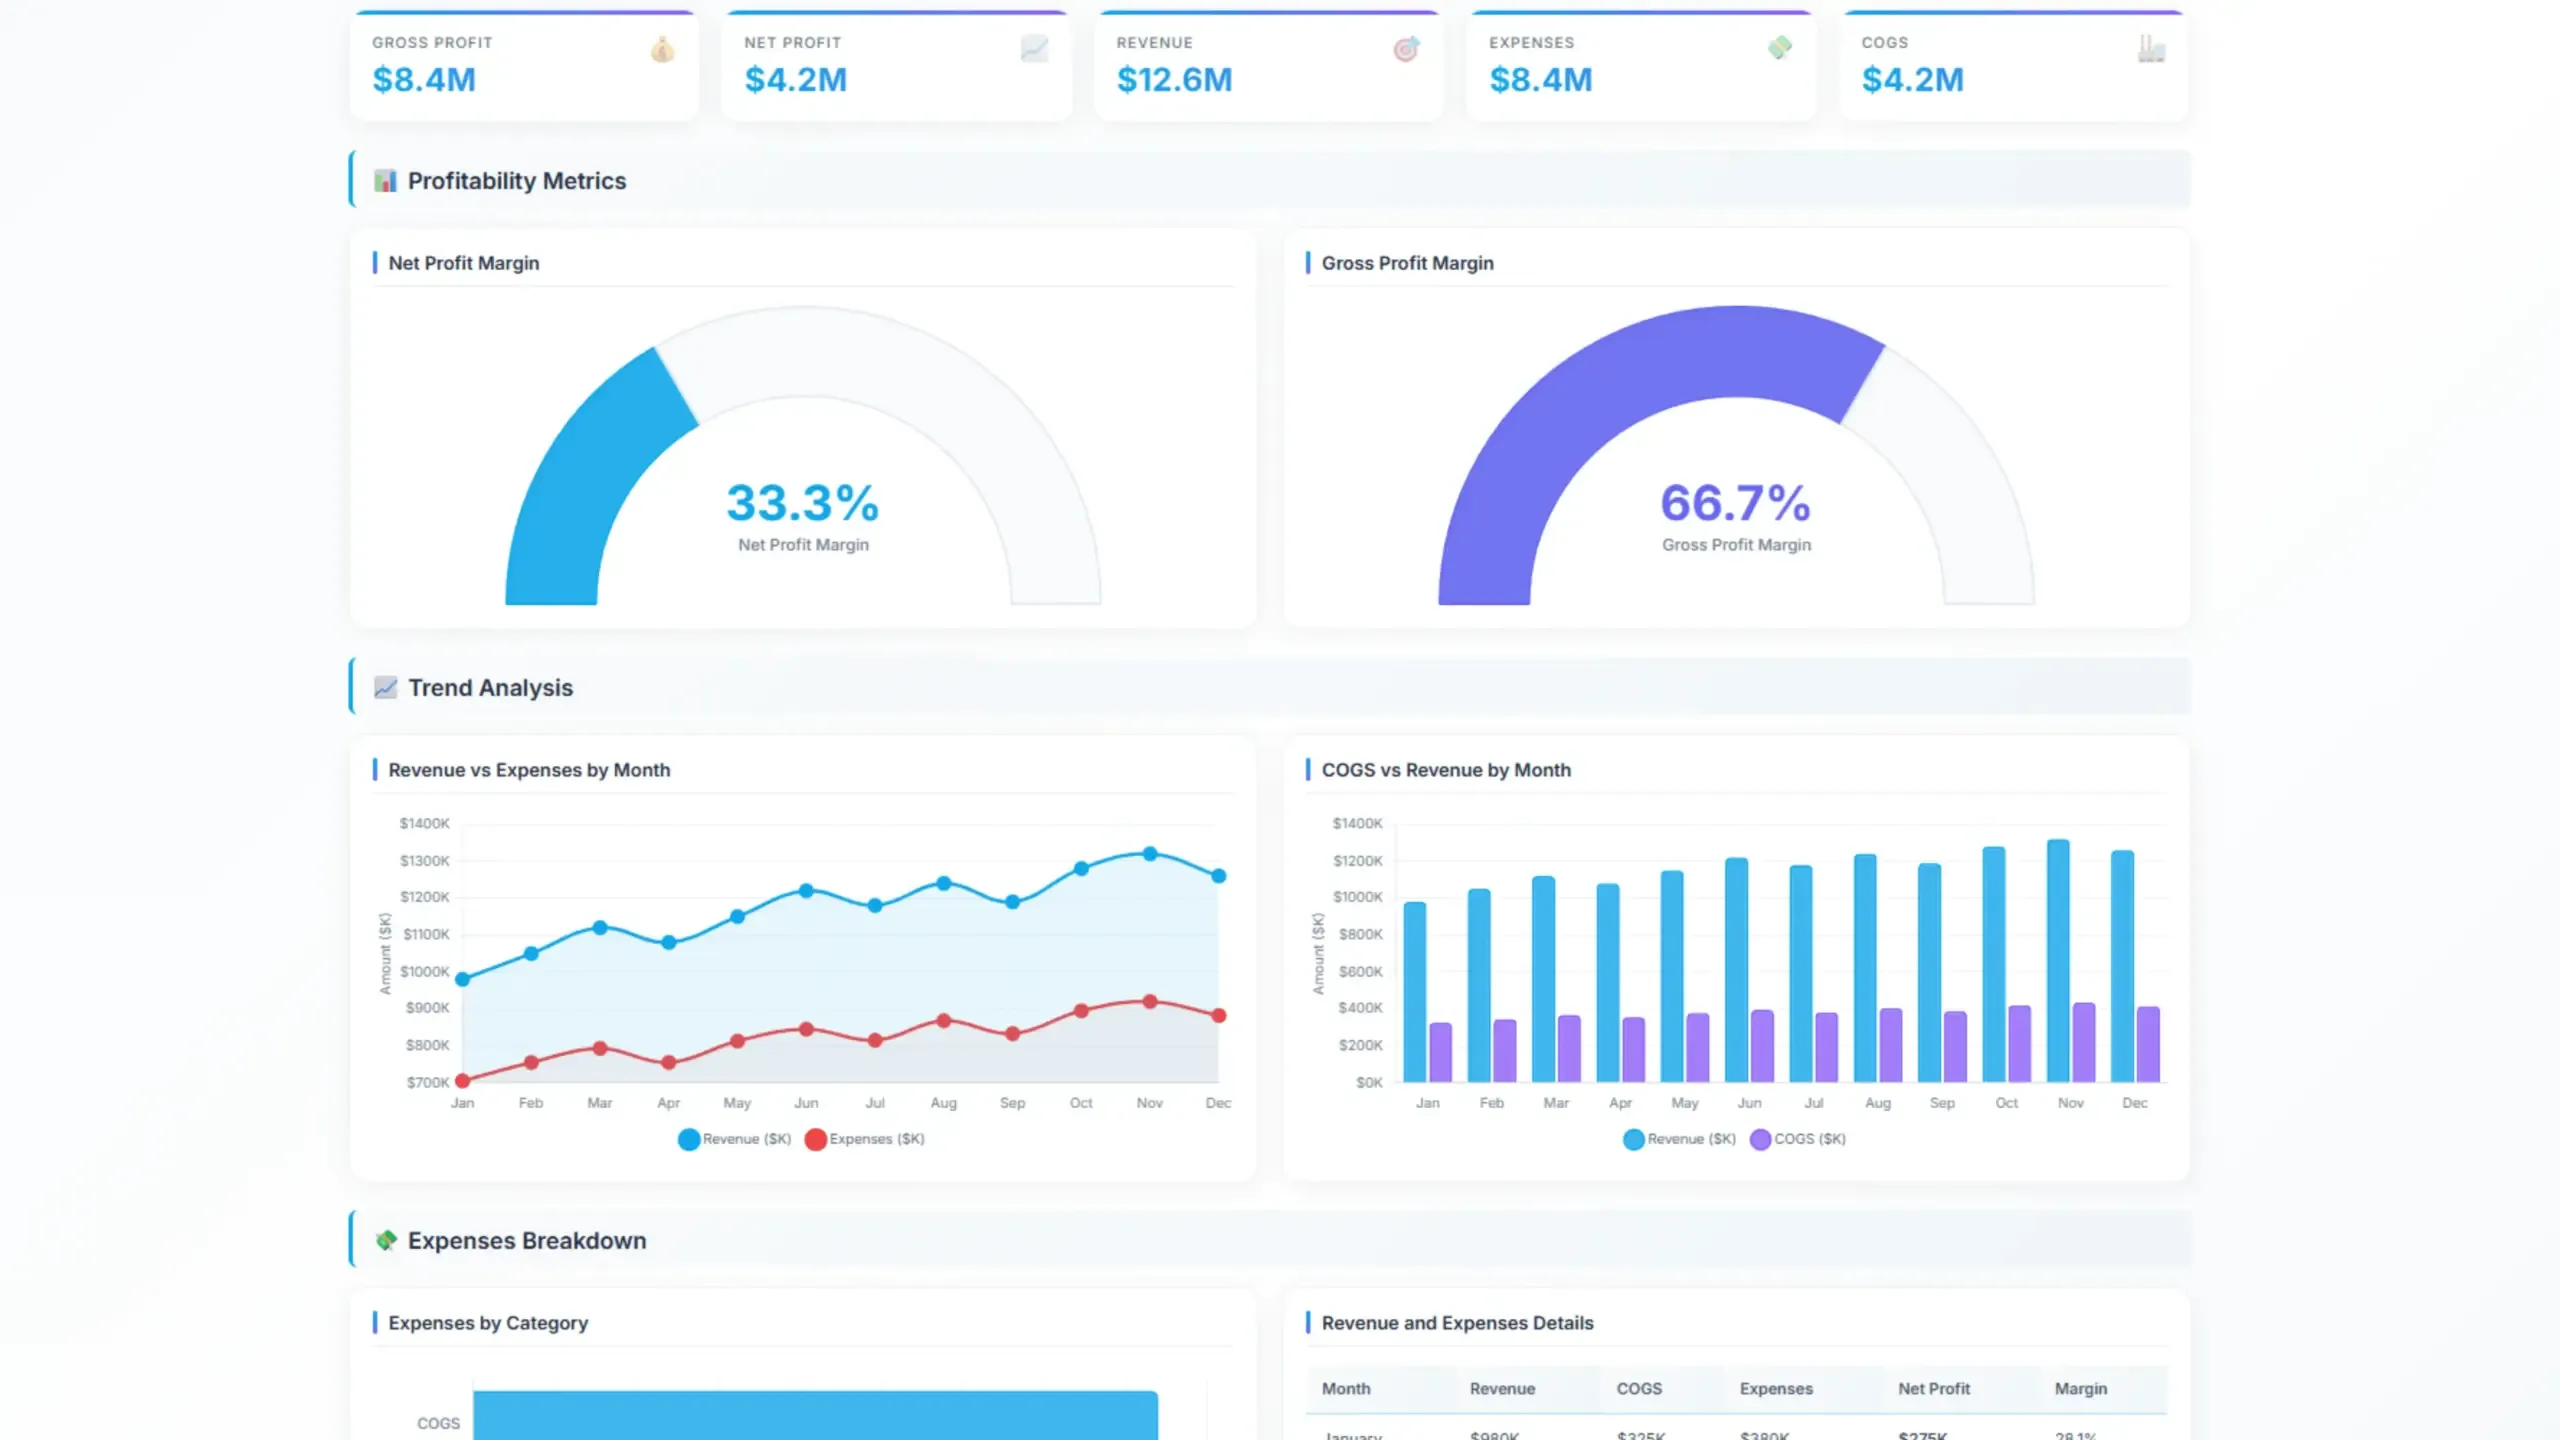
2. Management Dashboards Example For Finance
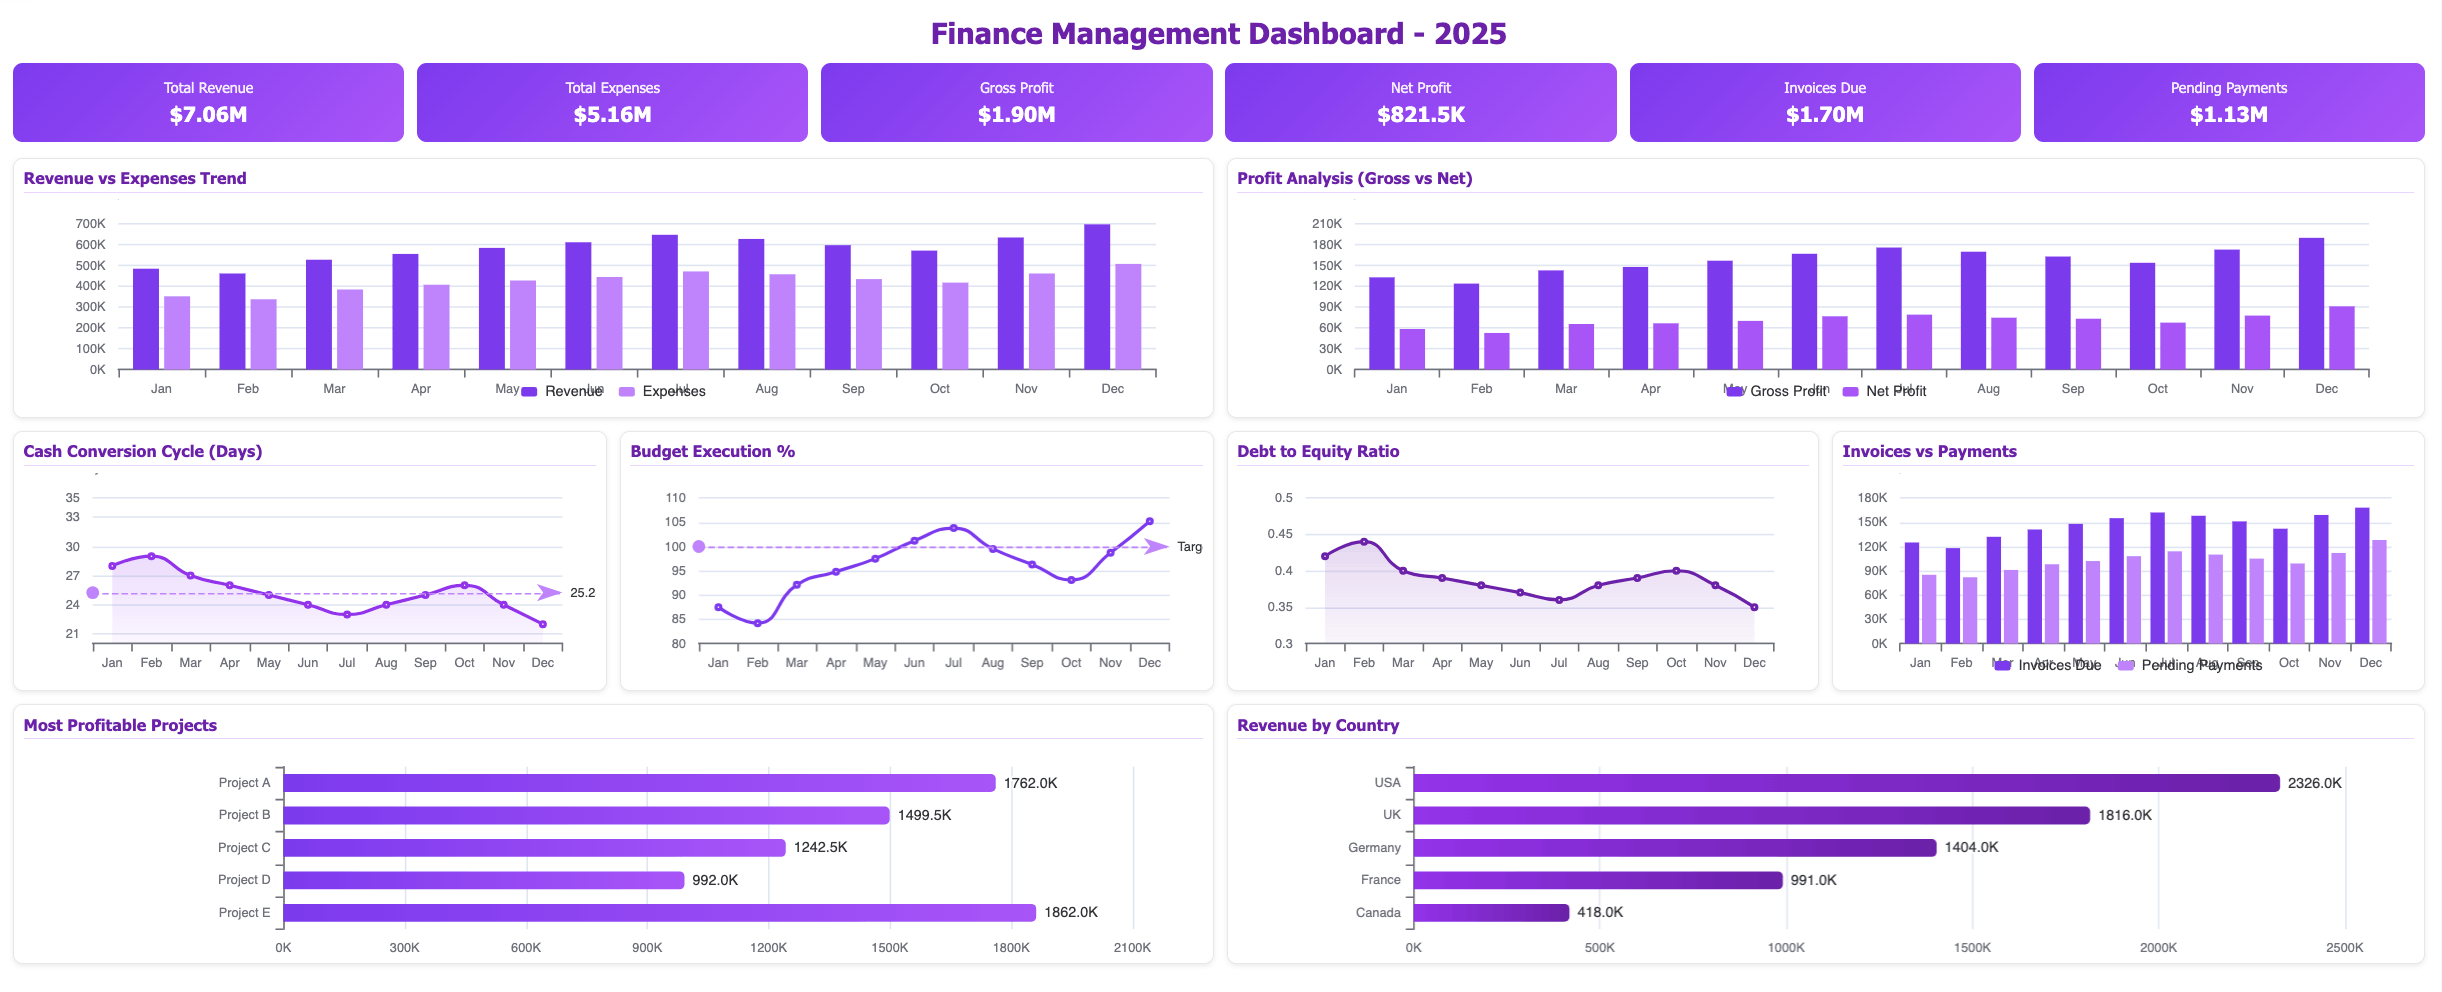
- Purpose: Provide a real-time view of a company’s financial performance.
- Key metrics: Revenue, expenses, profit margins, cash flow, and debt levels. Explore other more than 20 financial KPIs.
- Example: A CFO might use a financial dashboard to monitor revenue growth, cost trends, and financial ratios.
3. Marketing Management Dashboard Example
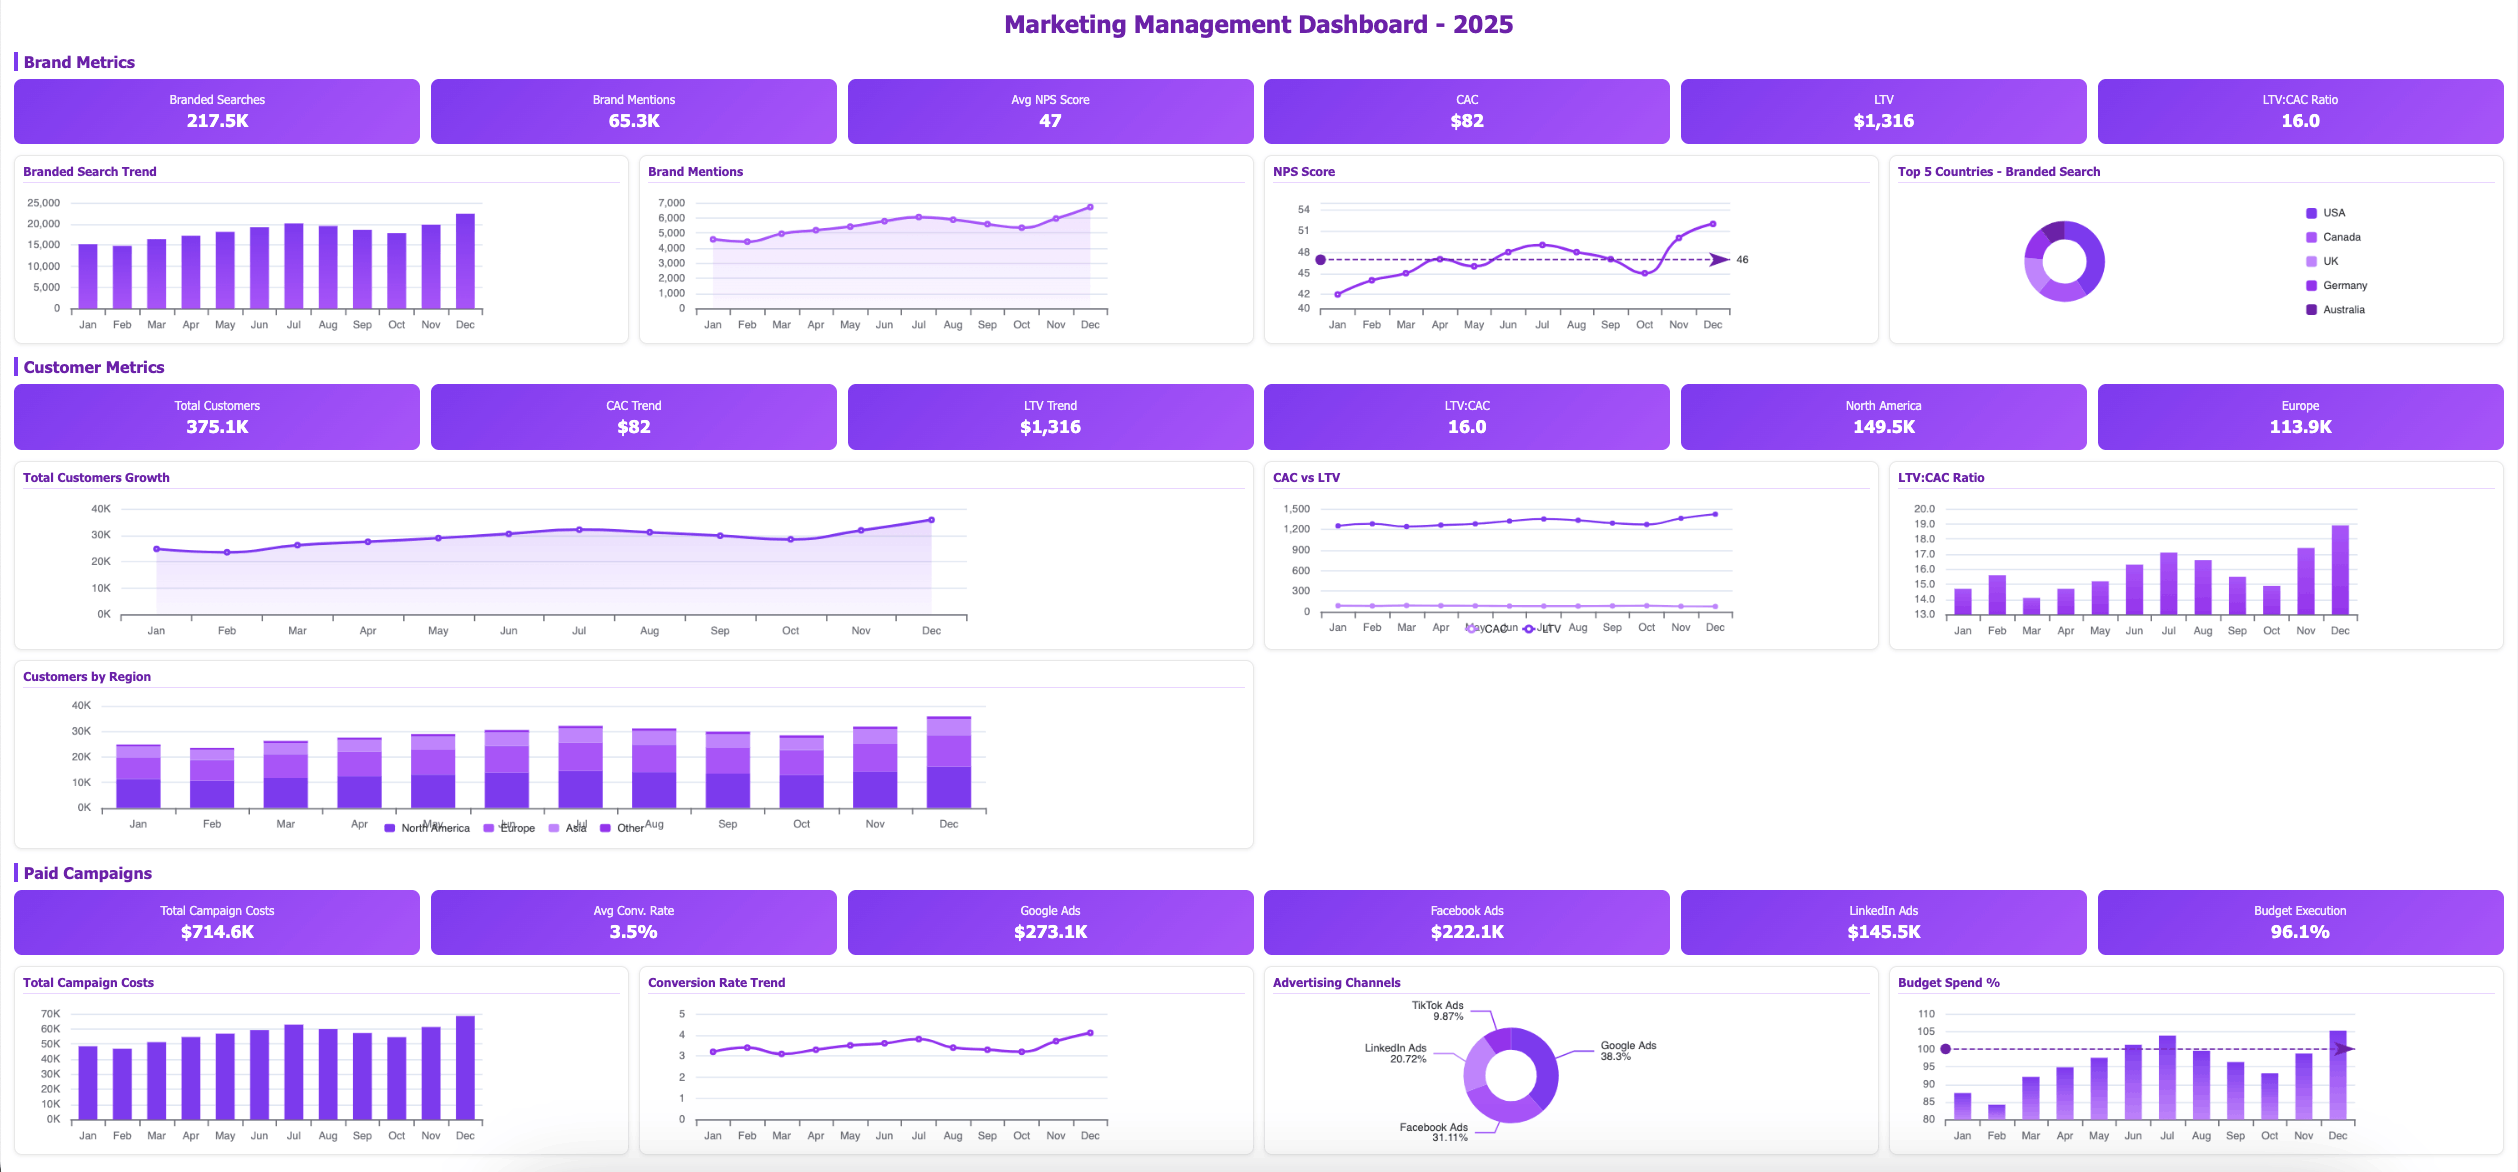
- Purpose: Track marketing campaigns, customer acquisition, and brand awareness.
- Key metrics: Website traffic, social media engagement, lead generation, conversion rates, and customer lifetime value.
- Example: A marketing manager might use a dashboard to analyze the performance of email marketing campaigns, track website traffic, and measure social media reach.
4. Sales Dashboard Example For Management
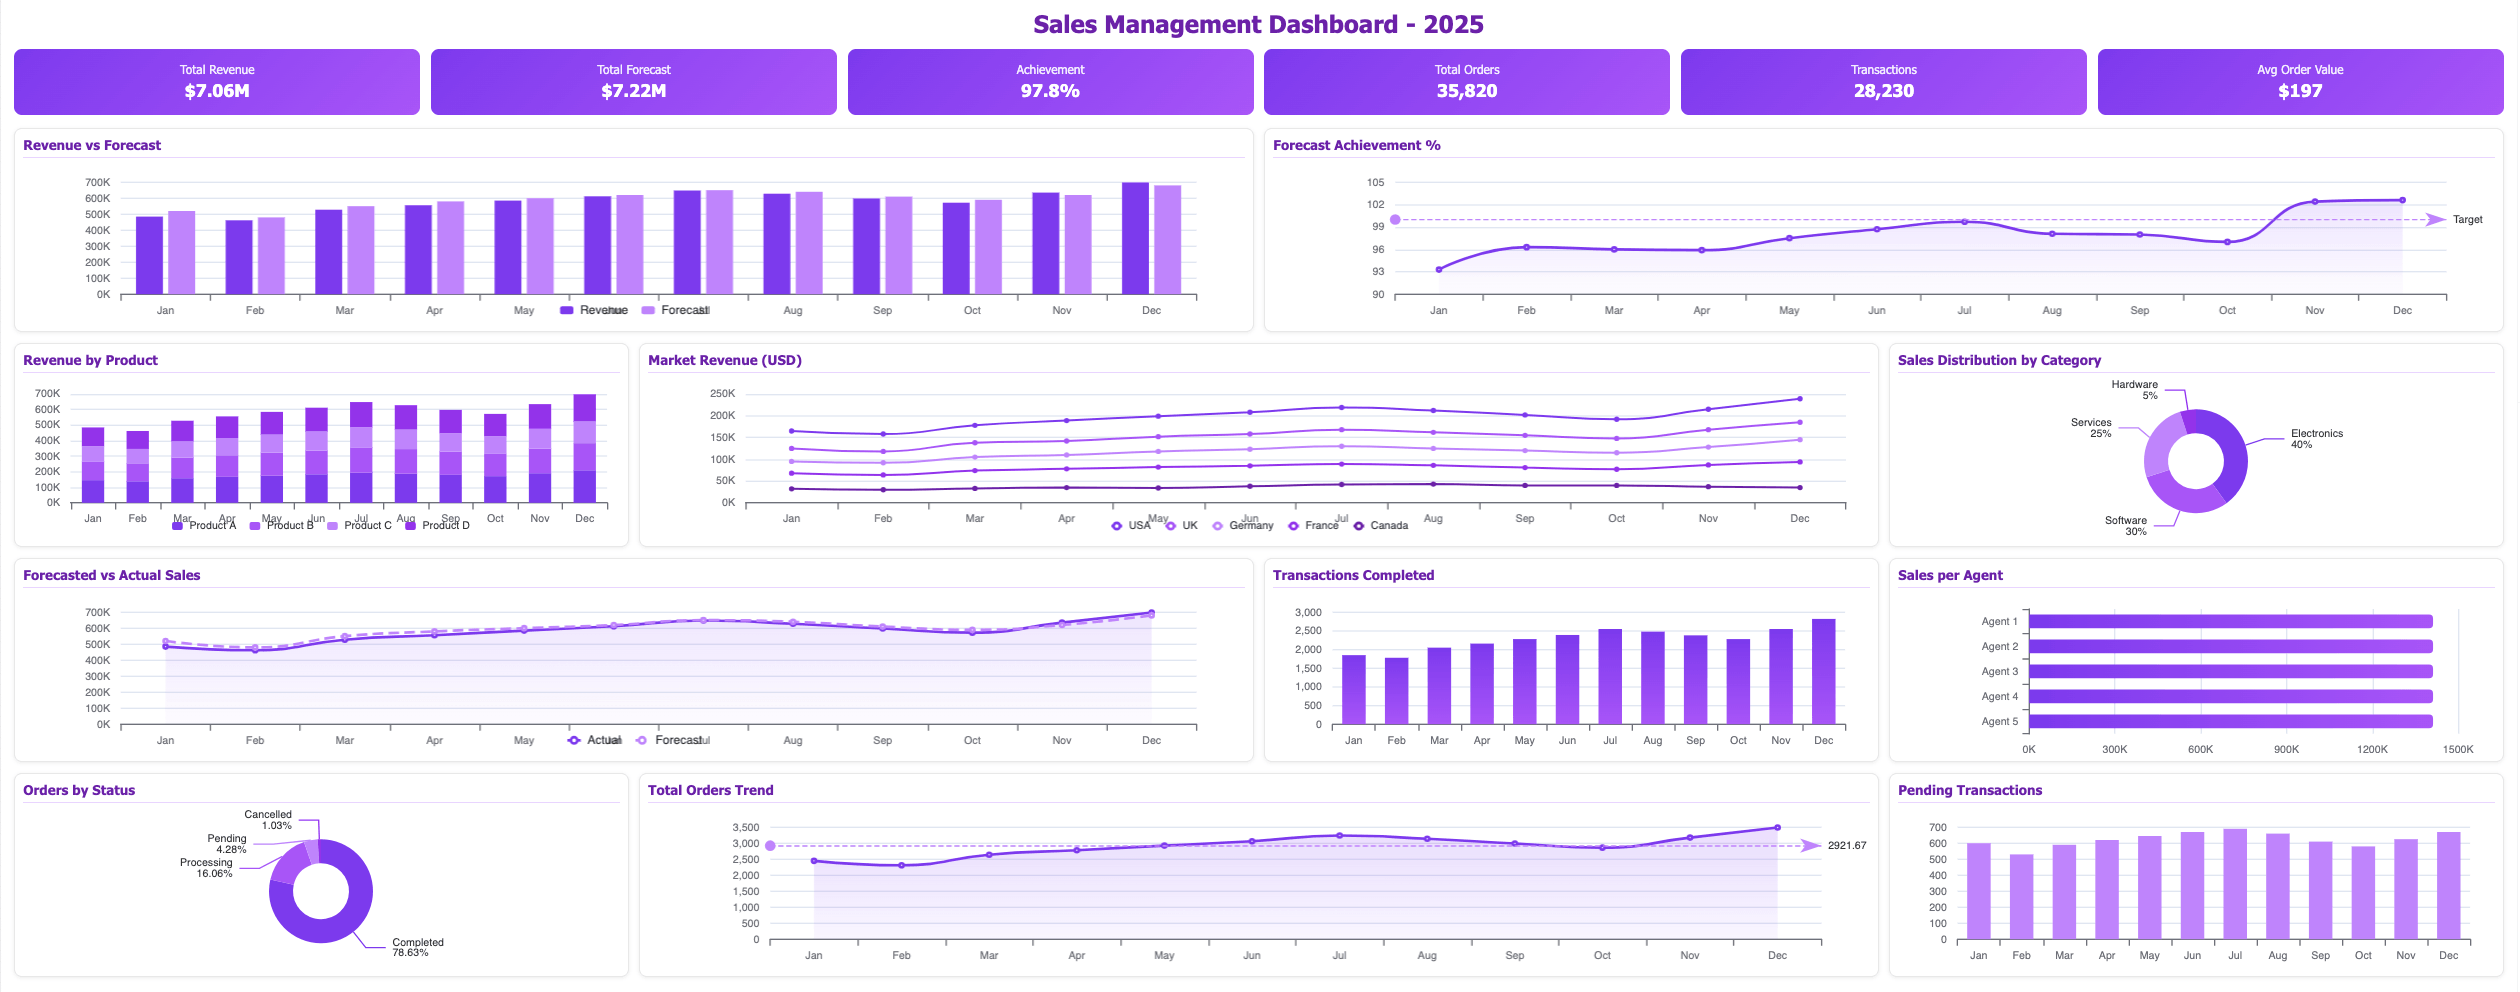
- Purpose: Monitor sales performance, track sales pipelines, and identify growth opportunities.
- Key metrics: Sales revenue, sales quotas, customer acquisition costs, average deal size, and win rates.
- Example: A sales manager might use a dashboard to track sales team performance, monitor sales pipeline stages, and identify potential revenue leaks.
5. Human Resources Dashboard Example
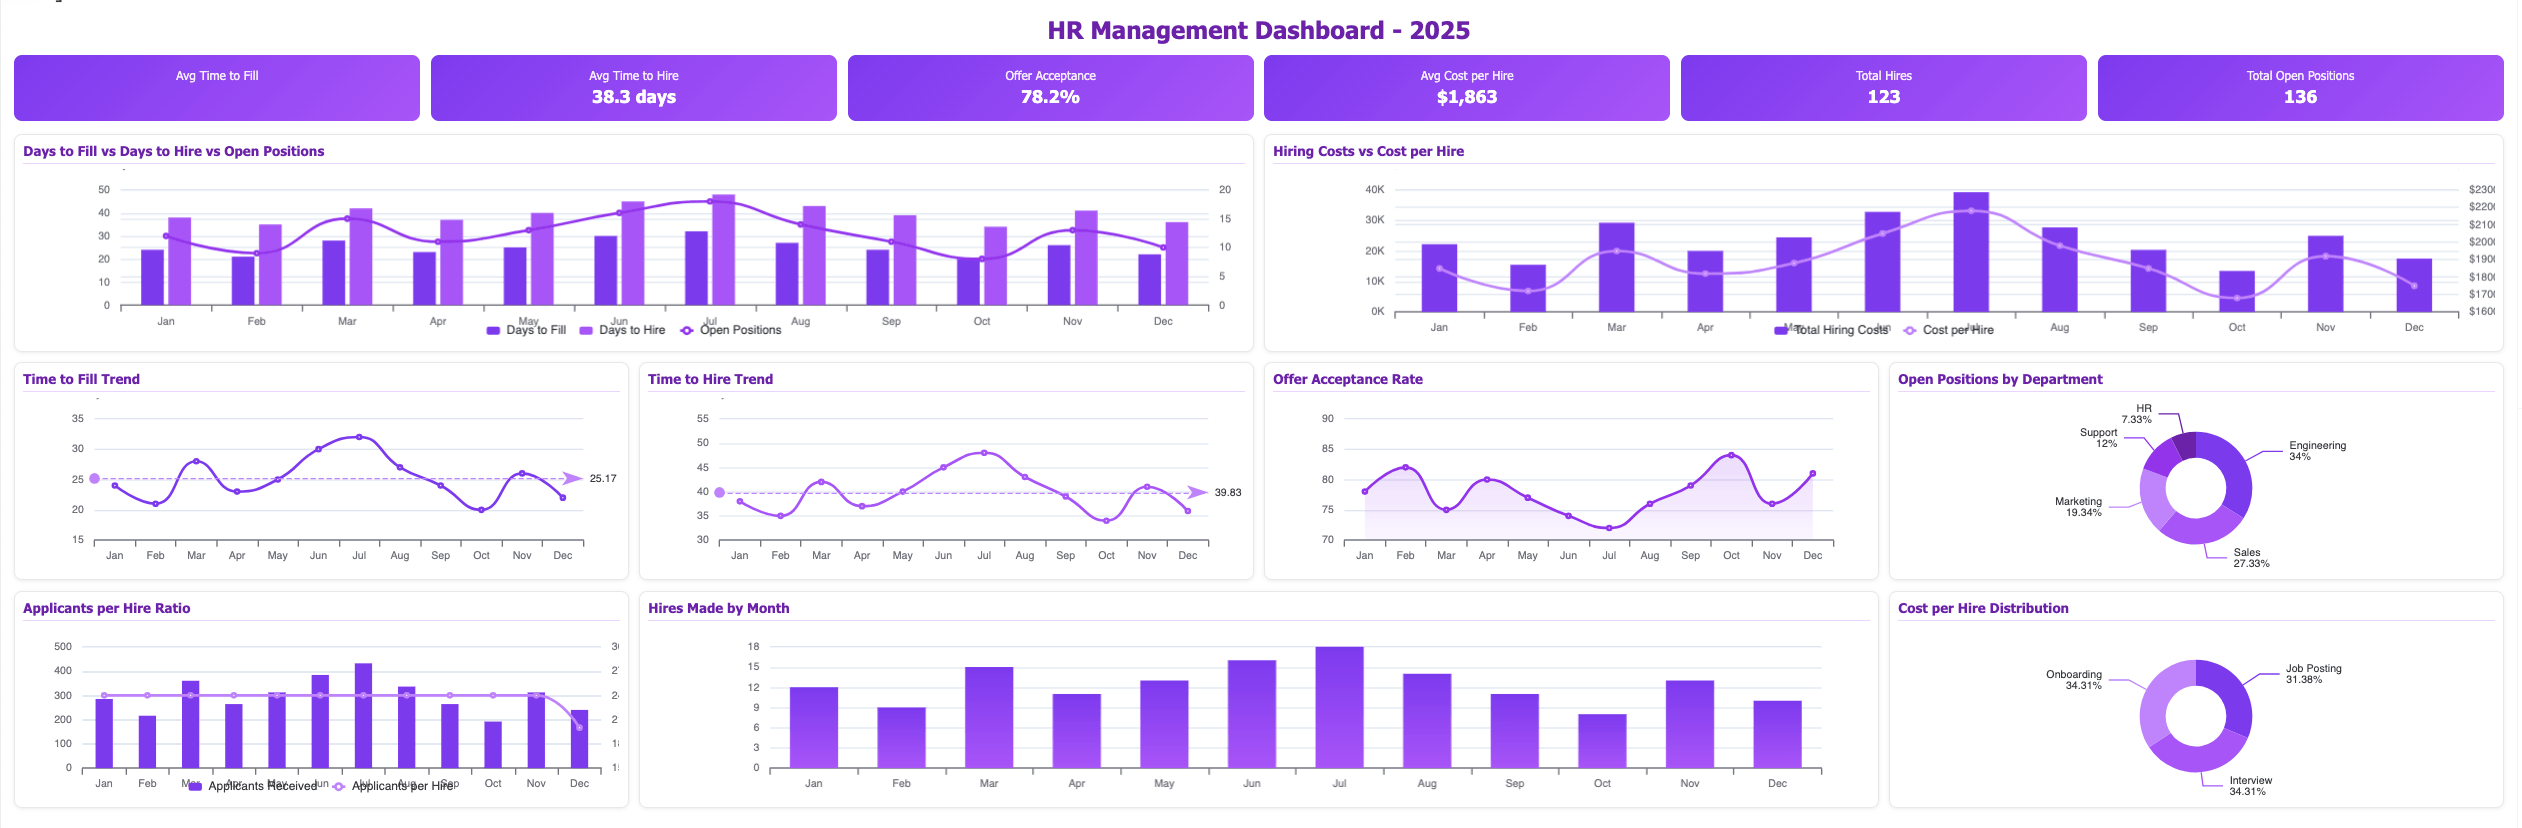
- Purpose: Track employee performance, recruitment efforts, and talent management initiatives.
- Key metrics: Employee turnover, time to fill vacancies, employee satisfaction, training completion rates, and diversity and inclusion metrics. Explore other HR metrics here.
- Example: An HR manager might use a dashboard to monitor employee satisfaction, track recruitment metrics, and analyze training effectiveness.
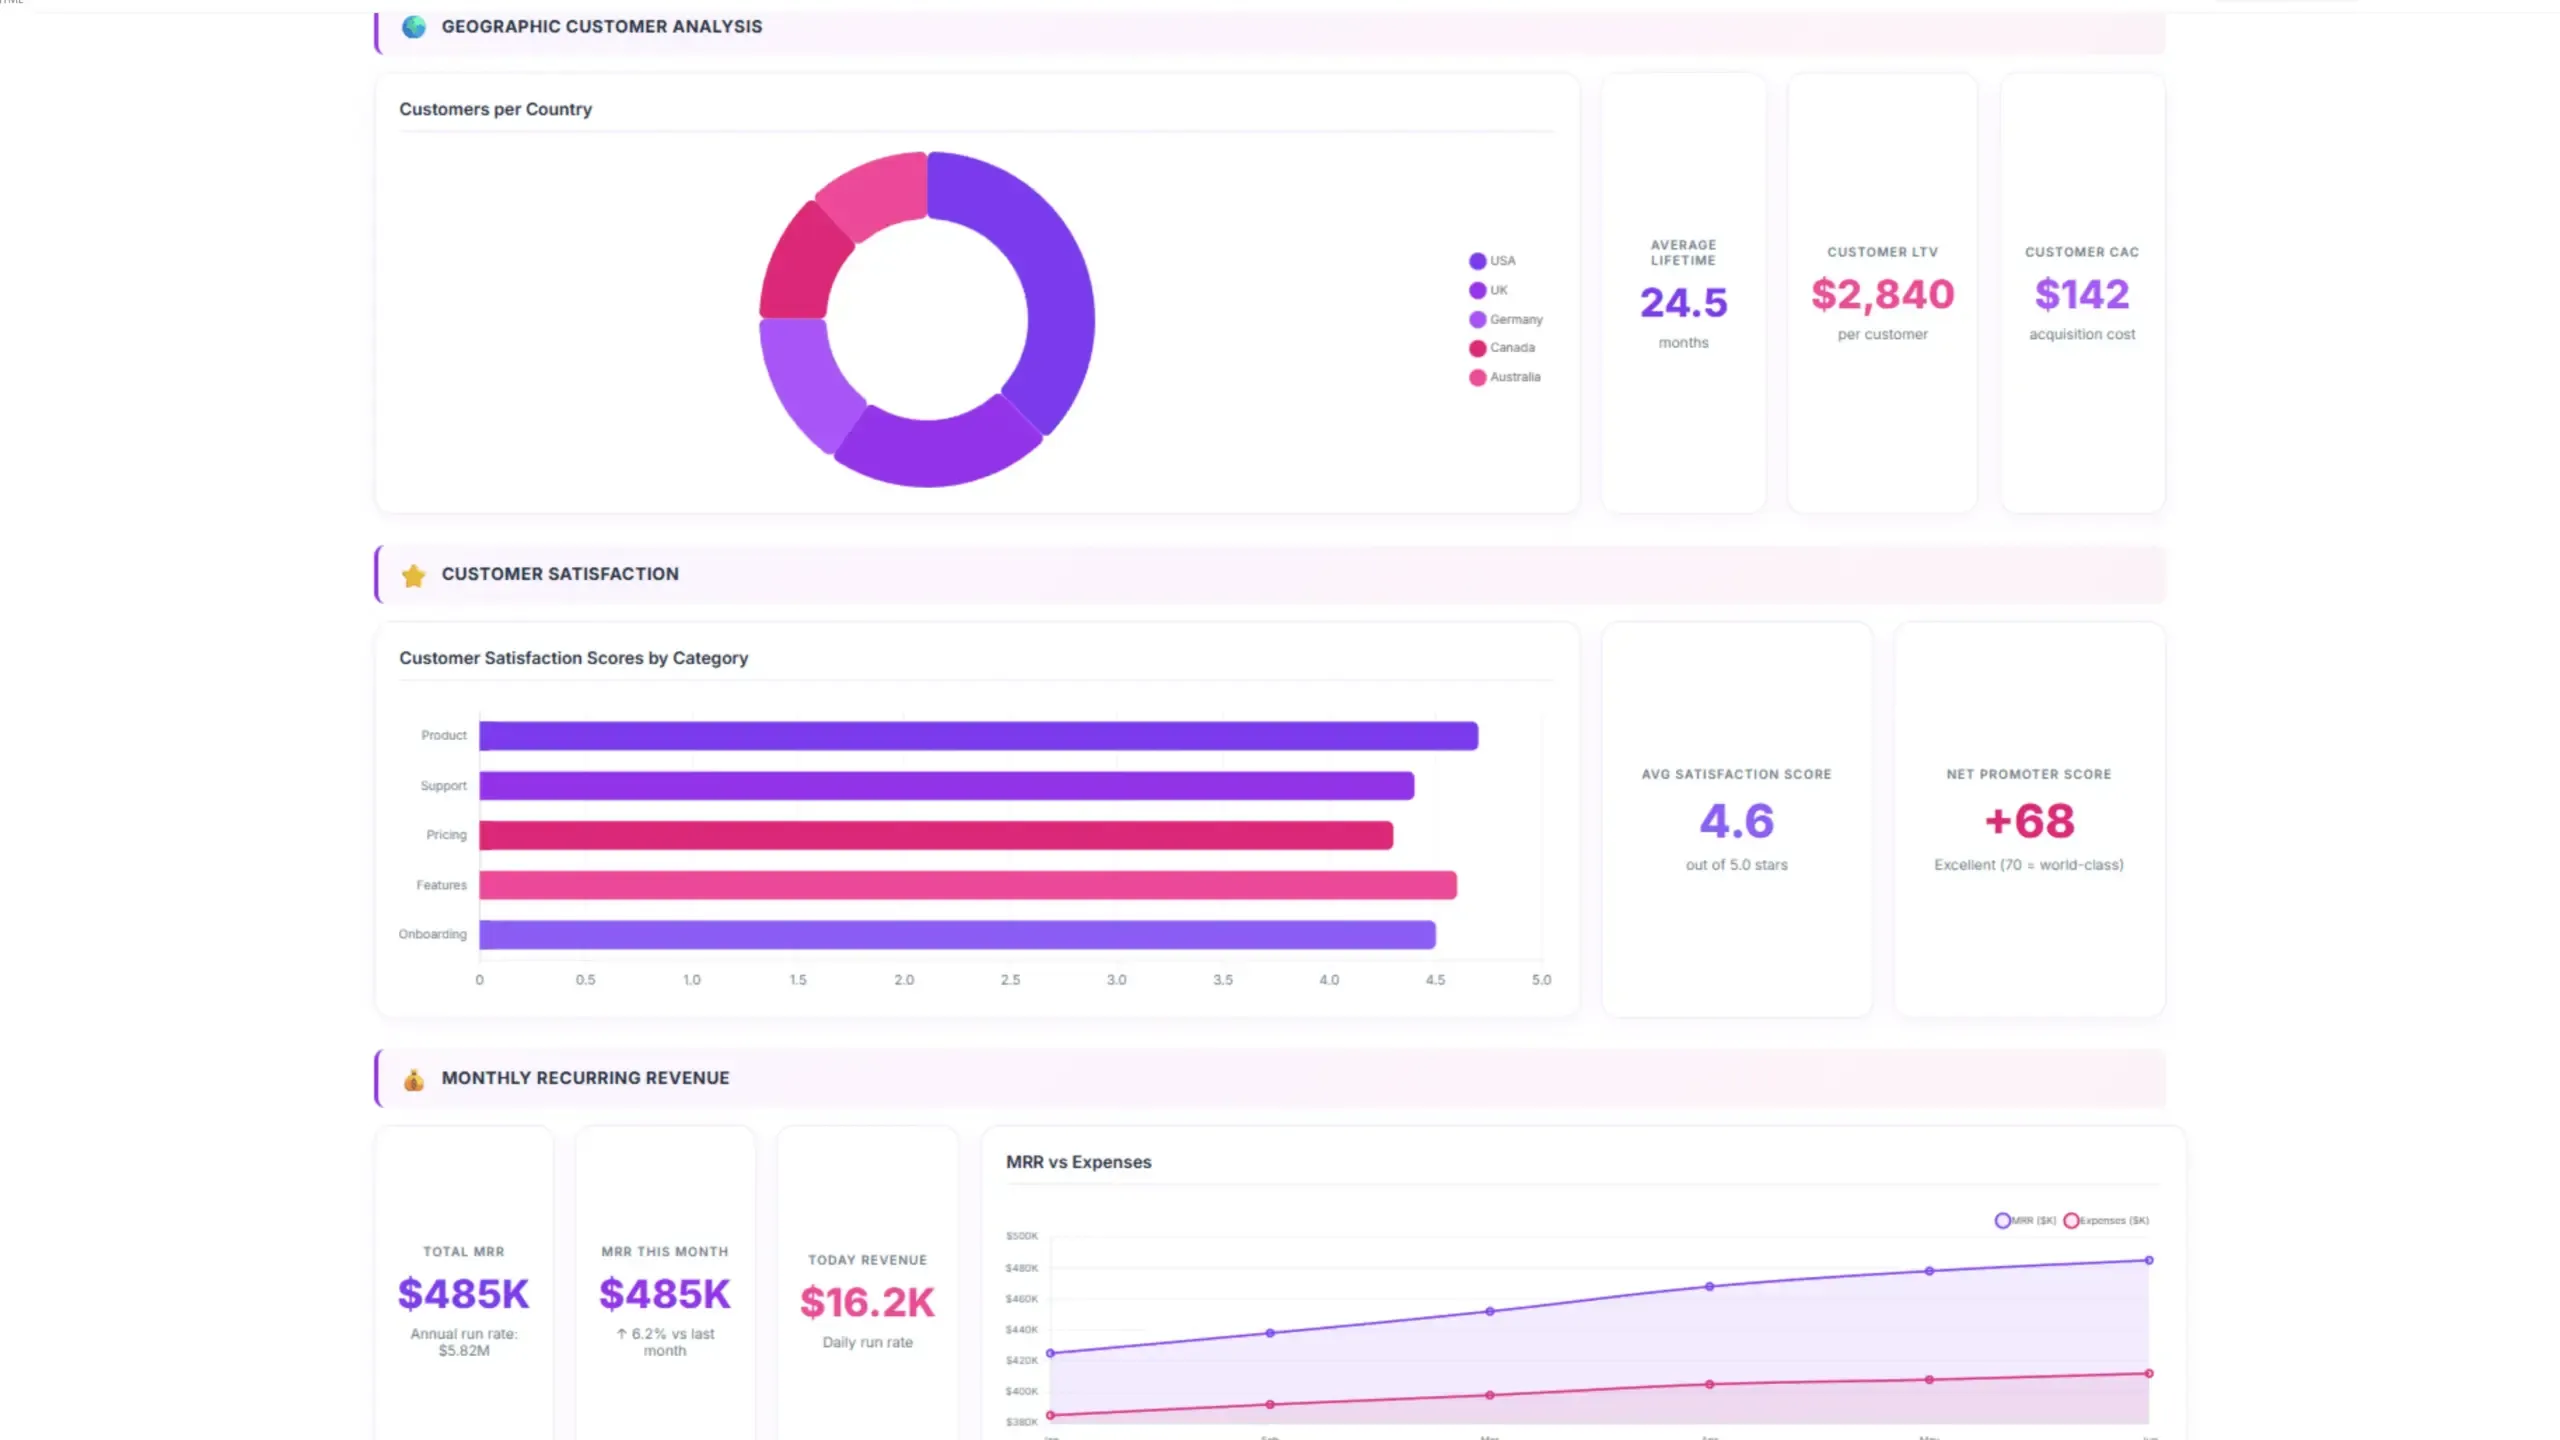
6. Customer Service Dashboards
- Purpose: Measure customer satisfaction, track customer support inquiries, and identify areas for improvement.
- Key metrics: Customer satisfaction ratings, first-call resolution rates, average response times, and customer churn.
- Example: A customer service manager might use a dashboard to track customer support ticket volume, measure first-call resolution rates, and analyze customer feedback.
7. Executive Dashboards
- Purpose: Provide a high-level overview of an organization’s overall performance.
- Key metrics: Revenue, profit, market share, customer satisfaction, employee satisfaction, and financial ratios.
- Example: A CEO might use an executive dashboard to monitor key performance indicators, identify trends, and make strategic decisions.
5 Tools for Dashboard Creation
1. Ajelix AI agent
- Key features: Agentic AI chat, Google Workspace integration.
- Strengths: Easy-to-use tool that creates finished projects from a simple prompt.
2. Tableau
- Key features: A powerful data visualization tool that offers a drag-and-drop interface for creating interactive dashboards and charts.
- Strengths: Extensive data visualization options, strong integration with other data sources, and a large active community.
3. Power BI
- Key features: A Microsoft product that provides a comprehensive business intelligence solution, including dashboard creation, data modeling, and reporting.
- Strengths: Tight integration with Microsoft products, robust data modeling capabilities, and a wide range of visualization options.
4. Qlik Sense
- Key features: A self-service business intelligence platform that allows users to explore data and create interactive dashboards.
- Strengths: Associative data analysis capabilities, powerful visualization options, and seamless integration with various data sources.
5. Zoho Analytics
- Key features: A cloud-based business intelligence platform that offers a range of features, including dashboard creation, data visualization, and data analysis.
- Strengths: Affordable pricing, easy-to-use interface, and integration with other Zoho products.
Reporting gives you a headache?
Upload your data and create professional reports with agentic AI

Start free
Try free and upgrade whenever
Explore other dashboards


Ready to create your dashboard?