Online Accounting Dashboard Examples For Accountants
An accounting dashboard is a centralized platform that tracks your business’s real-time financial performance. It presents key financial metrics and data in a visually appealing and easy-to-understand format.
Think of it as a real-time financial snapshot, highlighting trends, anomalies, and opportunities. It’s less about the raw data and more about turning numbers into actionable insights.
What is an accounting dashboard?
An accounting dashboard is a dynamic, visual representation of your financial health. It’s a consolidated view of key financial metrics that provides actionable insights at a glance.
Key Features and Benefits
- Real-time data: Access up-to-date financial information.
- Key Performance Indicators (KPIs): Focus on critical metrics like revenue, expenses, profit, cash flow, and more.
- Visualizations: Use charts, graphs, and tables to quickly understand trends and patterns.
- Customization: Tailor the dashboard to your specific needs and preferences.
- Improved decision-making: Make informed financial decisions based on data-driven insights.
Common Components of an Accounting Dashboard
- Income statement summary: Revenue, expenses, and net profit.
- Balance sheet highlights: Assets, liabilities, and equity.
- Cash flow overview: Incoming and outgoing cash.
- Accounts receivable/payable status: Outstanding invoices and payments.
- Key financial ratios: Profitability, liquidity, and solvency ratios.
In essence, an accounting dashboard is a powerful tool that helps you monitor your financial health, identify trends, and make data-driven decisions to improve your business performance.
7 Types of Accounting Dashboards
Accounting dashboards can be categorized based on their focus, level of detail, or the specific user they are designed for. Here are some common types:
- Financial Performance Dashboard
- Cash Flow Dashboard
- Profit and Loss Dashboard
- Balance Sheet Dashboard
- Budget vs. Actual Dashboard
- CFO Dashboard
- Tax Dashboard
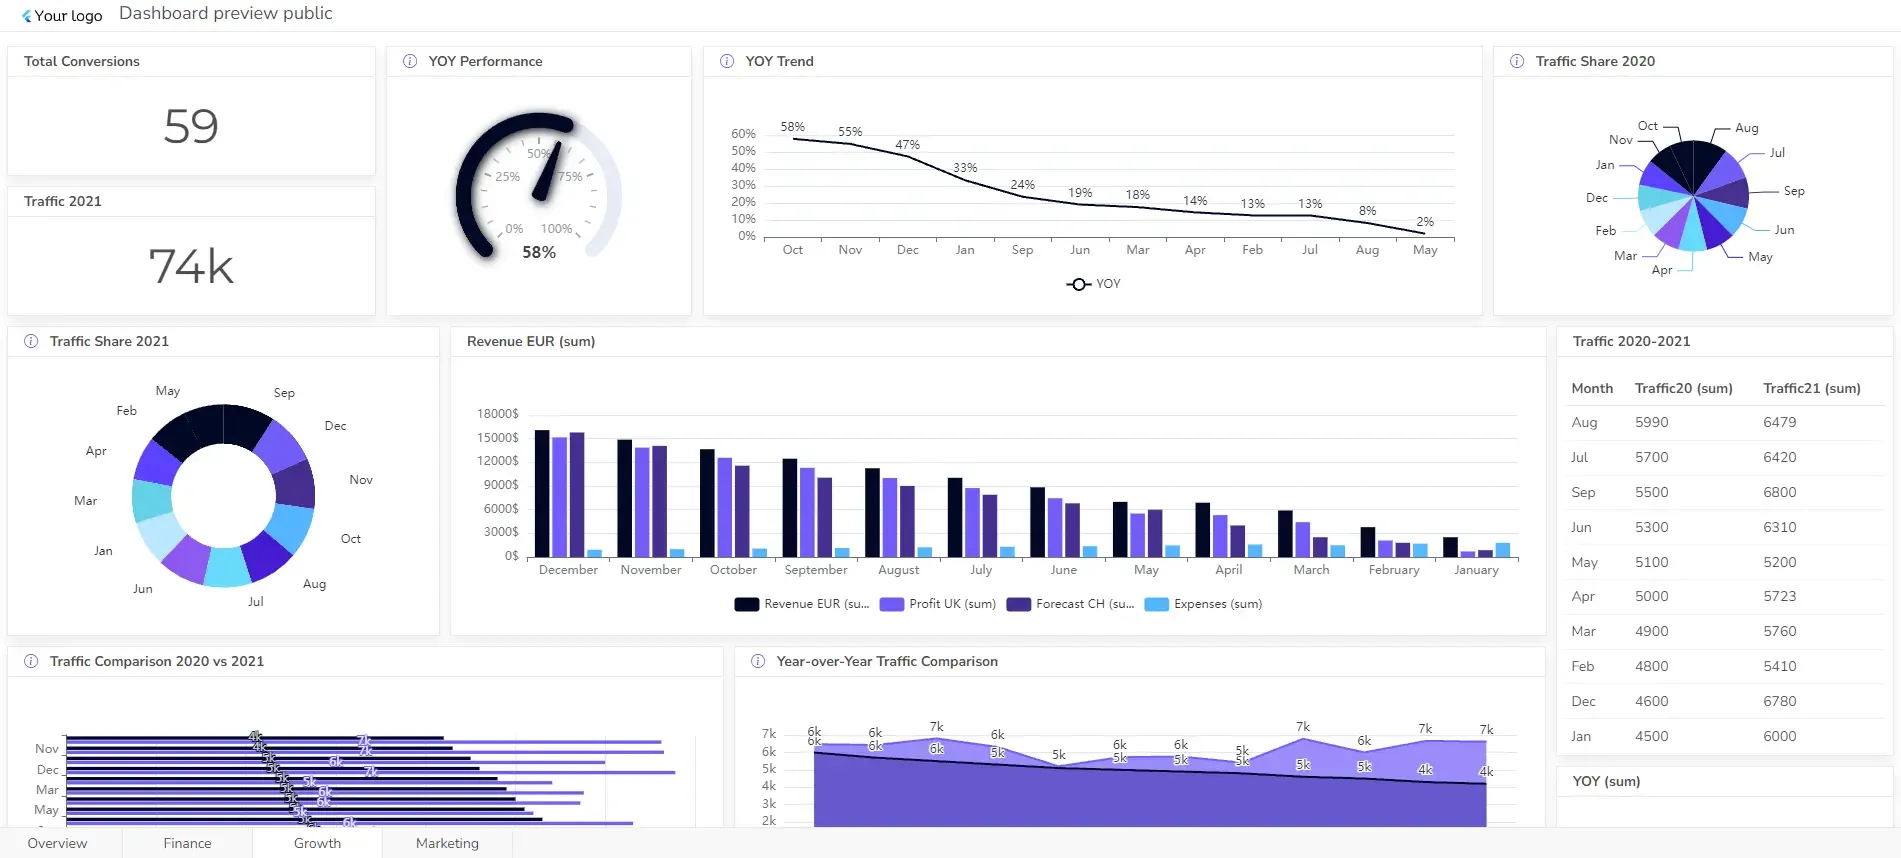
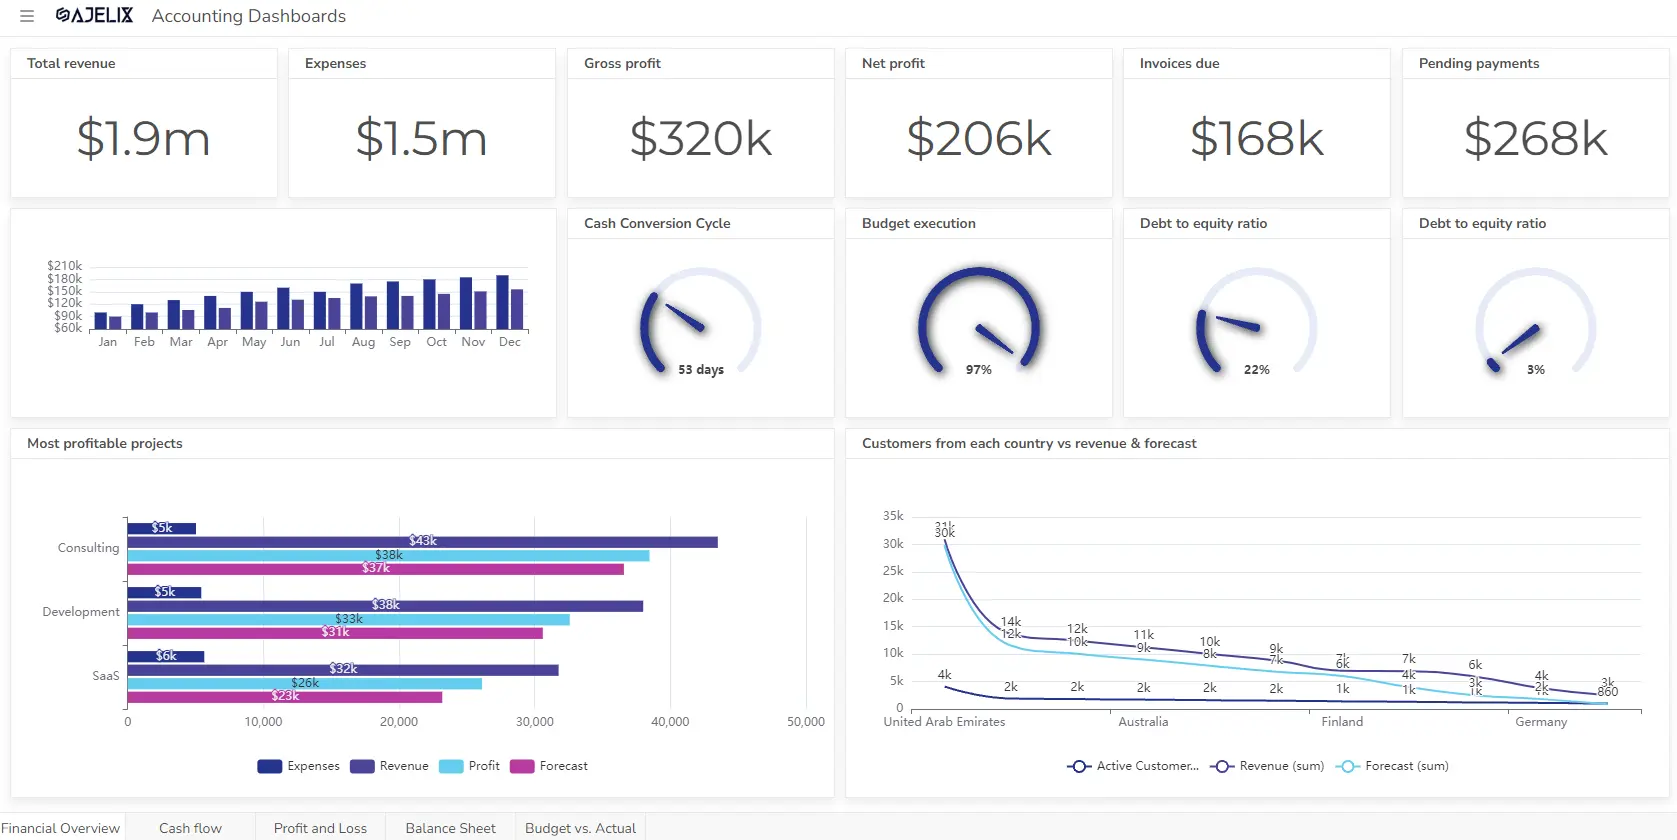
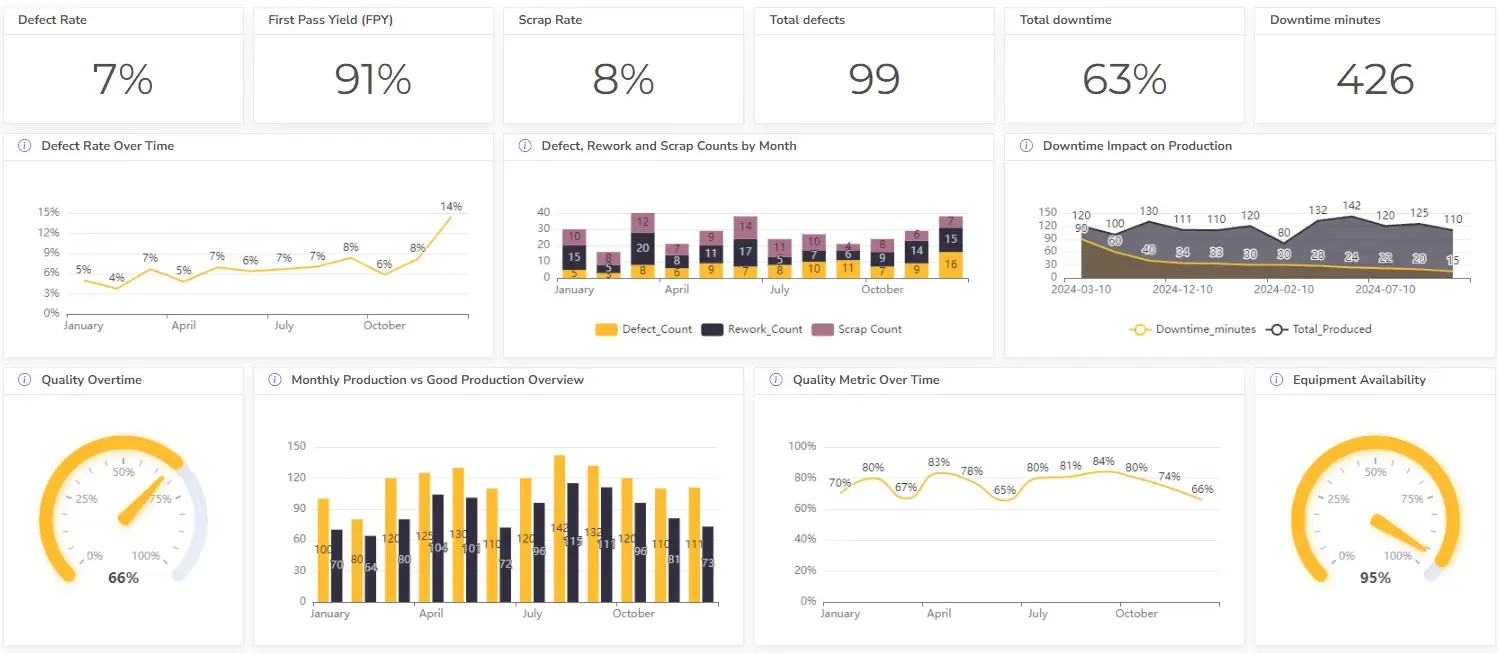
1. Financial Performance Dashboard
Provides a comprehensive overview of the company’s financial health, including key metrics like revenue, expenses, profit margin, and ROI.
The specific KPIs and metrics you include in a financial performance dashboard will depend on your organization’s size, industry, and goals. However, some core metrics are generally applicable:
KPIs & Metrics
- Profitability metrics (gross profit margin, net profit margin, ROI)
- Liquidity ratios (current ratio, quick ratio)
- Solvency ratios (debt-to-equity ratio, interest coverage ratio)
- Efficiency ratios (inventory turnover, accounts receivable turnover)
- Growth metrics (revenue growth, earnings growth)
Select from more than 20 financial KPIs to include in your dashboard.
Dashboard Example
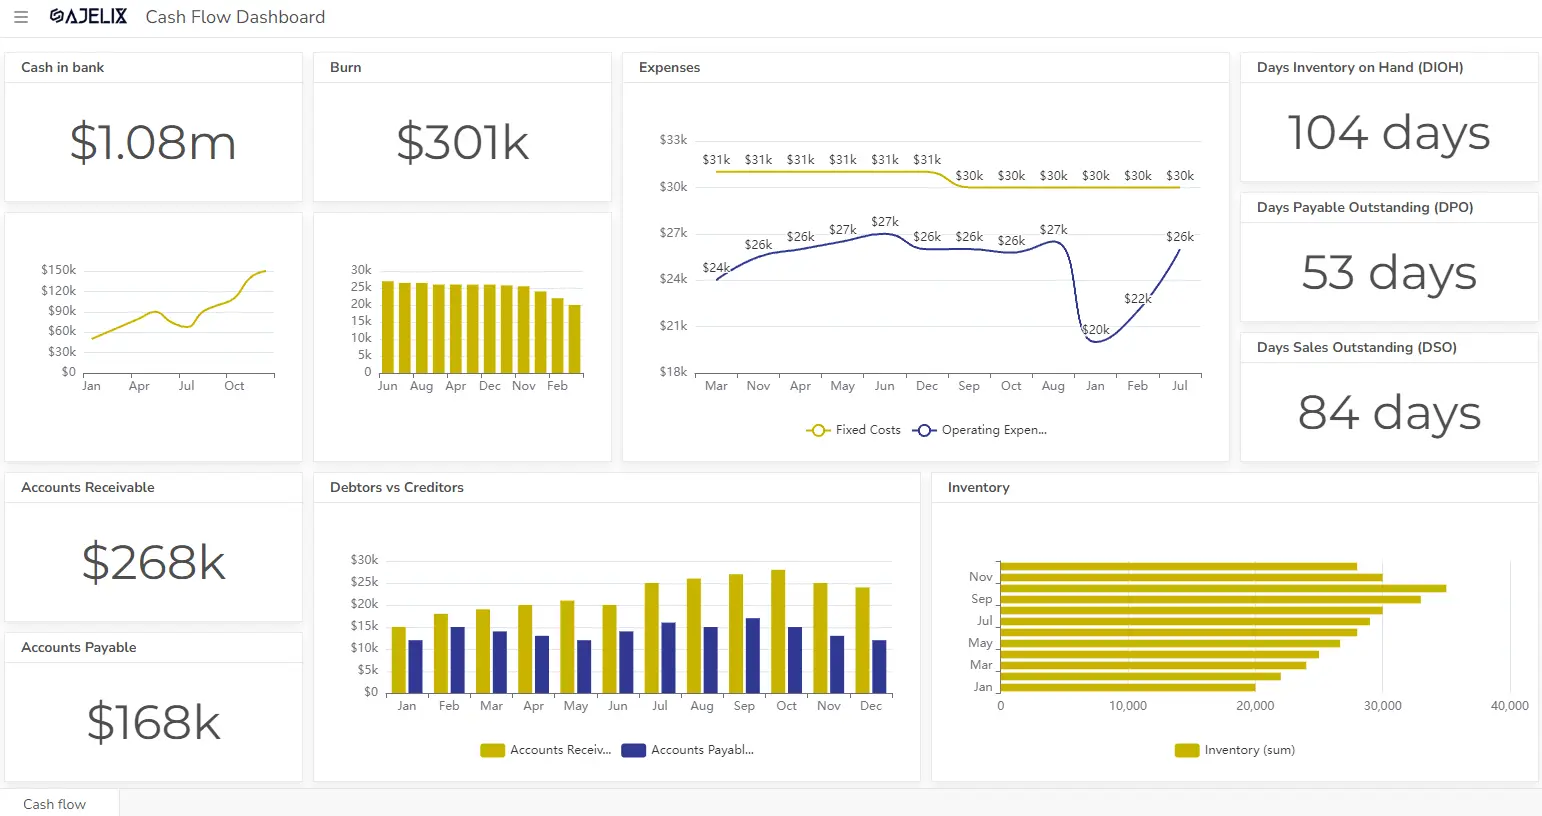
2. Cash Flow Dashboard
Focuses on cash inflows and outflows, highlighting cash balance, cash burn rate, and days sales outstanding.
KPIs & Metrics
- Operating cash flow
- Investing cash flow
- Financing cash flow
- Free cash flow
- Accounts payable & receivable
- Days sales outstanding (DSO)
- Days inventory on hand (DIOH)
- Days payable outstanding (DPO)
- Cash conversion cycle
Dashboard Example
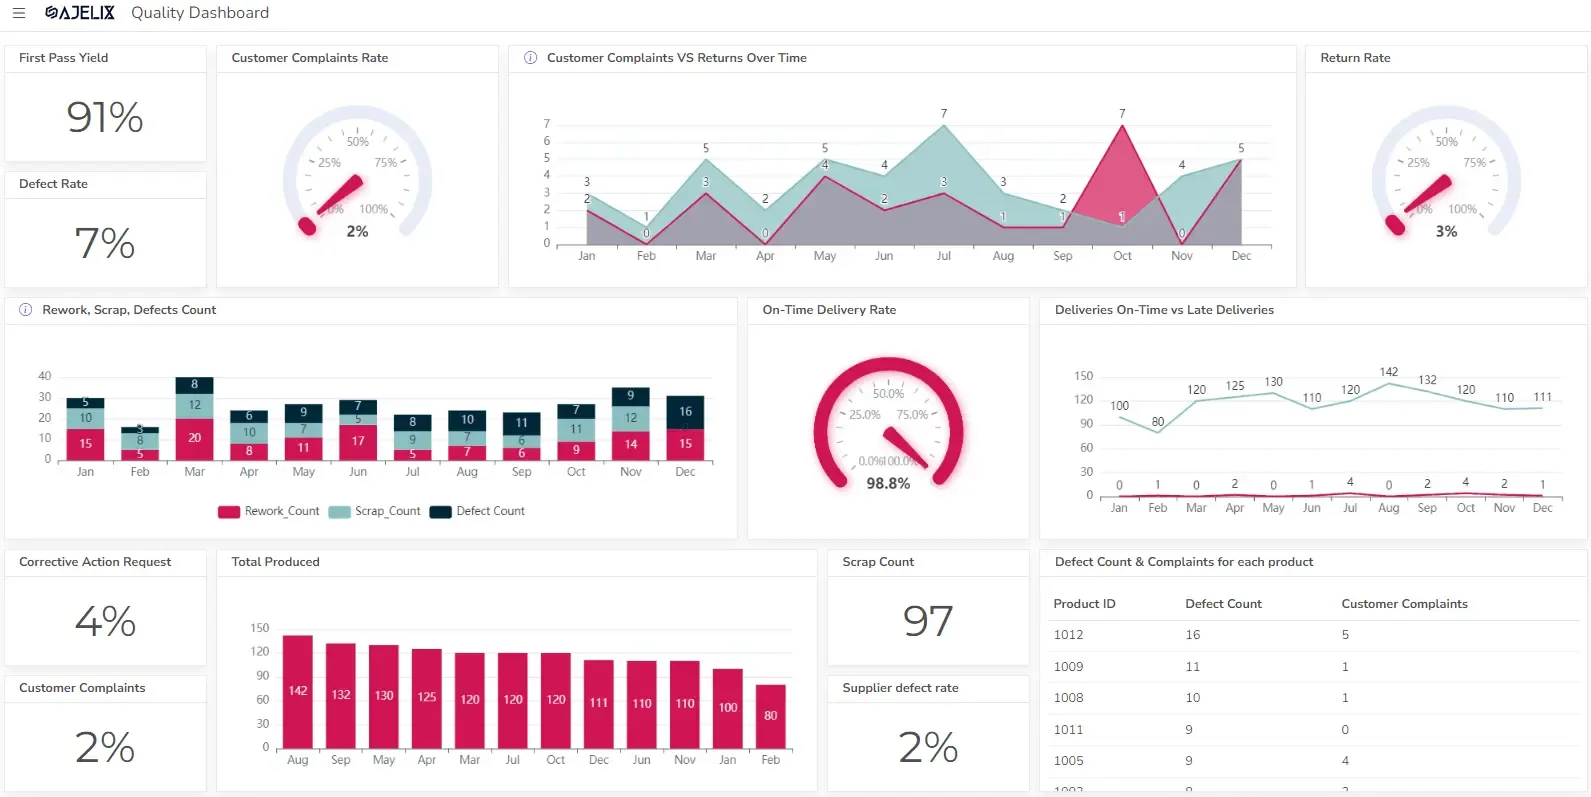
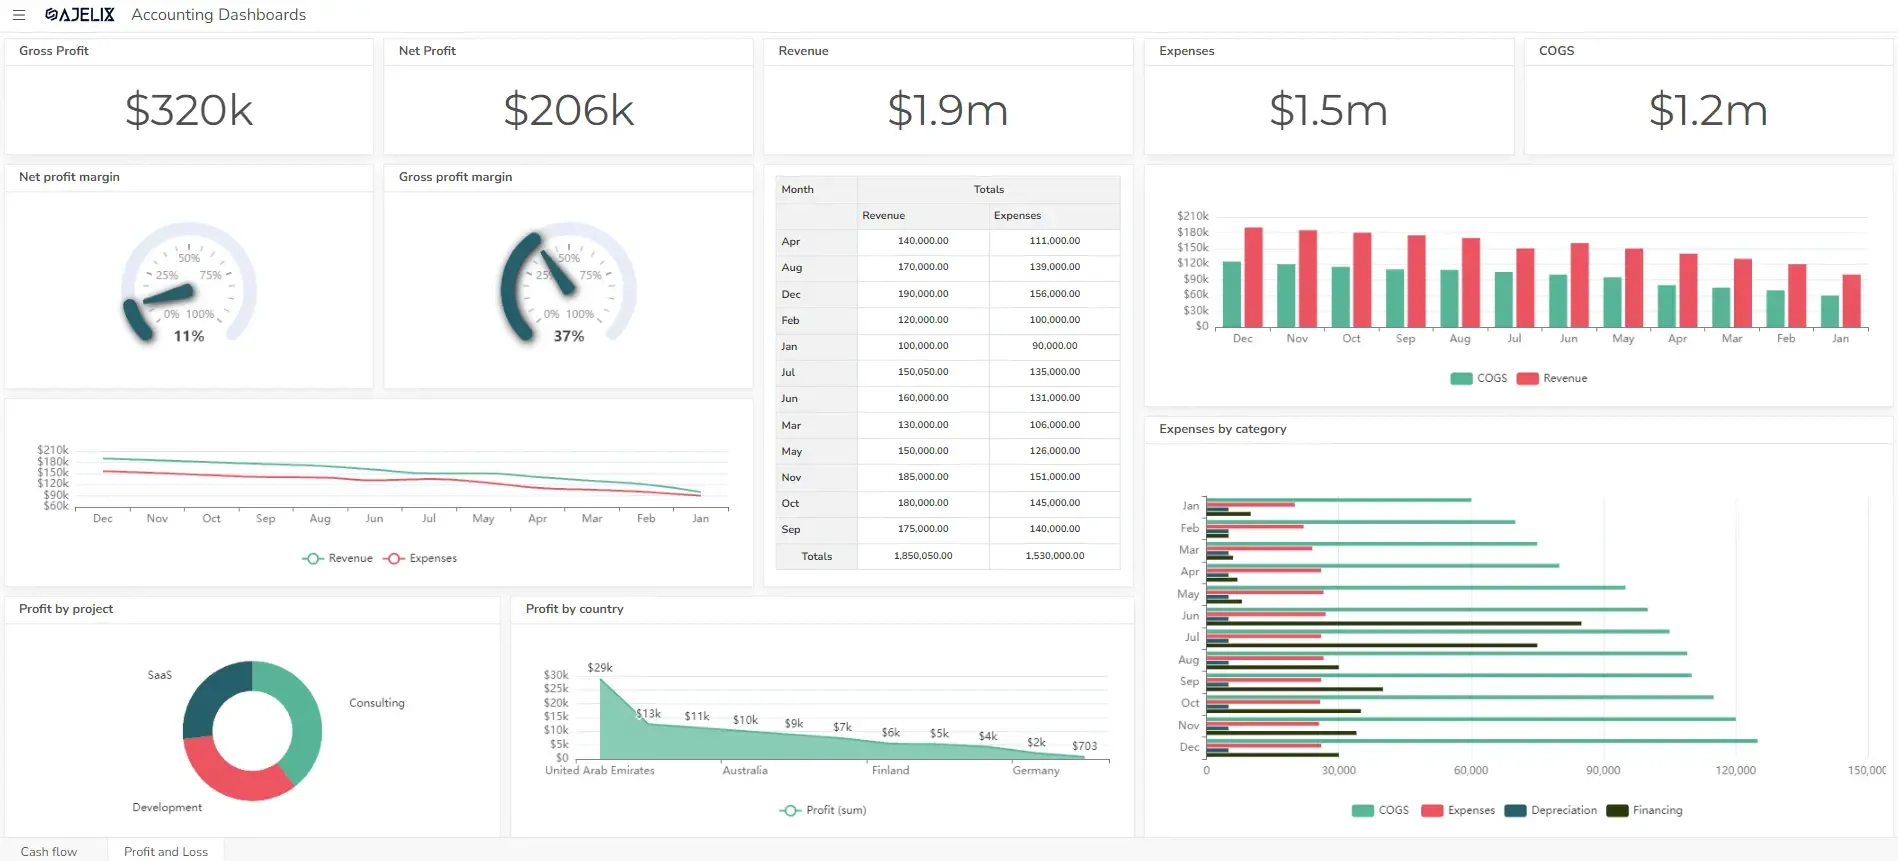
3. Profit and Loss (P&L) Dashboard
Delves deeper into the income statement, analyzing revenue, cost of goods sold, operating expenses, and net income. This data can be included in any dashboard it’s not mandatory to create a separate dashboard. However, it’s best to separate this data on different pages using Ajelix BI.
KPIs & Metrics
- Revenue by product/service line
- Cost of goods sold (COGS)
- Operating expenses
- Operating income
- Net income
- Gross profit and net profit margin
Dashboard Example

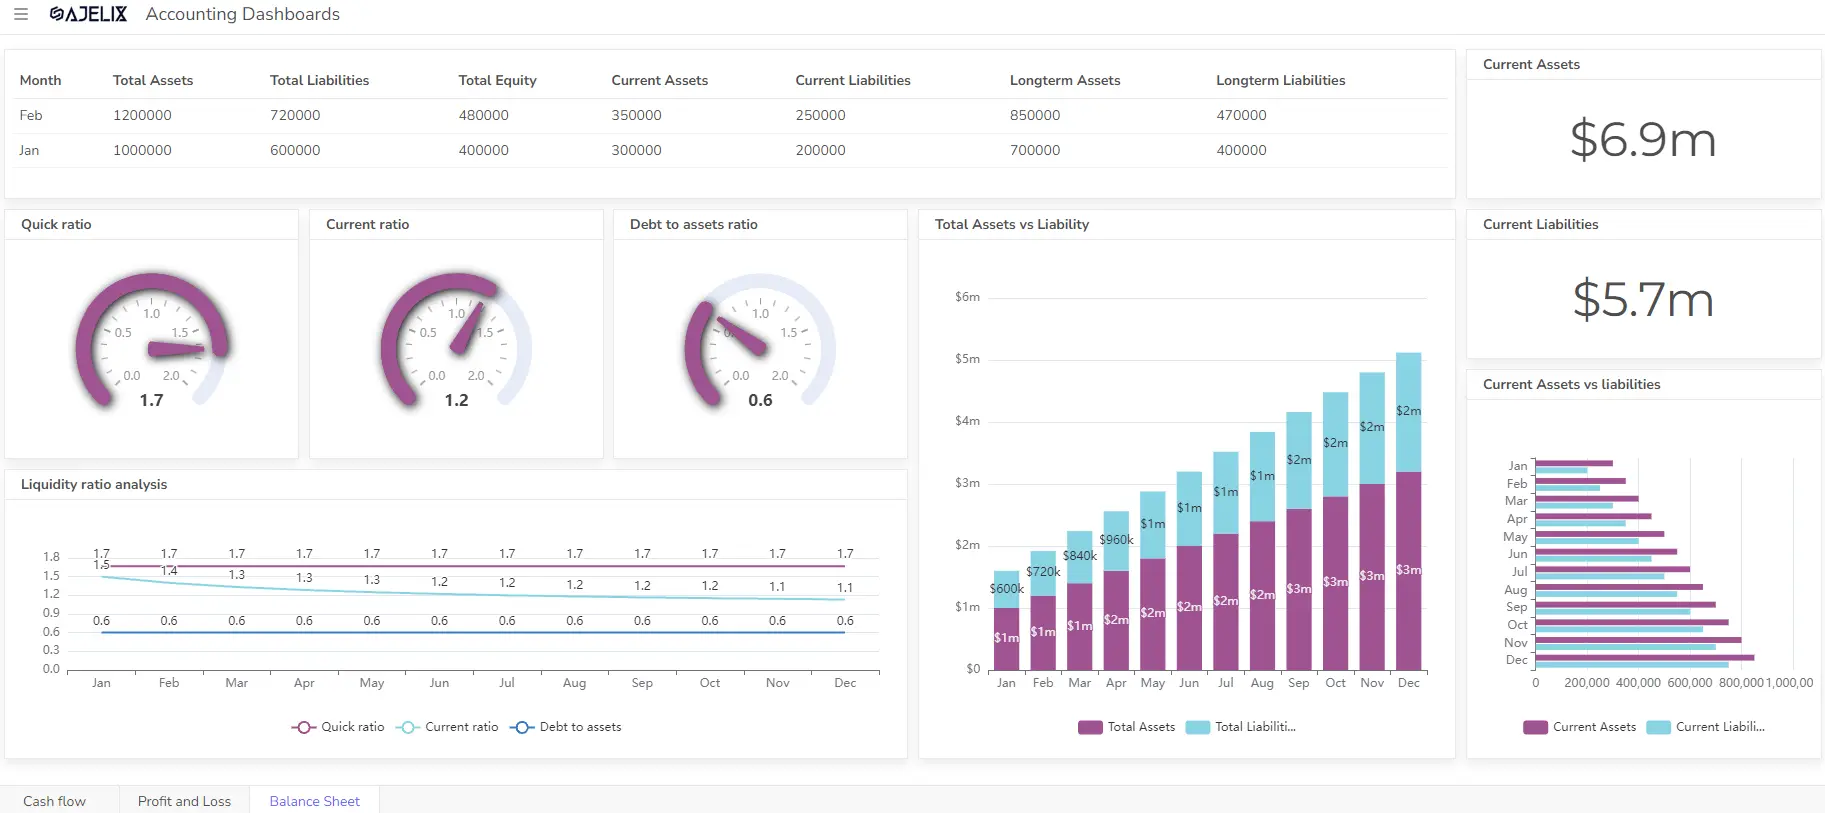
4. Balance Sheet Dashboard
Provides a snapshot of the company’s financial position, including assets, liabilities, and equity. The balance sheet dashboard shows the financial situation at a specific point in time.
KPIs & Metrics
- Total assets
- Total liabilities
- Total equity
- Current assets
- Current liabilities
- Long-term assets
- Long-term liabilities
- Debt-to-assets ratio, you can use our online debt calculator to calculate this metric
Dashboard Example
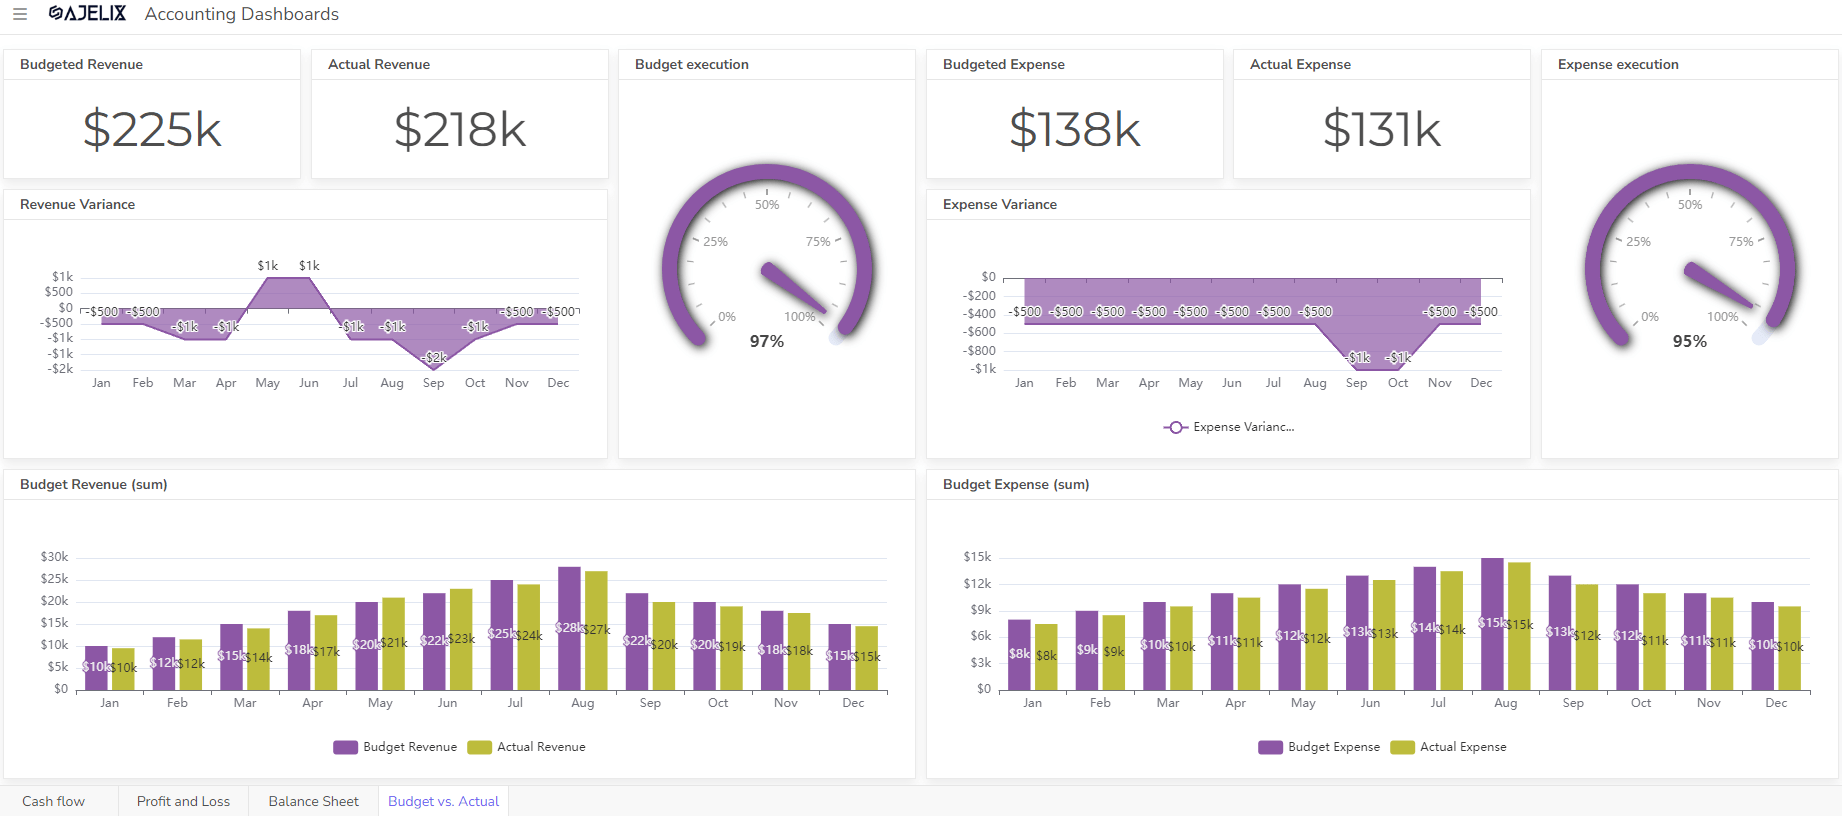
5. Budget vs. Actual Dashboard
Compares budgeted figures with actual performance, highlighting variances and potential issues.
KPIs & Metrics
- Revenue variance
- Expense variance
- Profit variance
- Key performance indicators (KPIs) vs. targets
- Budget execution
Dashboard Example
6. CFO Dashboard
Offers a more detailed view of financial performance, including financial ratios and forecasts.
KPIs & Metrics
- In-depth financial analysis
- Cash flow forecasting
- Budgeting and forecasting
- Financial modeling
- Risk management metrics
7. Tax Dashboard
Provides a consolidated view of tax-related data and calculations. Tax dashboard overviews liabilities, payments, and compliance status.
KPIs & Metrics
- Tax liabilities
- Tax payments
- Tax refunds
- Tax compliance status
- Tax audits
It’s important to note that these are just general categories, and many dashboards can combine elements from multiple types. The optimal dashboard design depends on the specific needs and goals of the organization.
How To Create An Effective Accounting Dashboard?
Time needed: 5 hours
Transform your financial data into actionable insights. Build a custom dashboard to track accounting key performance indicators, optimize business operations, and fuel growth. Discover how with our step-by-step guides and free Ajelix BI trial.
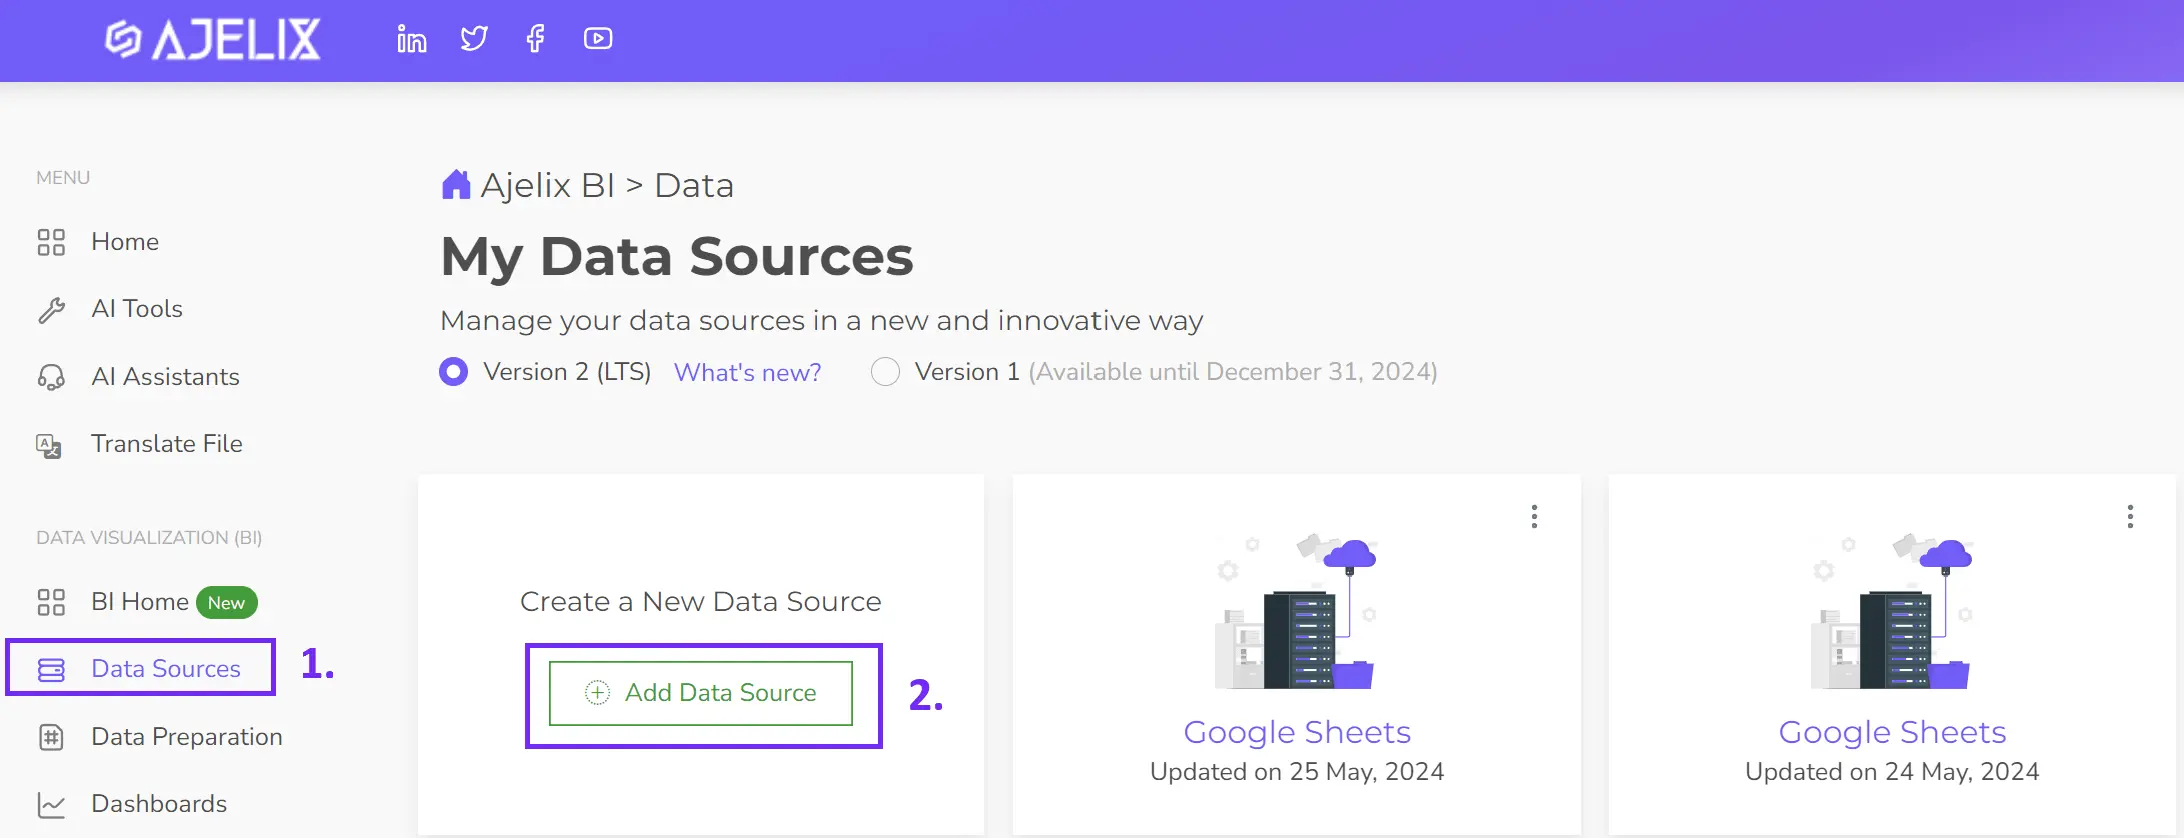
- Connect your data source
Seamlessly bring your data together. Connect Excel, CSV, Google Sheets, or SQL files to Ajelix BI in just a few clicks. Go to the Data sources page, select the data type, and import your data.
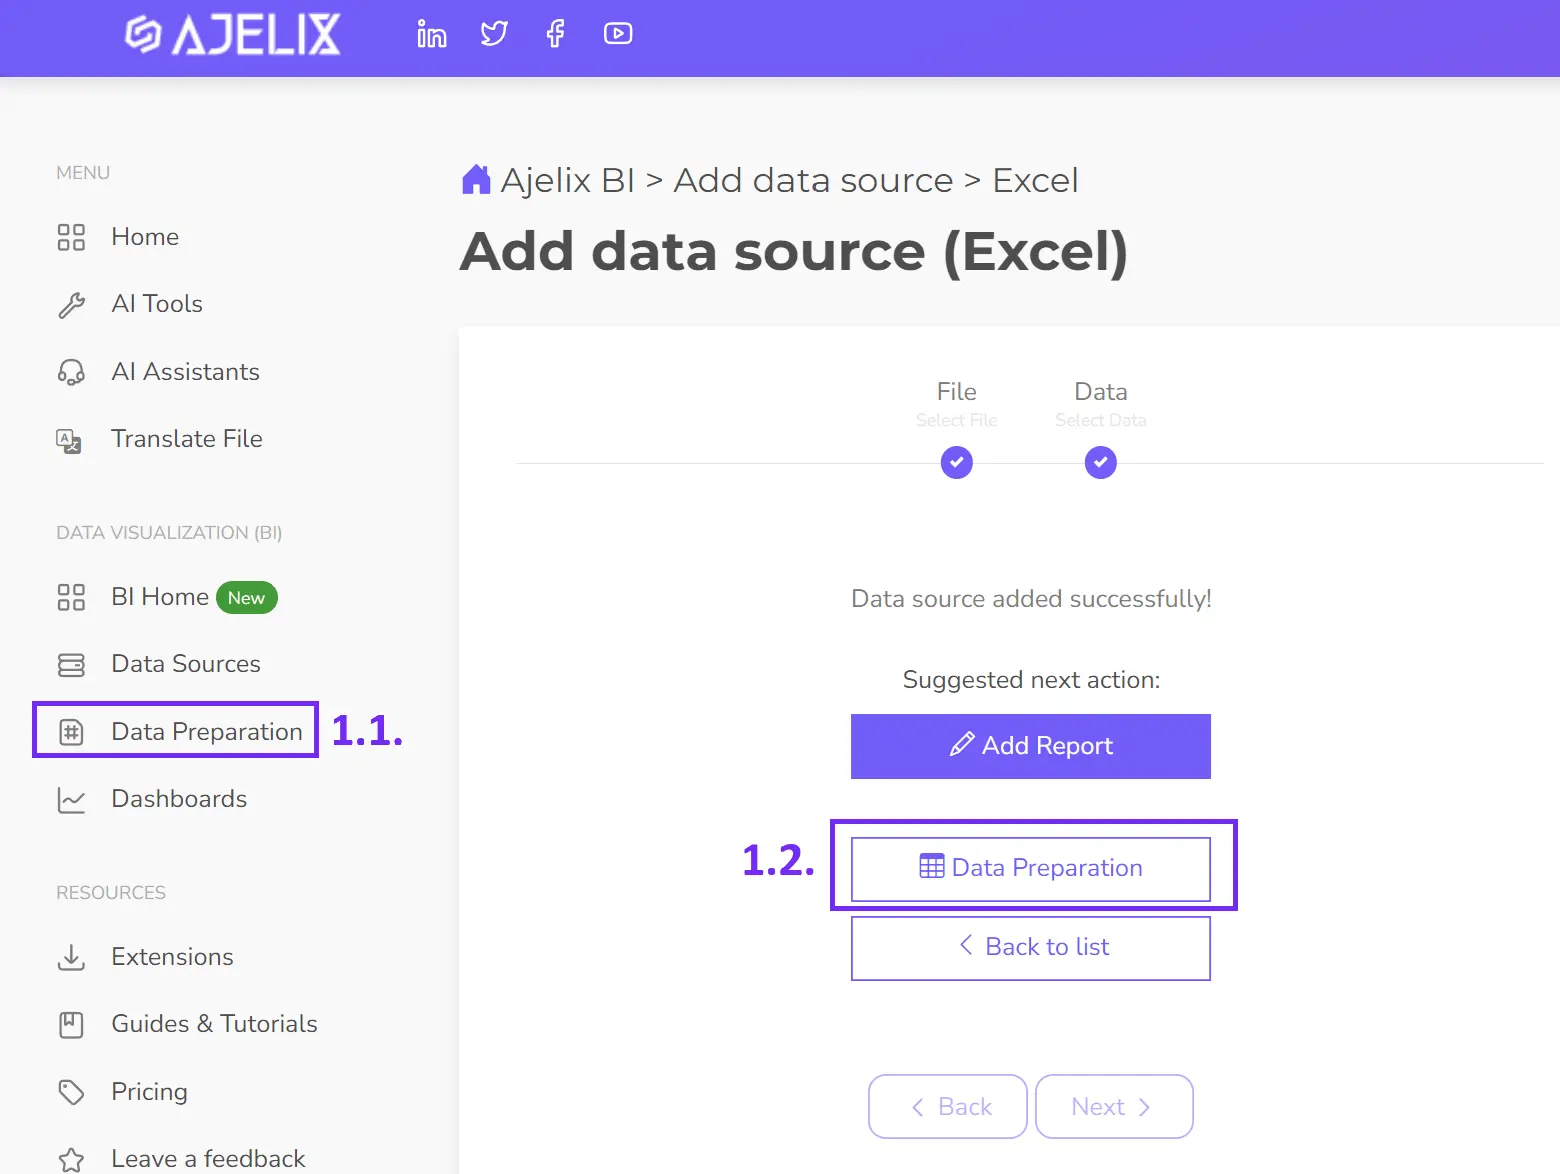
- Clean and transform your data
Get the most out of your data. Ajelix BI helps you clean, shape, and refine your data, ensuring accuracy and reliability for better decision-making. Explore other data preparation features here.
- Create KPIs
Calculating accounting KPIs doesn’t have to be complicated. Ajelix BI simplifies the calculation process for numerous key metrics. This article showcased over 7 dashboard types with accounting KPIs that you can easily create on your own. Plus, creating custom KPIs is a breeze. Follow these steps:
1. Connect your data.
2. Create a new measure.
3. Define your KPI.
4. Enter the calculation.
5. Save your KPI.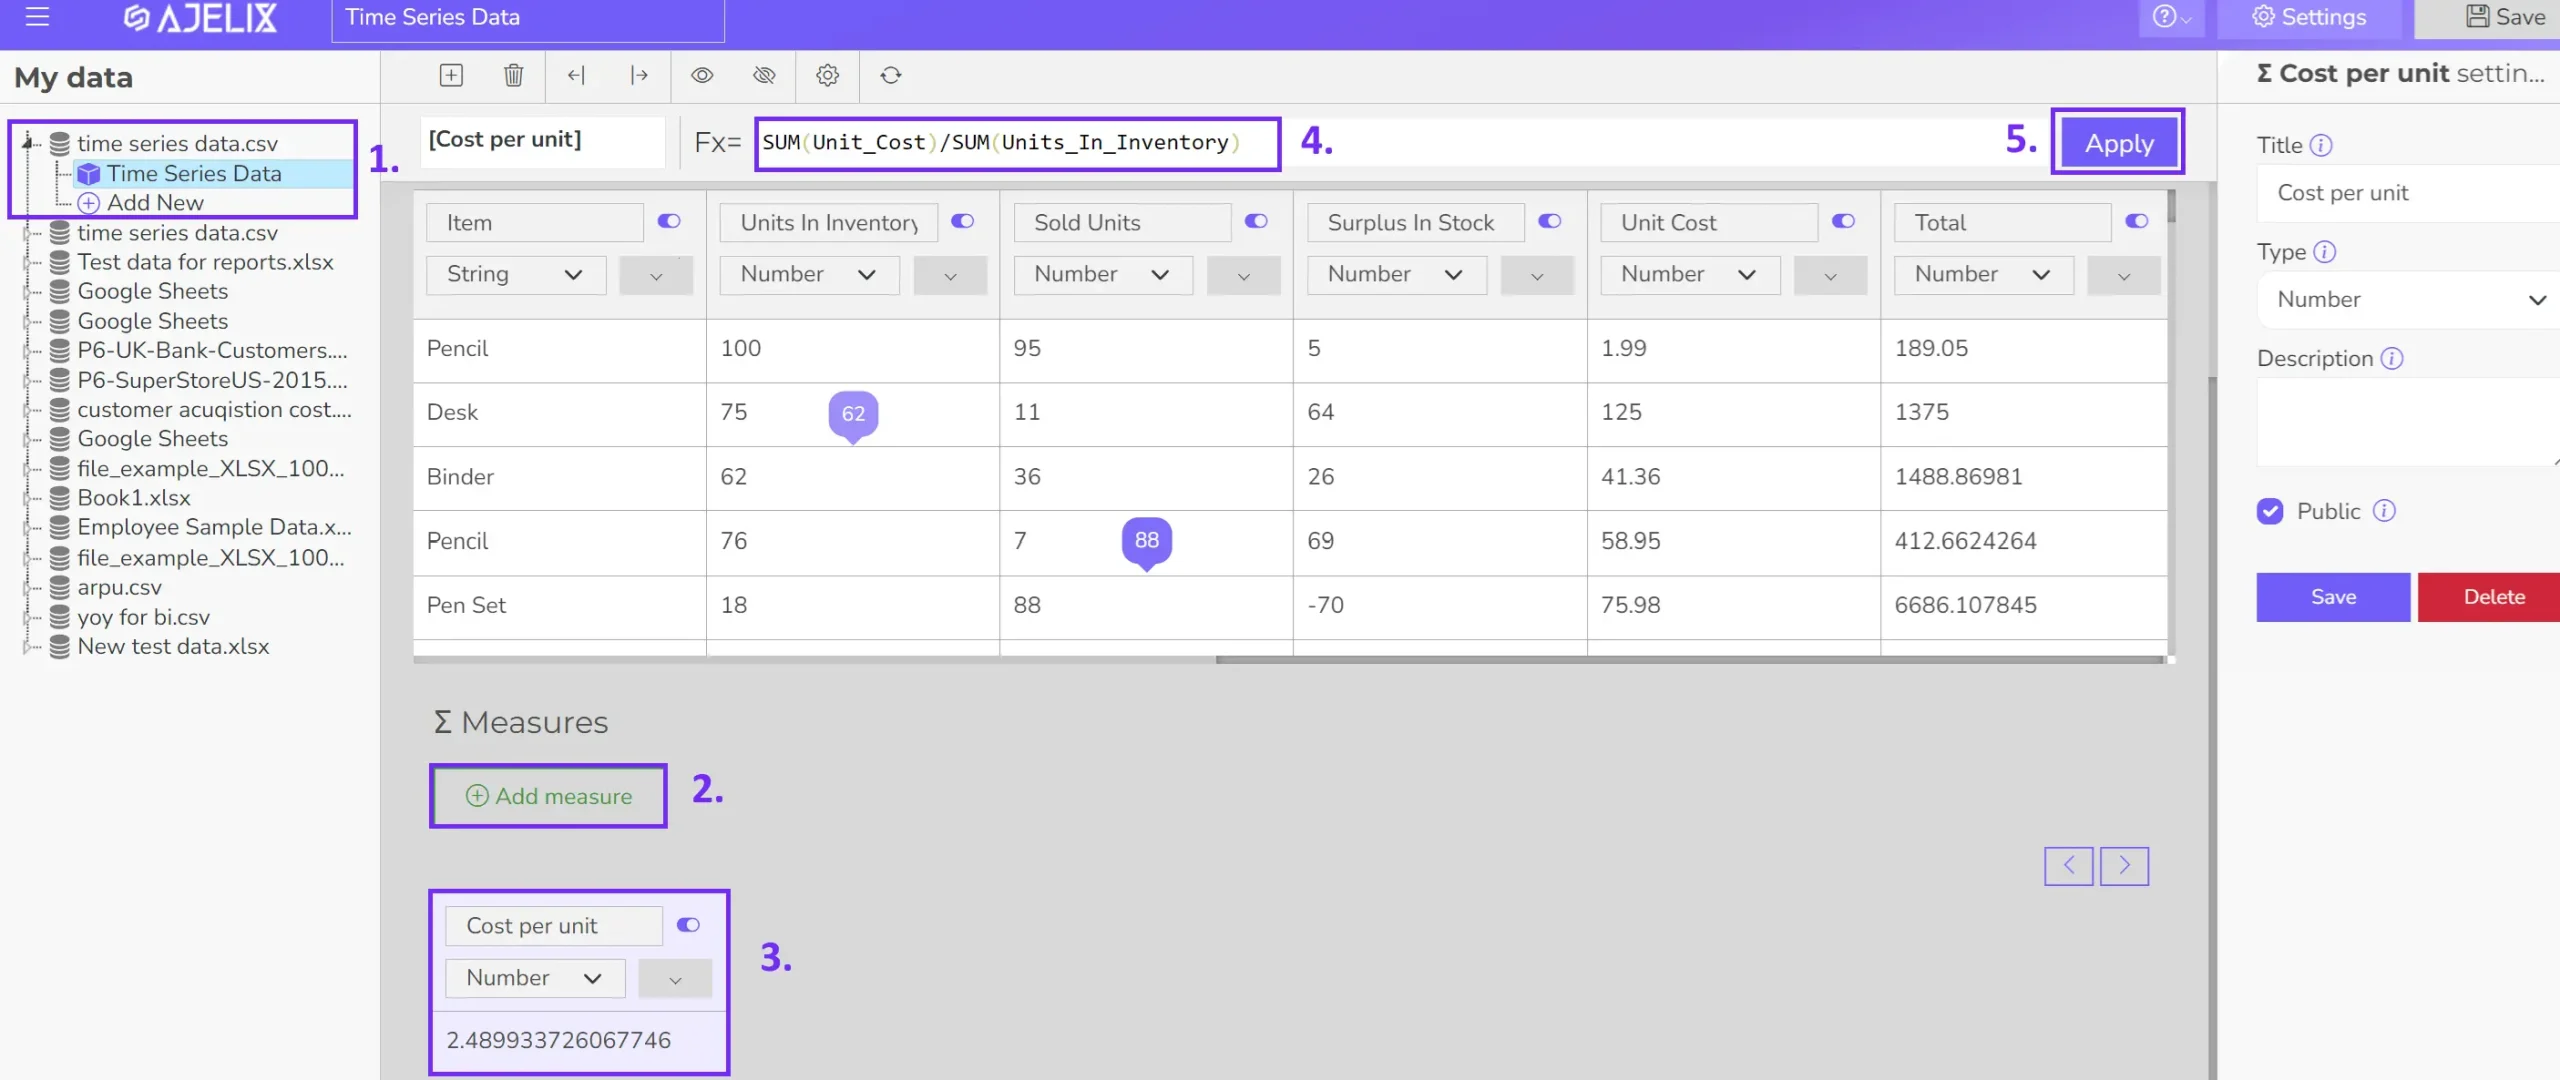
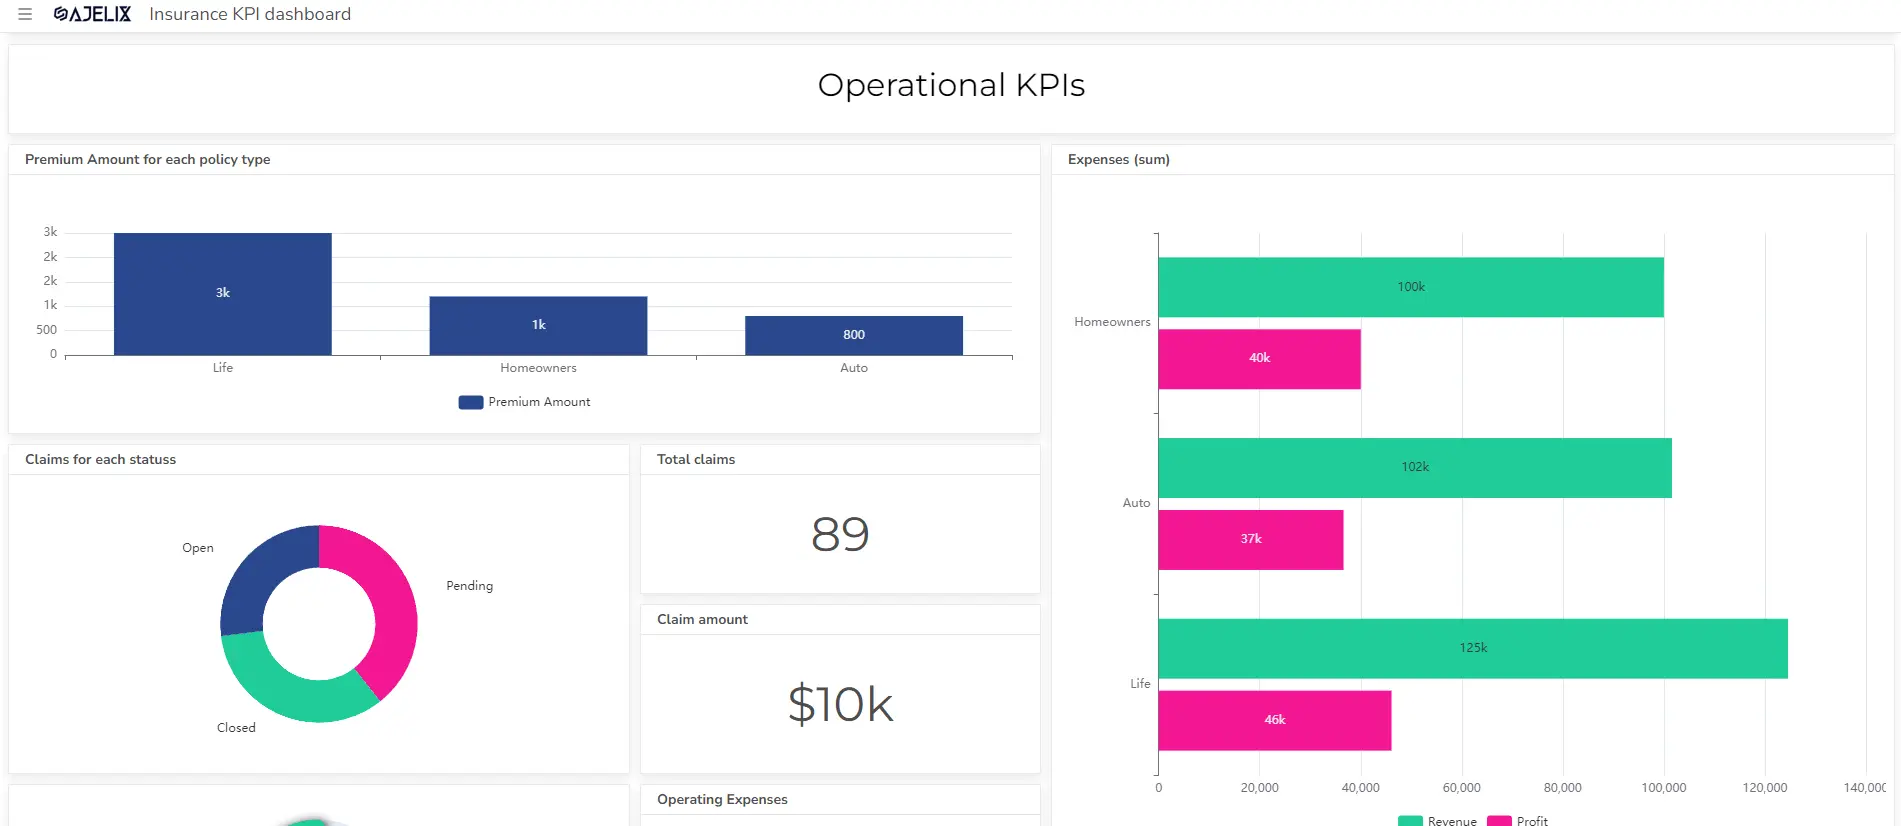
- Build your visualizations
Bring your accounting KPIs to life with impactful charts and graphs. Choose from various visualization options, including cards, gauges, and line graphs. Easily create stunning dashboards by simply dragging and dropping your data. Or, let Ajelix BI’s AI build dashboards for you.
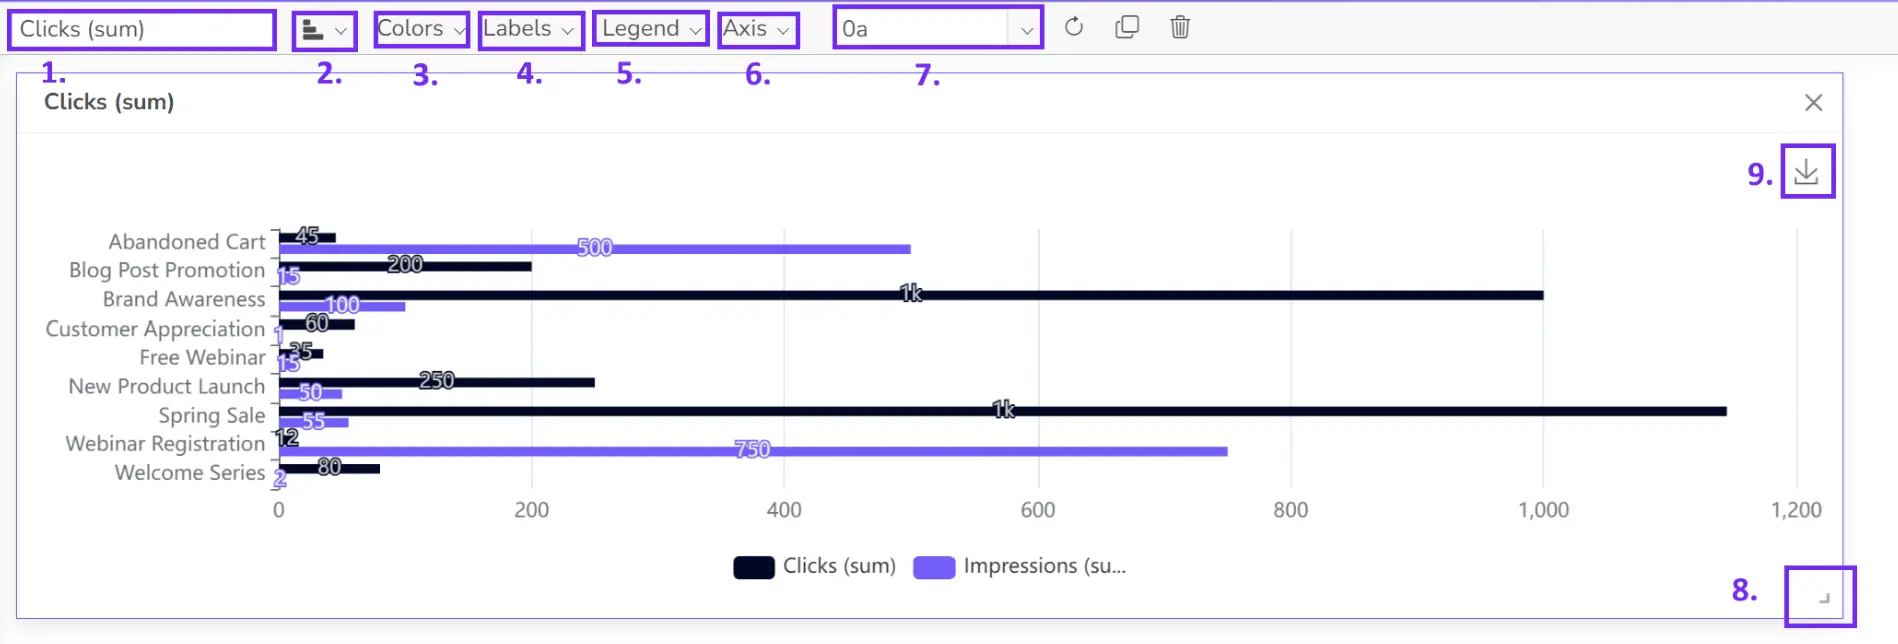
- Customize your dashboard
Personalize your charts to perfection. Add clear titles, your brand’s colors, and fine-tune formatting for a professional look.
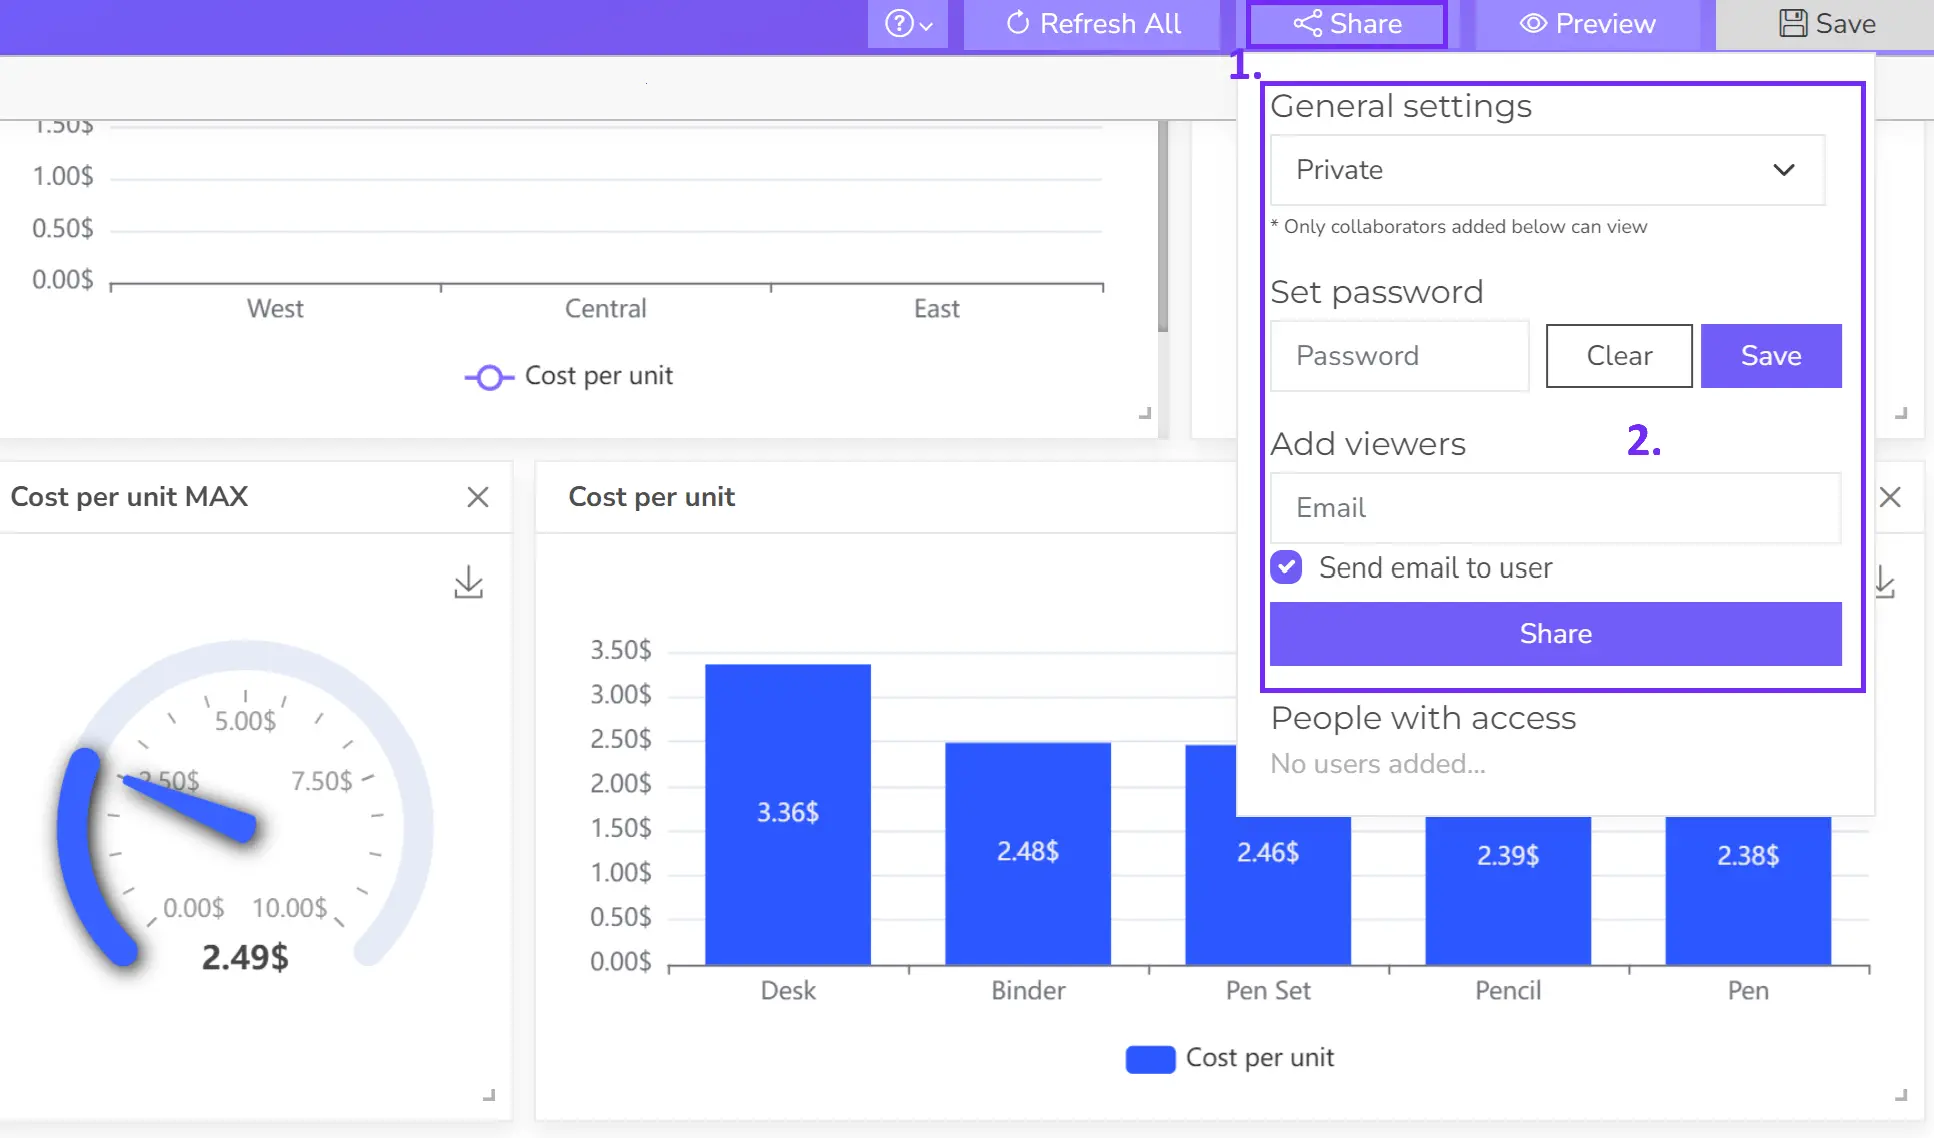
- Share your dashboard
Once satisfied with your dashboard, share it with your team for real-time insights.
Reporting gives you a headache?
Upload your data and create professional reports with agentic AI

Start free
Try free and upgrade whenever
Tips for Creating an Effective Dashboard
An effective accounting dashboard is a balance of art and science. It requires a deep understanding of your audience’s needs, the data available, and the storytelling potential of visualization. Here are some key tips:
Understand Your Audience
- Identify the primary users: Executives, managers, or analysts?
- Determine their information needs: What metrics are crucial for their roles?
- Consider their technical proficiency: How comfortable are they with data visualization?
Focus on Key Metrics
- Prioritize information: Select metrics that directly impact business goals.
- Avoid information overload: Less is often more.
- Consider the time frame: Daily, weekly, monthly, or yearly data?
- Track related financial processes: Incorporate data from systems like paystubhero to monitor payroll expenses alongside other financial metrics.
Design for Clarity and Impact
- Use clear and consistent visuals: Charts, graphs, and tables should be easy to interpret.
- Choose the right chart type: Bar charts for comparisons, line charts for trends, etc.
- Leverage color effectively: Use color to highlight important information.
- Maintain a clean layout: Avoid clutter and distractions.
Ensure Data Accuracy and Reliability
- Validate data sources: Ensure data integrity.
- Implement data cleansing processes: Remove errors and inconsistencies.
- Regularly update data: Keep the dashboard fresh and relevant.
Make it Interactive
- Allow for drill-down: Enable users to explore data in more detail.
- Provide filtering options: Let users customize the view.
- Consider adding alerts: Notify users of important changes.
Test and Iterate
- Gather feedback: Ask users for input on the dashboard’s effectiveness.
- Make adjustments: Improve the dashboard based on feedback.
- Continuously monitor performance: Evaluate the dashboard’s impact on decision-making.
Additional Tips
- Use storytelling techniques: Create a narrative with the data.
- Consider mobile optimization: Ensure the dashboard is accessible on different devices.
- Document the dashboard: Explain the purpose and metrics for future reference.
By following these guidelines, you can create an accounting dashboard that is not only visually appealing but also provides valuable insights to support informed decision-making.
Tools for creating dashboards
The choice of tools for creating accounting dashboards depends on factors such as the complexity of your data, the level of customization required, and your budget. Here are some popular options:
Dedicated Dashboarding Tools
- Ajelix BI: Offers a user-friendly interface for creating interactive dashboards, with a focus on financial data visualization.
- Databox: Provides pre-built templates for financial dashboards and integrates with various accounting software.
- Tableau: Powerful tool for data visualization and analysis, suitable for complex dashboards.
- Looker: Cloud-based platform for data exploration and visualization, often used for enterprise-level dashboards.
- Power BI: Microsoft’s business intelligence tool, integrates seamlessly with other Microsoft products.
- Qlik: Offers interactive data discovery and visualization capabilities.
Accounting Software with Dashboarding Features
Many AI accounting software solutions now include built-in dashboard functionalities:
- QuickBooks: Offers customizable dashboards with key financial metrics.
- Xero: Provides real-time financial insights and customizable dashboards.
- Sage: Offers various dashboard options depending on the specific Sage product.
- Zoho Books: Provides customizable dashboards with key financial indicators.
Spreadsheet Software
While not ideal for complex dashboards, Excel can be used to create basic dashboards with pivot tables and charts:
- Microsoft Excel: Offers basic dashboarding capabilities, suitable for smaller businesses.
- Google Sheets: Cloud-based alternative to Excel with similar functionalities.
Conclusion
In conclusion, online accounting dashboards are indispensable tools for modern accountants. By providing real-time financial insights, these platforms streamline operations, enhance decision-making, and improve overall efficiency.
Accounting dashboards offer a comprehensive overview of a business’s financial health, from tracking key performance indicators to identifying trends and anomalies.
By leveraging advanced visualization tools like Ajelix BI, accountants can create highly customized and interactive dashboards that cater to specific needs and preferences. Embracing these technological advancements is crucial for staying competitive in today’s data-driven business landscape.
FAQ
An online accounting dashboard is a digital tool that provides a real-time overview of a business’s financial performance. It typically displays key metrics, charts, and graphs to help accountants analyze financial data efficiently.
Key features include real-time data updates, customizable dashboards, key performance indicators (KPIs), data visualization, and integration with accounting software.
Many online accounting dashboards offer seamless integration with popular accounting software. Check the specific features of your chosen tool to determine the integration process.
Yes, most online accounting dashboards are cloud-based, allowing you to access them from any device with an internet connection.
Reputable online accounting dashboard providers prioritize data security. Look for tools with robust security measures such as encryption and data protection policies.
Explore other dashboards


Ready to create your dashboard?