- Home
- Data Visualization
- Tools
- AI Data Analyst
- Excel Formula Generator
- Excel Formula Explainer
- Google Apps Script Generator
- Excel VBA Script Explainer
- AI VBA Code Generator
- Excel VBA Code Optimizer
- Excel VBA Code Debugger
- Google Sheets Formula Generator
- Google Apps Script Explainer
- Google Sheets Formula Explainer
- Google Apps Script Optimizer
- Google Apps Script Debugger
- AI Excel Spreadsheet Generator
- AI Excel Assistant
- AI Graph Generator
- Pricing
- Resources
Explore other articles
- 7 Productivity Tools and AI Plugins for Excel
- Julius AI Alternatives: Top 5 Choices 2026
- No Code Analytics: Top Tools in 2026
- Automation Tools for Excel in 2026: Built-In & Third-Party
- 5 Healthcare Data Analytics Trends 2026
- Best Analytics Platform For Startups In 2026
- 15 Best AI Tools For Startups In 2026 We Tried
- 7 Best AI Tools for Excel Data Analysis (2026 Comparison)
- AI Data Intelligence For Workspace
- Conversational Analytics & AI
Try AI in Excel
In today’s fast-paced financial world, mastering financial modeling isn’t just an advantage—it’s a necessity. It helps finance professionals to analyze data, identify trends, and make predictions about the future of their organization.
And guess what? Despite the rise of new technologies, Excel still remains the most commonly used software by finance gurus for creating financial models.
Essential Formulas for Financial Foundations
SUM and SUMIF: The Cornerstones of Financial Totals
In the realm of financial modeling, mastery over summation is paramount. Excel’s SUM function lays the foundation for basic totals, while the nuanced SUMIF introduces specificity by allowing criteria-based summation. These cornerstones empower financial analysts to aggregate data with precision.
Mastering Basic Summation with SUM
The humble SUM function, a financial workhorse, simplifies the summation of numeric data. Its application ranges from totaling revenues and expenses to calculating net income, providing a fundamental tool for financial consolidation.
Adding Precision with SUMIF for Specific Criteria
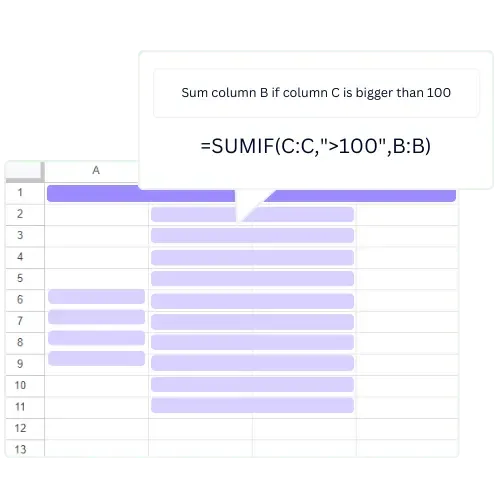
Elevating the summation game, SUMIF introduces criteria-based calculations. This formula enables financial analysts to isolate and sum values that meet specified conditions, refining the aggregation process for targeted insights into financial data.
COUNT and COUNTA: Navigating Data Volume
In the vast landscape of financial data, navigating volume becomes a challenge. Excel’s COUNT and COUNTA functions offer navigational aids, facilitating the counting of numeric values and all values, respectively, laying the groundwork for comprehensive data analysis.
Counting Numeric Values Effectively with COUNT
The COUNT function proves invaluable in discerning the quantity of numeric values within a dataset. Whether tallying the number of transactions, stocks, or customer orders, COUNT provides a reliable metric for gauging data volume.
Including All Values with COUNTA for Comprehensive Analysis
Expanding the scope, COUNTA comes into play, counting all values within a dataset, regardless of data type. This inclusivity enhances the analyst’s ability to assess the completeness of financial data, ensuring a holistic approach to analysis.
AVERAGE and AVERAGEIF: Calculating Mean Values
In the pursuit of understanding data trends, mean values hold significance. Excel’s AVERAGE and AVERAGEIF functions facilitate precise calculations, allowing financial analysts to unravel the average values within a dataset and tailor averages based on specific criteria.
Finding the Mean with AVERAGE
The AVERAGE function, a beacon of simplicity, computes the arithmetic mean of a range of numeric values. This straightforward yet potent tool unveils the central tendency of financial data, aiding in the interpretation of trends.
Tailoring Averages with AVERAGEIF for Targeted Insights
Precision in averages is achievable with AVERAGEIF, permitting financial analysts to calculate means based on specific conditions. This targeted approach refines the interpretation of data, offering nuanced insights into segmented aspects of financial performance.
Struggling with your Excel formulas?
Looking for a faster and easier way to write Excel formulas? Try AI Excel Formula Generator and turn your text into formulas with just a few clicks.
Time Value of Money Formulas
FV and PV: Unveiling Future and Present Value
The time value of money forms the backbone of financial decision-making. Excel’s Future Value (FV) and Present Value (PV) functions are indispensable in unraveling the complexities associated with forecasting future worth and determining present value. For easier data presentation you can use data visualization tools to share calculated metrics with others.
Present Value Formula
Calculate the present value to determine the current worth of a future cash flow or stream of payments by taking the sum of all future cash flows, discounting them by a rate of return, and subtracting the initial investment. This formula is essential for understanding the value of investments and deciding if they are suitable for a portfolio.
=PV(rate,nper,pmt,[fv],[type])
rate = the interest rate per period
nper = number of periods
pmt = payment per period
fv = future value (optional) type = 0 or 1 (optional)
Future Value Function
Calculate the future value of an investment by taking the sum of all future cash flows, discounted by a rate of return, and adding the initial investment. To understand the value of investments and determine whether you should invest.
=FV(rate,nper,pmt,[pv],[type])
rate: The periodic interest rate
nper: Number of compounding periods
pmt: The payment made each period
pv: Present value (optional, default is 0)
type: When the payments are due (optional, default is 0)
Present Value Analysis Made Easy with PV
Conversely, PV focuses on the present, unraveling the current value of future cash flows. This function aids financial analysts in discounting future values to their present worth, a crucial aspect of investment appraisal and financial planning.
RATE and NPER: Deciphering Interest Rates and Payment Periods
Interest rates and payment periods lie at the crux of financial decisions. RATE and NPER functions in Excel decode the intricacies, providing tools for understanding interest rates on loans and determining the number of payment periods required for an investment. Calculate complex metrics and KPIs you can use business intelligence tools that let’s you analyze data in your business.
Understanding Interest Rates Using RATE
RATE demystifies the interest rate component, offering a precise calculation of the interest rate associated with an investment or loan. This function equips financial analysts with the insights needed to evaluate the cost of borrowing or the potential return on an investment.
Navigating Payment Periods with NPER for Strategic Planning
NPER steps into the limelight when determining the number of payment periods becomes essential. This function aids financial analysts in strategic planning, helping them ascertain the optimal duration for investments or the repayment timeline for loans.
Loan and Amortization Formulas
PMT and IPMT: Mastering Loan Payments
The financial landscape often involves loans and their intricate payment structures. Excel’s PMT and IPMT functions are instrumental in mastering loan payments, providing a roadmap for calculating regular payments and isolating interest payments within the repayment schedule.
Calculating Regular Payments with PMT
PMT simplifies the often complex task of determining regular loan payments. This function considers interest rates, the loan term, and the principal amount, offering a clear and concise calculation of the periodic payment required for loan amortization.
Isolating Interest Payments with IPMT
Within the realm of loan repayment, understanding the allocation of payments between principal and interest is paramount. IPMT comes into play by isolating interest payments within the total payment, shedding light on the cost of borrowing at each stage of the loan.
PPMT and CUMIPMT: Breaking Down Principal and Cumulative Interest
Further refining the understanding of loan amortization, Excel’s PPMT and CUMIPMT functions break down the components of repayment, isolating principal payments and providing cumulative interest analysis over the life of the loan.
Understanding Principal Payments Using PPMT
PPMT focuses on unraveling the principal portion of loan payments, offering clarity on the reduction of the borrowed amount with each installment. This function empowers financial analysts to gauge the impact of payments on the loan’s principal.
Cumulative Interest Analysis with CUMIPMT
CUMIPMT extends its capabilities to cumulative interest analysis, allowing financial analysts to assess the total interest paid over multiple periods. This function proves invaluable in evaluating the long-term cost of financing and optimizing financial strategies.
Financial Modeling for Investments
NPV and IRR: Evaluating Investment Viability
Investment decisions hinge on assessing viability, and Excel’s Net Present Value (NPV) and Internal Rate of Return (IRR) functions serve as indispensable tools for this purpose, offering metrics for evaluating the profitability and attractiveness of investments.
Net Present Value (NPV) for Investment Assessment
NPV is a compass for investment assessment, providing a comprehensive metric that considers the time value of money. This function calculates the net value of an investment by discounting future cash flows to their present value, aiding financial analysts in decision-making.
Calculating the net present value is a common practice in financial modeling. This formula determines the value of an investment today after accounting for all future cash flows, discounted by a rate of return. This formula is important for understanding the profitability and risk of an investment.
=NPV(discount_rate, cash_flow1, cash_flow2, …)
discount_rate = the discount rate used to calculate the present value of future cash flows
cash_flow1 = the first cash flow to be discounted
cash_flow2 = the second cash flow to be discounted, etc.
Internal Rate of Return (IRR) as a Key Investment Metric
IRR emerges as a key investment metric, offering insights into the potential profitability of an investment. This function calculates the
There are a variety of formulas that you can use to help create an accurate and comprehensive financial model. In this blog article, we will take a look at some of the most commonly used Excel formulas for financial modeling.
Did you find it useful?
These are just some of the most common Excel formulas for financial modeling. Mastering the right formulas can elevate your models, making them more precise, reliable, and insightful.
The key? Knowing how and when to use the right formula to drive better financial decisions!
If you are struggling with Excel and Google Sheets formula writing try out AI Excel Assistant which can generate formulas for you. Feel free to explore other Excel productivity tools that can help you boost your efficiency!
Stay in the loop! Follow us on X and LinkedIn for more essential tips & tricks and latest updates.
Why is financial modeling important?
Financial modeling is crucial for understanding a company’s financial health and making strategic decisions. It helps forecast future performance, manage budgets, and evaluate potential investments, ensuring businesses stay on track with their goals.
Is using only Excel enough for financial modeling?
Excel is a powerful tool for most financial modeling tasks, offering flexibility and a wide range of formulas. However, for very large datasets, advanced analytics, or team-based collaboration, other tools might be needed for better performance and automation.
What are the most commonly used Excel formulas in financial modeling?
Some of the most frequently used Excel formulas include SUM, SUMIF, COUNT, COUNTA, AVERAGE, AVERAGEIF, NPV, IRR, PMT, and PV. These formulas help with basic summations, calculating averages, assessing investment potential, and analyzing financial structures.
What are the main differences between NPV and IRR?
NPV (Net Present Value) calculates the current value of future cash flows, helping to determine if an investment is profitable. IRR (Internal Rate of Return) calculates the rate at which an investment’s cash flows break even, making it a key metric for investment decision-making.
Speed up your spreadsheet tasks with Ajelix AI in Excel


