How Do You Calculate Averages In Excel: Average Function

Explore other articles
- The 5 Best Enterprise AI Agents of 2026 (Reviewed By Our Team)
- AI Agents vs RPA: The Ultimate Business Automation Guide
- Best AI Data Cleaning Tools In 2026 (Tested By Our Team)
- AI Memory: Everything You Need To Know About What AI Remembers
- Agentic AI vs Hyperautomation: Choose the Right Automation
- Predictive Analytics in Marketing: From Data to ROI
- How To Convert Meeting Notes Into Action Items With Agentic AI
- Microsoft Copilot vs Ajelix: I Tested Both After the Agent 365 Launch
- Top 6 Google Sheets Add-ons That Will Actually Save You Time
- The EU AI Act: What Businesses Need to Do Before August 2026
- What are AI Agent Skills?
- How to Analyze SEO Data (And Do Something With It)
- How To Analyse Google Analytics Data With AI
- Ajelix Is Now Available Inside Google Workspace™
- Agentic AI in HR: Turn Raw Data Into Board-Ready Dashboard
- Ajelix Launches Agent Skills: Give Your AI Agent a Specialized Skill Set
- Ajelix Launches Text-to-Speech: Speak and Listen in 36 Languages
- AI Agent for Marketing: Use Cases & Best Platforms
- YouTube Analytics AI Dashboard & Template: Analyze Performance
- 4 Agentic AI Trends in 2026 You Must Know
Try AI in Excel
Data analysis often begins with understanding the central tendency, and in the world of spreadsheets, that means mastering the average in Excel. Whether you’re a seasoned analyst or just starting out, knowing how to calculate averages in Excel is a fundamental skill.
TL;DR
The Excel AVERAGE function calculates the mean of a dataset with =AVERAGE(range). It works for single ranges, multiple ranges, and non-contiguous cells (e.g., =AVERAGE(A1, C1, E1)). For conditional averages, use AVERAGEIF (single criterion) or AVERAGEIFS (multiple criteria), e.g., =AVERAGEIF(A:A, "May", B:B) or =AVERAGEIFS(C:C, A:A, "May", B:B, "Project B"). You can also quickly see averages using Excel’s status bar. Mastering these techniques simplifies data analysis across varied datasets and columns.
From simple datasets to complex analyses involving multiple columns, Excel provides versatile tools to streamline your calculations.
You’ll also learn the various ways to achieve the average using Excel, and even how to count average in Excel, ensuring you can confidently calculate averages for any dataset.
What is AVERAGE function in Excel?
The AVERAGE function in Excel calculates the average of a set of values. It takes the sum of the values and divides it by the number of values in the list. The result of the function is the average of the values.
AVERAGE Function Syntax
=AVERAGE(number1, number2, …)
How Do You Calculate Averages In Excel?
Time needed: 2 minutes
Excel provides several methods for calculating averages, ranging from simple to more complex scenarios.
Here’s a comprehensive guide to basic average calculation using the AVERAGE function:
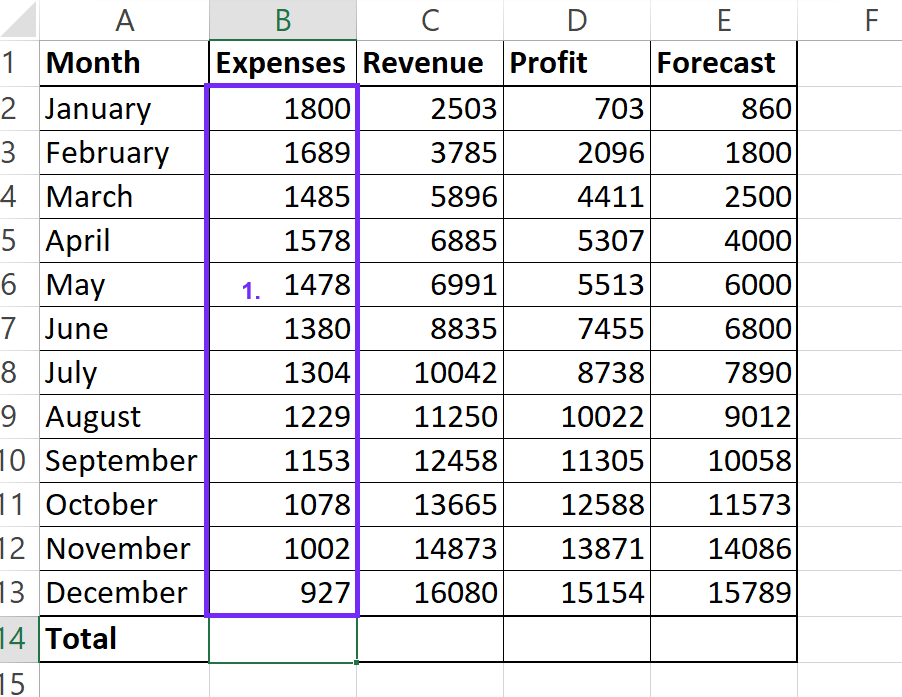
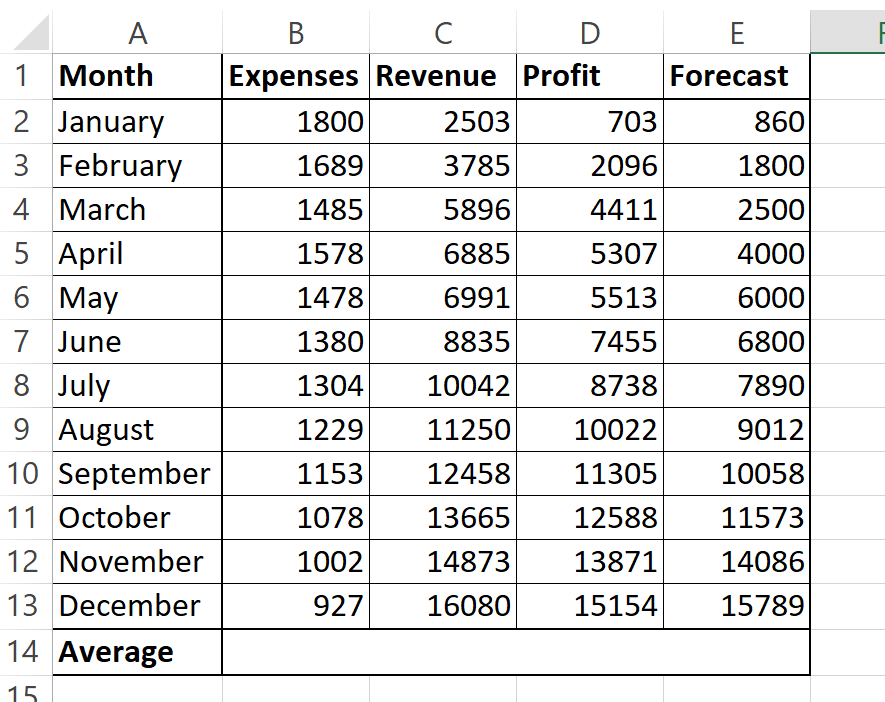
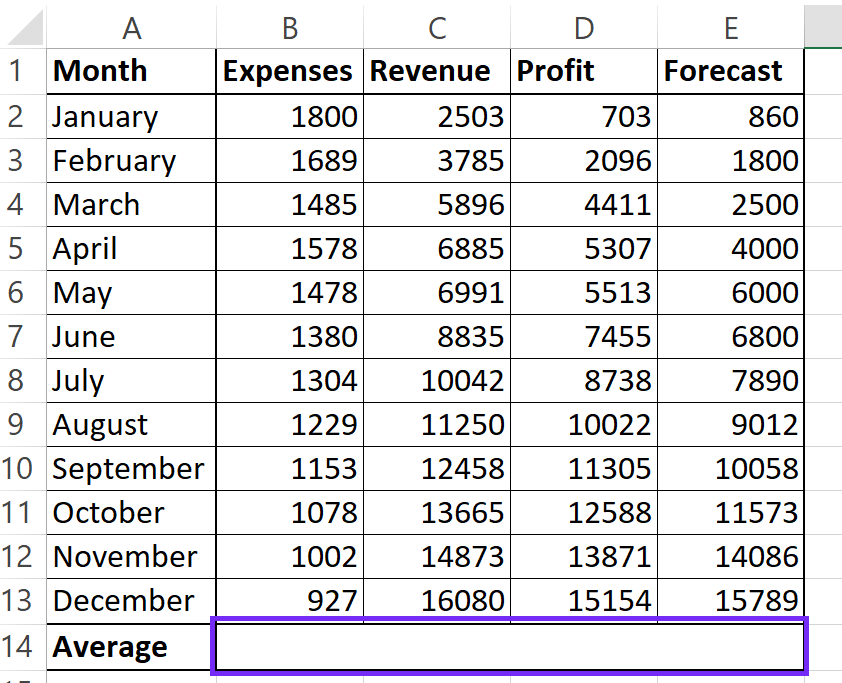
- Identify Your Data
First, locate the range of cells containing the numbers you want to average.
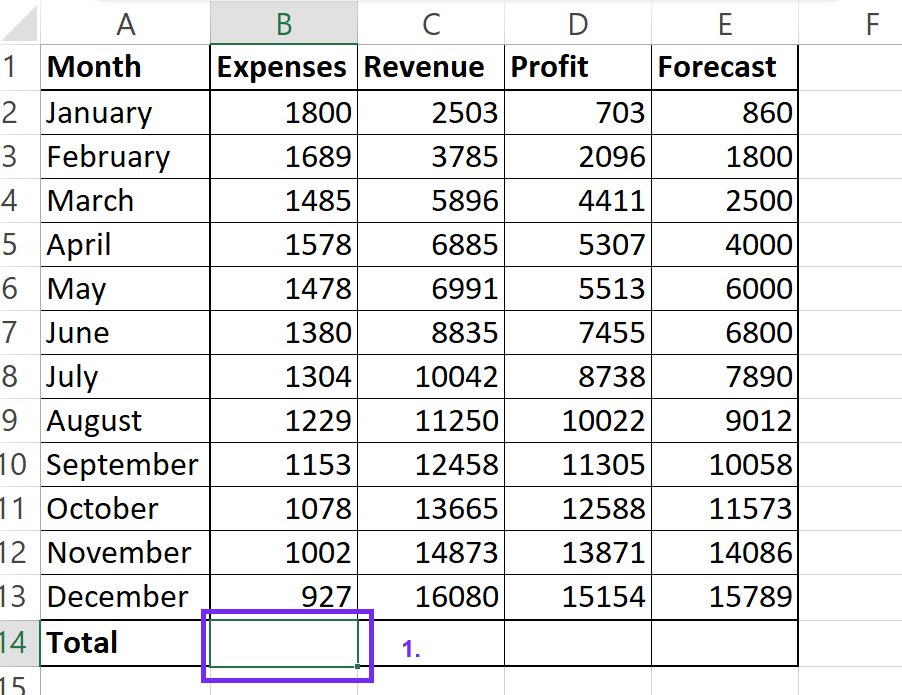
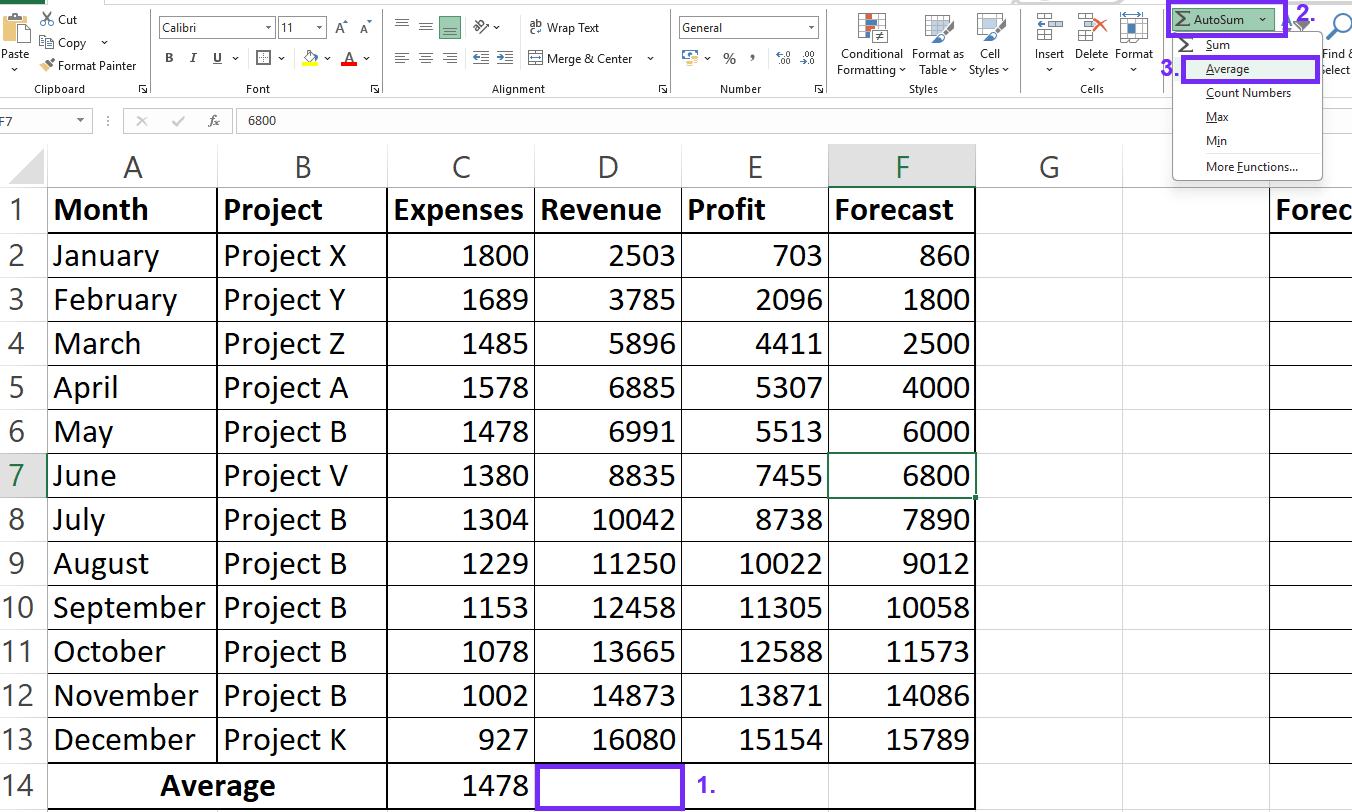
- Select the Output Cell
Choose the cell where you want the average to appear.
- Enter the Formula
Type
=AVERAGE(into the cell.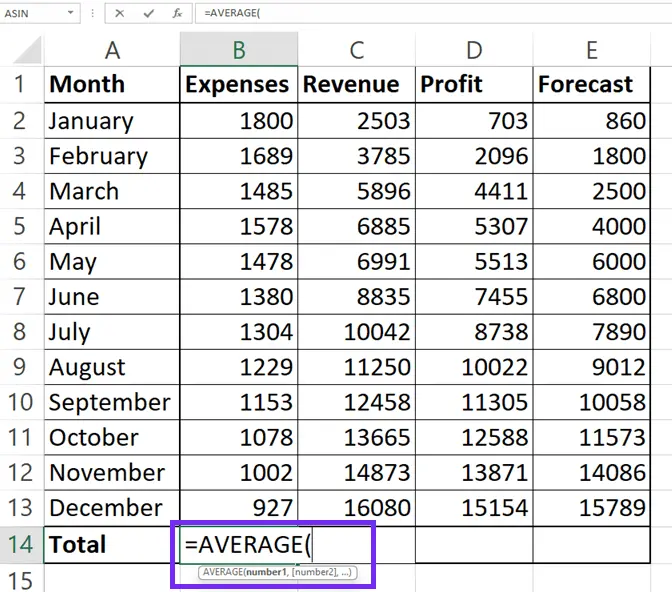
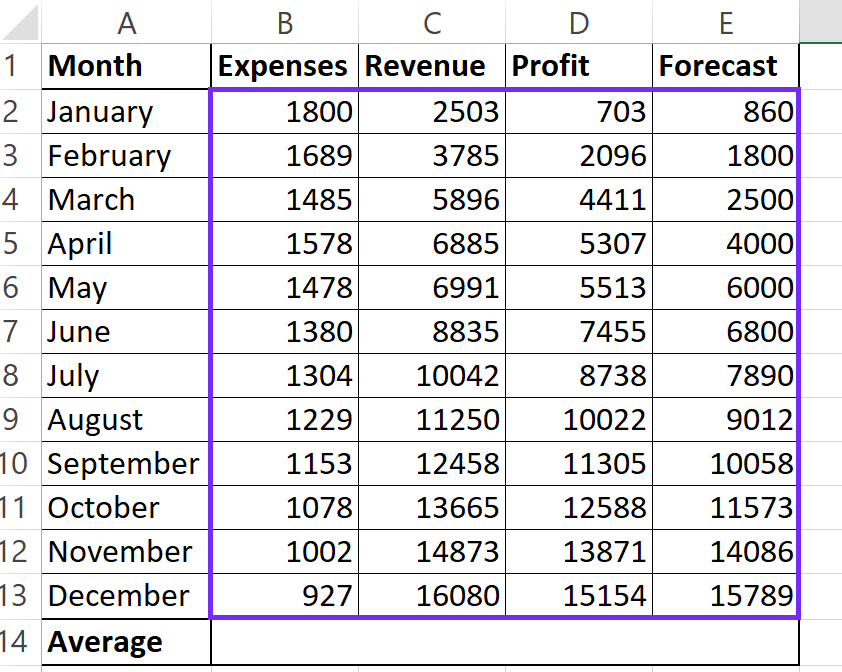
- Insert the range
Select the range of cells containing your data (e.g., A1:A10).
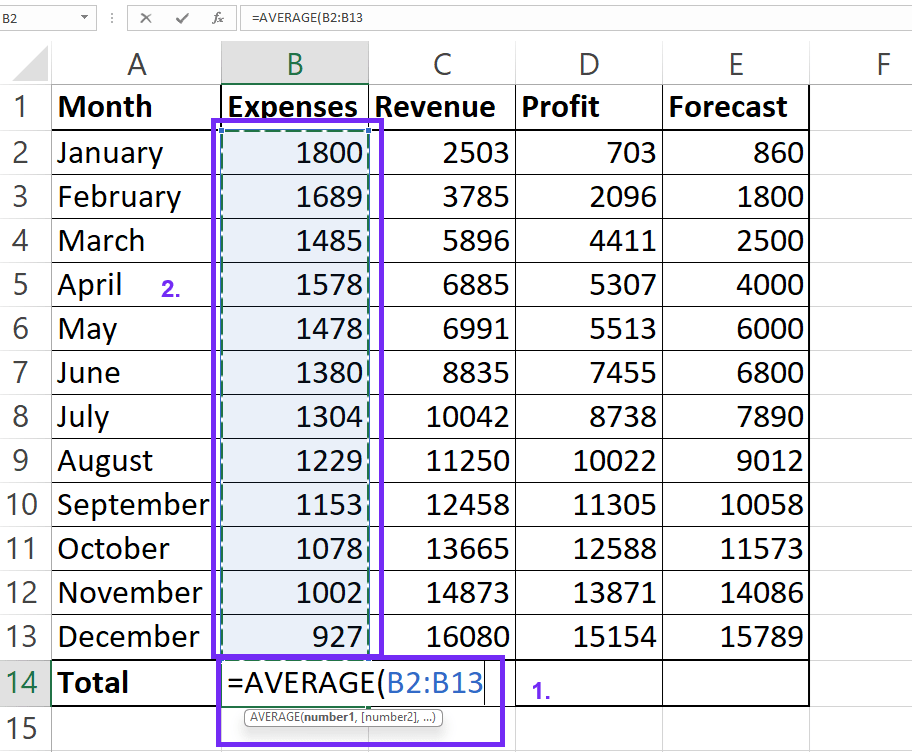
- Close the Parenthesis
Type a closing parenthesis
)to complete the formula.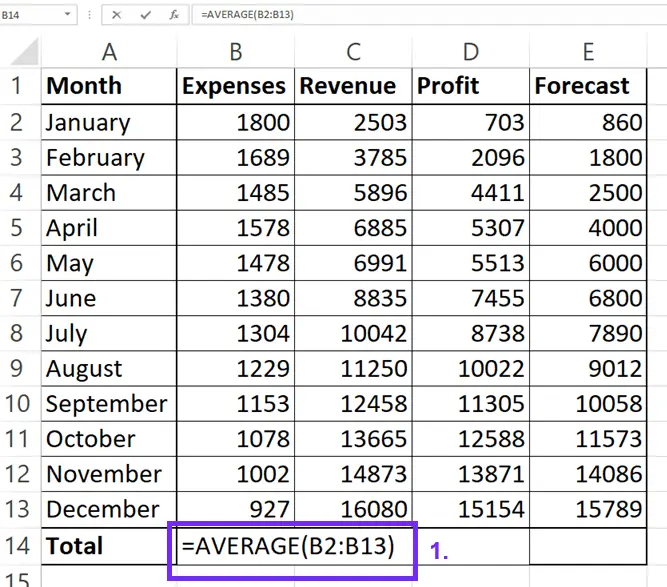
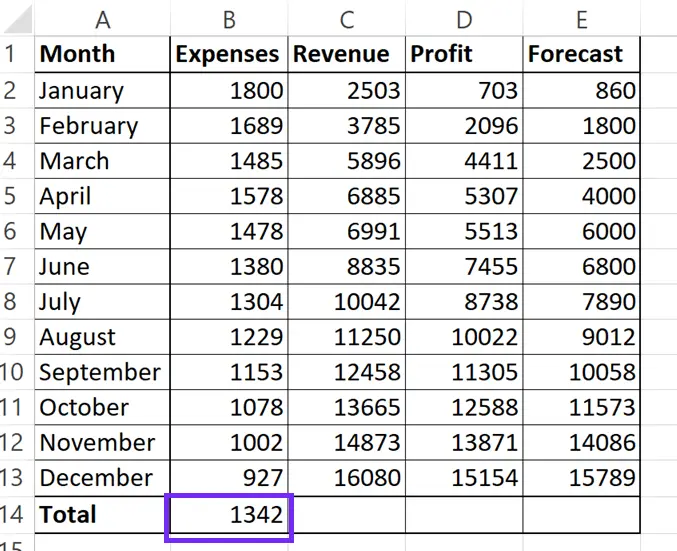
- Press Enter
This applies the basic average formula in Excel. This is the most common way how to find average in excel, and how to find the average on excel.
Calculating Averages Multiple Ranges In Excel
If your data is scattered across your Excel sheet and you need to find the average of multiple ranges or use a non-contiguous range formula, this paragraph provides practical steps to calculate averages across multiple columns, simplifying data analysis.
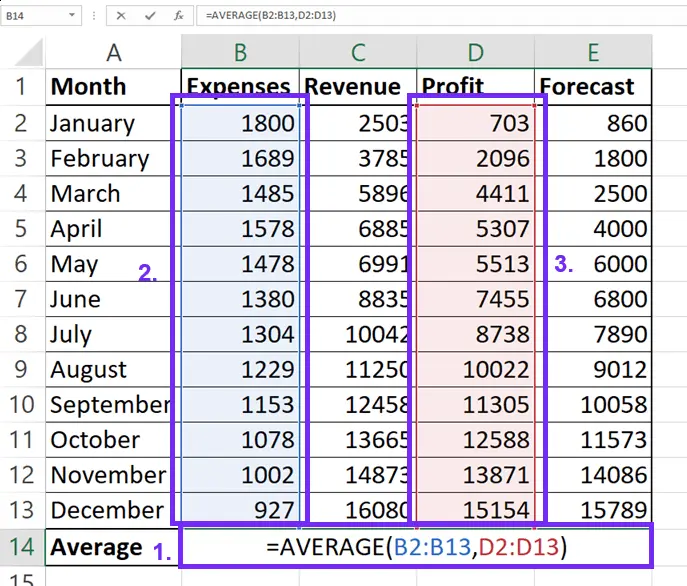
Let’s say you have data in columns A, C, and E, and you want to calculate the average of the values in each row across these non-adjacent columns.
1. Open Your Excel Worksheet: Launch Microsoft Excel and open the worksheet containing your data.
2. Identify the Columns: Locate the columns you want to average (e.g., A, C, E).
3. Choose a Column for the Averages: Select an empty column where you want the averages to appear (e.g., column F).
You might also like: How To Sum A Column In Excel
4. Enter the AVERAGE Function:
- In the first cell of the column you chose (e.g., F1), enter the
AVERAGEfunction, specifying the ranges of the cells you want to average. - For non-adjacent columns, you’ll list each range separated by commas.
- Multiple cells use excel AVERAGE function example:
=AVERAGE(A1,C1,E1)- or if you have larger ranges:
=AVERAGE(A1:A10,C1:C10,E1:E10)
5. Press Enter: Press the Enter key. Excel will calculate the average of the specified cells and display the result in the cell.
Advanced Average Formulas (e.g., AVERAGEIF, AVERAGEIFS)
For example, you want to calculate averages based on specific criteria or multiple criteria in your data. These formulas can help get averages from your data.
You might also like: How To Calculate Revenue Growth Rate: Formula & Examples
#1 Formula: AVERAGEIF (Single Criterion)
This function calculates the average of cells that meet a single criterion. Check the calculated average to ensure it’s accurate. Launch Excel and open the worksheet containing your data.
1. Identify the Data Range and Criteria:
Determine the range of cells you want to evaluate (the “range”). Define the criterion (the condition) that must be met for a cell to be included in the average. Identify the range of cells that contain the values to be averaged (the “average_range”). If this is the same as the range, it can be omitted.
2. Select the Cell for the Average: Choose an empty cell where you want the calculated average to appear.
3. Enter the AVERAGEIF Formula: In the selected cell, enter the AVERAGEIF formula with the following syntax: =AVERAGEIF(range, criteria, [average_range])
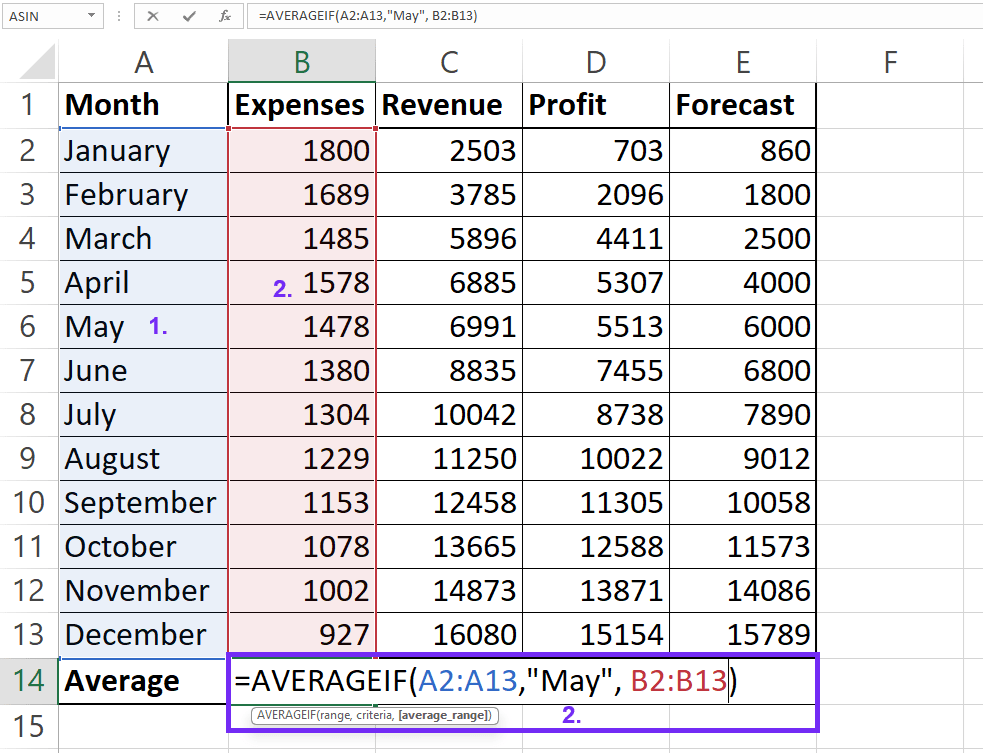
Example: If you want to average values in column B where column A contains “May” and the values to average are in column B, you would enter: =AVERAGEIF(A:A, "May", B:B)
4. Press Enter: Press the Enter key. Excel will calculate the average of the cells in the average_range that meet the specified criterion in the range.
You might also like: How To Add Drop Down List in Excel
#2 Formula: AVERAGEIFS (Multiple Criteria)
AVERAGEIFS function calculates the average of cells that meet multiple criteria. If you want to calculate an average based on several criteria this formula is perfect for you.
1. Identify the Data Ranges and Criteria:
- Determine the range of cells to be averaged (the “average_range”).
- Identify the first range of cells to evaluate (the “criteria_range1”) and the corresponding criterion (the “criteria1”).
- Repeat for any additional ranges and criteria (criteria_range2, criteria2, etc.).
2. Enter the AVERAGEIFS Formula: In the selected cell, enter the AVERAGEIFS formula with the following syntax:
=AVERAGEIFS(average_range, criteria_range1, criteria1, [criteria_range2, criteria2], ...)- Example: If you want to average values in column C where column A contains “May” and column B contains “Project B,” you would enter:
=AVERAGEIFS(C:C, A:A, "May", B:B, "Project B")
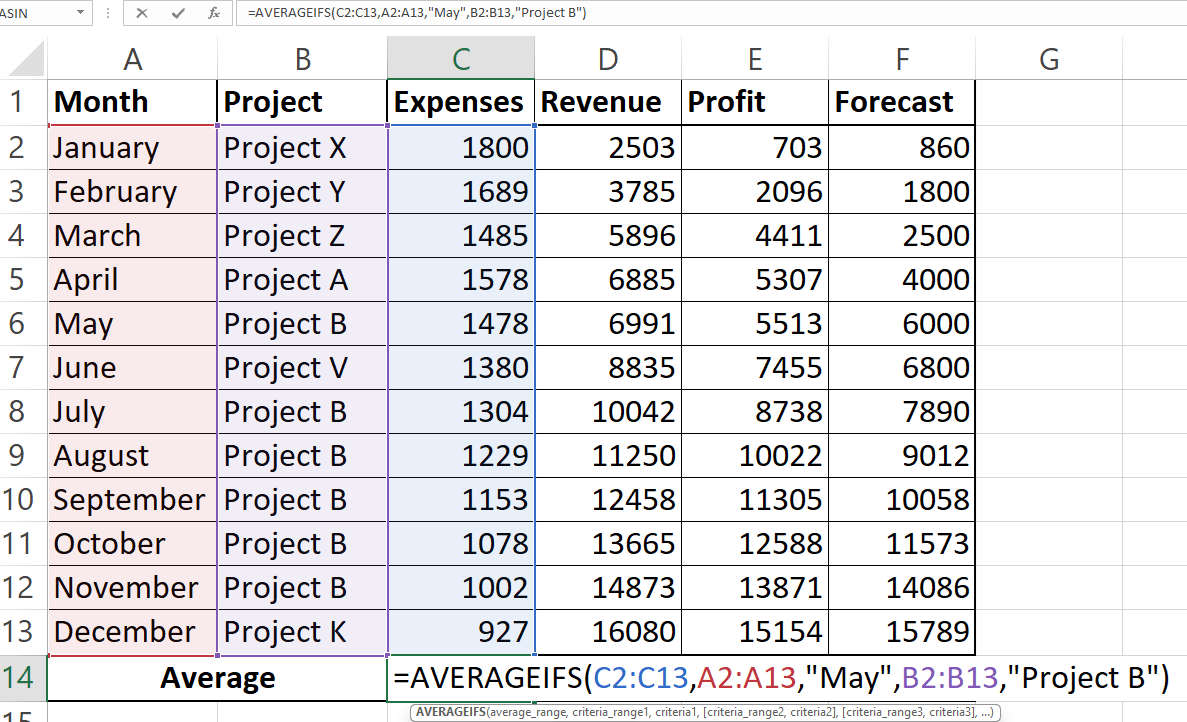
3. Press Enter: Excel will calculate the average of the cells in the average_range that meet all the specified criteria.
You might also like: How To Add Leading Zero in Excel
But there’s a much easier way to calculate averages in a spreadsheet without the need to learn syntax all possible formulas Excel has. Thanks to AI, you can generate formulas from your text and include them easily in sheets 👇
Download the Excel Template With AVERAGE Function
You can always download our free Excel template with ready-made formulas so you don’t have to struggle with function syntax. Check for the download button below 👇
Utilizing the Status Bar (Quick Average)
If you don’t want to write formulas you can use a quick access bar from the Excel toolbar to calculate averages with one button.
1. Select Data: Highlight the cells you want to average.
2. Check the Status Bar: The status bar (located at the bottom of the Excel window) will display the average, count, and sum of the selected cells.
This is a quick way how to find and average data, without needing to enter a formula into a cell.
You might also like: How to Make Bar Chart Bars Wider in Excel
Download Template To Calculate Averages In Excel
Conclusions
In summary, mastering the diverse techniques for calculating averages in Excel can significantly enhance your data analysis capabilities. From understanding the fundamental average formula in Excel and knowing how to find an average.
To efficiently average using excel and grasp the core excel average function, you’ve gained essential skills. When you need to delve deeper, the advanced average formula in excel options, like AVERAGEIF and AVERAGEIFS, provide powerful tools for conditional averaging.
When tackling the challenge of Calculating Averages Across Multiple Columns, you can confidently apply techniques for excel average multiple ranges and utilize the excel non contiguous range formula to accurately summarize scattered data.
FAQ
Use the AVERAGE function and list each range separated by commas within the parentheses. This is how to find average in excel with scattered data.
You can use the AVERAGE function by specifying the ranges of your columns. For example, =AVERAGE(A1:A10, C1:C10, E1:E10) will calculate the average of the specified ranges. This demonstrates how to find and average across multiple columns.
Use the AVERAGE function and include each column range separated by commas within the parentheses. For example, =AVERAGE(A:A, C:C, E:E) will average entire columns A, C, and E. This is a practical example of average using excel across multiple columns.
Speed up your spreadsheet tasks with Ajelix AI in Excel