26 Insurance KPIs & Metrics For Insurance Agencies

Insurance KPIs are metrics insurance companies use to monitor their performance and efficiency. They provide insights into various aspects of the business, from financial health to customer satisfaction.
Insurance agencies operate in a highly competitive market where data is the new gold. To thrive, it’s essential to measure what matters.
This article highlights 26 key performance indicators that insurance agencies should closely monitor. By tracking these metrics, you can identify areas for improvement, optimize operations, and drive growth.
Change the way you work with agentic AI
One-click dashboards,KPI tracking, and AI-powered insights—for work that actually gets done.

What are insurance KPIs?
Insurance KPIs (Key Performance Indicators) are quantifiable metrics insurance companies use to gauge their performance and efficiency. These metrics offer insights into various aspects of the business, from financial health to customer satisfaction.
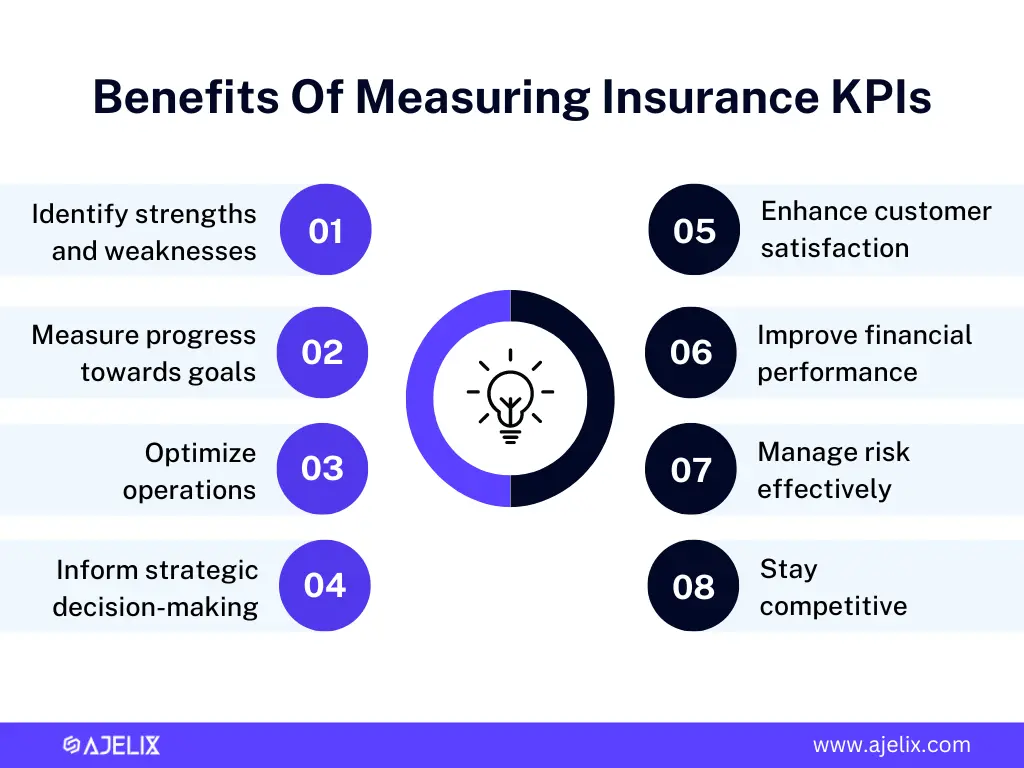
Insurance KPIs are the lifeblood of a successful insurance business. They provide crucial insights into business performance, helping to:
- Identify areas of strength and weakness: Pinpointing high-performing and underperforming areas.
- Measure progress towards goals: Tracking performance against set targets and objectives.
- Optimize operations: Identifying inefficiencies and finding opportunities for improvement.
- Inform strategic decision-making: Providing data-driven evidence to support business choices.
- Enhance customer satisfaction: Understanding customer needs and preferences better.
- Improve financial performance: Assessing profitability and identifying cost-saving measures.
- Manage risk effectively: Identifying potential risks and developing mitigation strategies.
- Stay competitive: Benchmarking performance against industry standards.
26 Most Important Insurance KPIs & Metrics
- Loss Ratio
- Expense Ratio
- Combined Ratio
- Net Profit Margin
- Return on Equity (ROE)
- Solvency Ratio
- Customer Acquisition Cost (CAC)
- Customer Lifetime Value (CLTV)
- Customer Retention Rate
- Net Promoter Score (NPS)
- Claims Processing Time
- Underwriting Cycle Time
- Policy Issuance Time
- First-Notice-of-Loss (FNOL) Processing Time
- Quote-to-Bind Ratio
- Claims Ratio
- Average Payout Per Claim
- Policy Renewal Rate
- Average Time to Settle a Claim
- Claim Frequency
- New Business Written
- Sales Conversion Rate
- Marketing ROI
- Number of Referrals
- Sales Growth
- New Policies per Agent
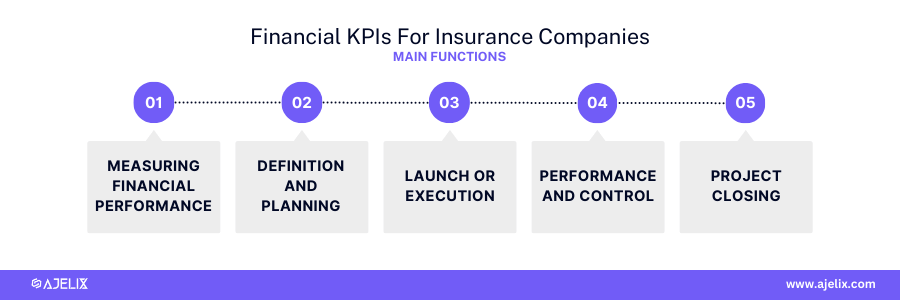
Financial Metrics For Insurance Companies
The primary goal of financial KPIs in the insurance industry is to measure financial performance and health. These metrics provide insights into profitability, efficiency, and overall economic stability.
Main functions of measuring these metrics:
- Measuring Financial Performance: assess the growth, profitability, and overall financial health.
- Monitoring Solvency: evaluate the ability to meet its financial obligations.
- Controlling Expenses: identify cost-saving opportunities and improve operational efficiency.
- Evaluating Investment Performance: measure the returns on investments and asset allocation effectiveness.
- Supporting Strategic Planning: provide data for developing and implementing business strategies.
1. Loss Ratio
- Description: Measures the proportion of premiums paid out in claims.
- Formula: (Incurred Losses + Loss Adjustment Expenses) / Earned Premiums
- Example: If incurred losses and loss adjustment expenses totaled $800,000 and earned premiums were $1,000,000, the loss ratio is 80%.
- Good Score: Lower is better, ideally below 100%, indicating profitability.
2. Expense Ratio
- Description: Compares operating expenses to earned premiums.
- Formula: Operating Expenses / Earned Premiums
- Example: If operating expenses were $200,000 and earned premiums were $1,000,000, the expense ratio is 20%.
- Good Score: Lower is better, indicating efficient operations.
3. Combined Ratio
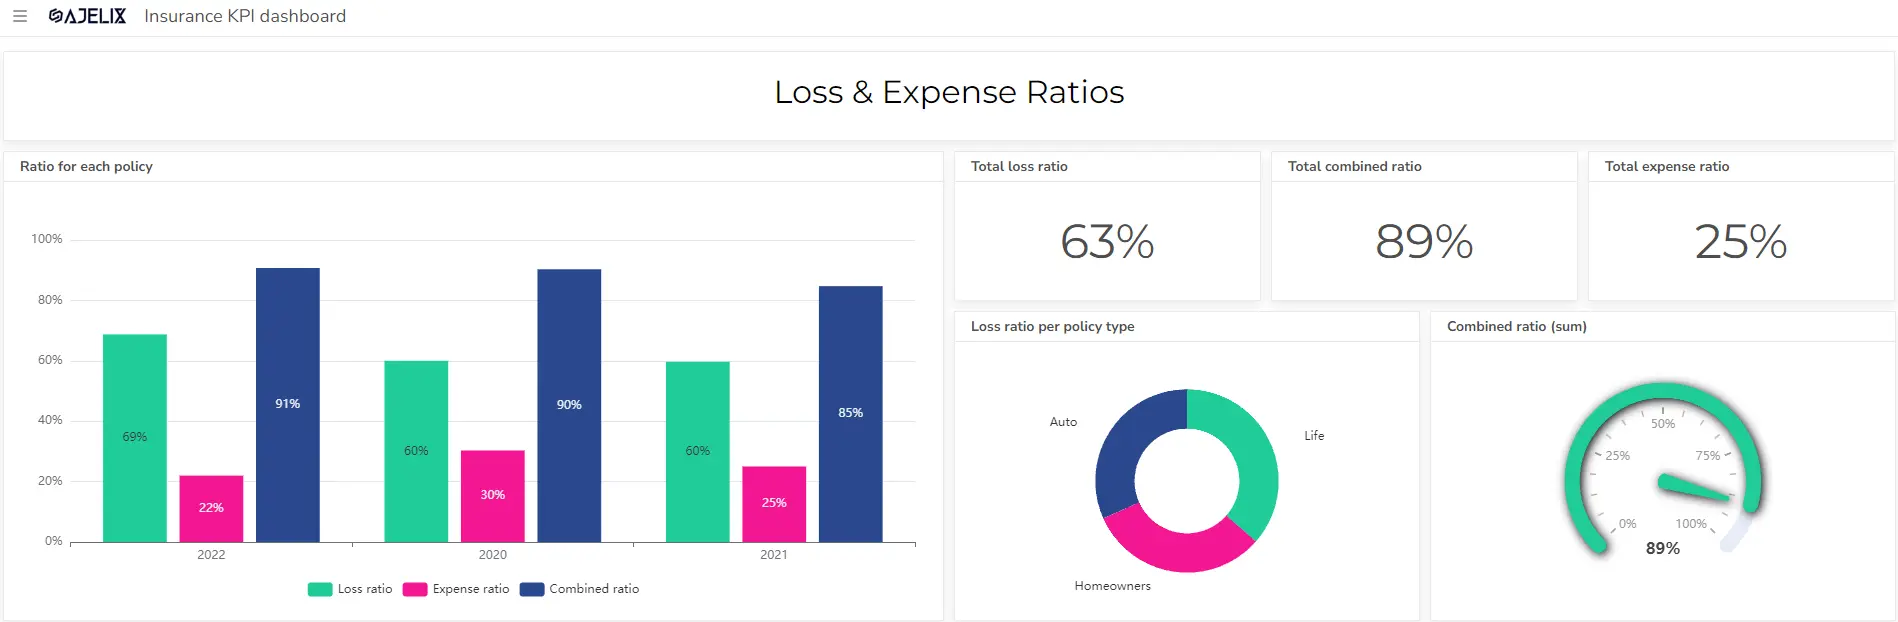
- Description: Combines loss ratio and expense ratio to assess overall profitability.
- Formula: Loss Ratio + Expense Ratio
- Example: If the loss ratio is 80% and the expense ratio is 20%, the combined ratio is 100%.
- Good Score: Lower than 100% indicates underwriting profitability.
4. Net Profit Margin
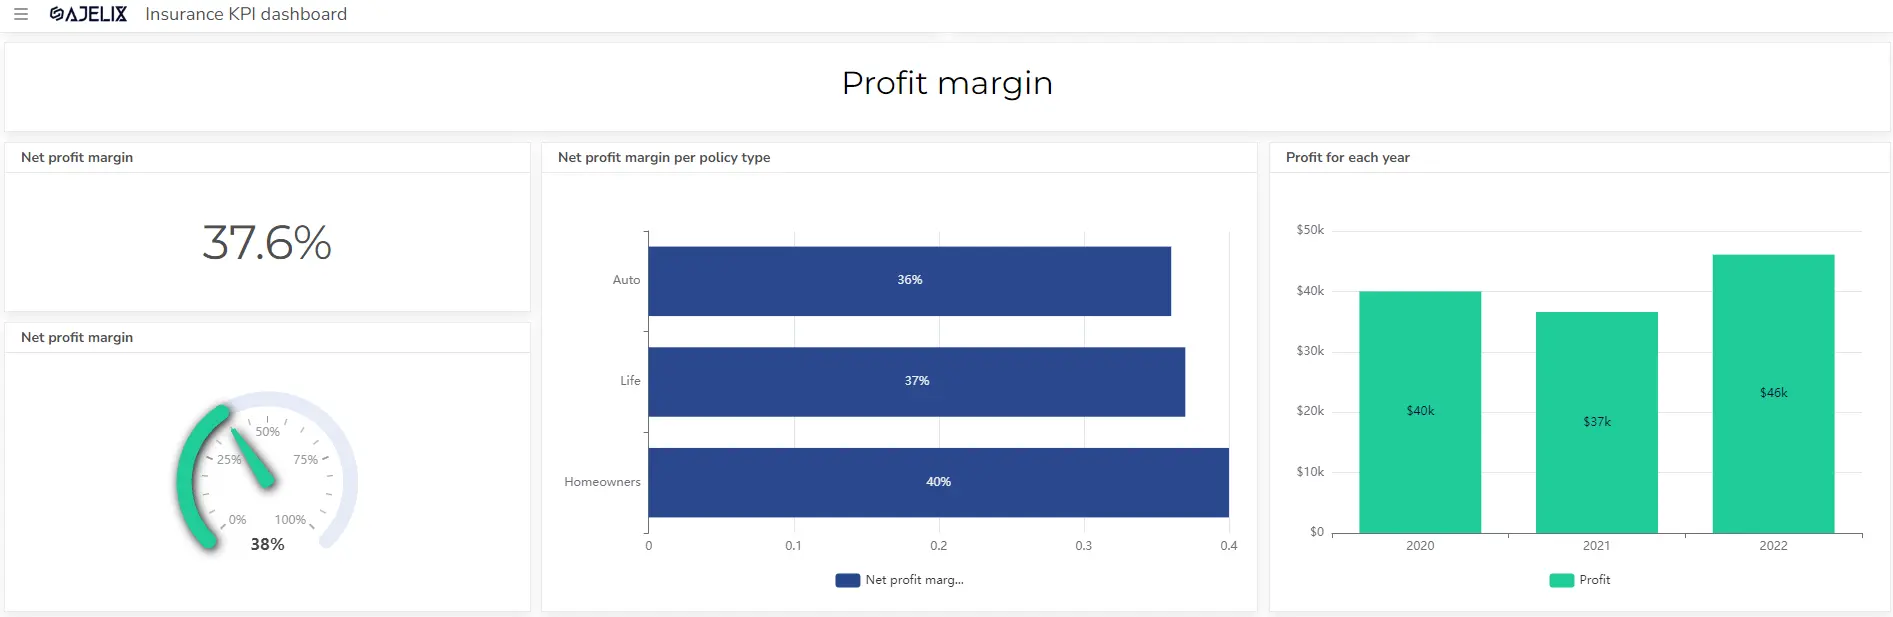
- Description: Indicates the percentage of revenue that turns into profit.
- Formula: Net Income / Total Revenue
- Get this metric using the net profit margin calculator here.
- Example: If net income is $100,000 and total revenue is $1,000,000, the net profit margin is 10%.
- Good Score: Higher is better, indicating strong overall profitability.
5. Return on Equity (ROE)
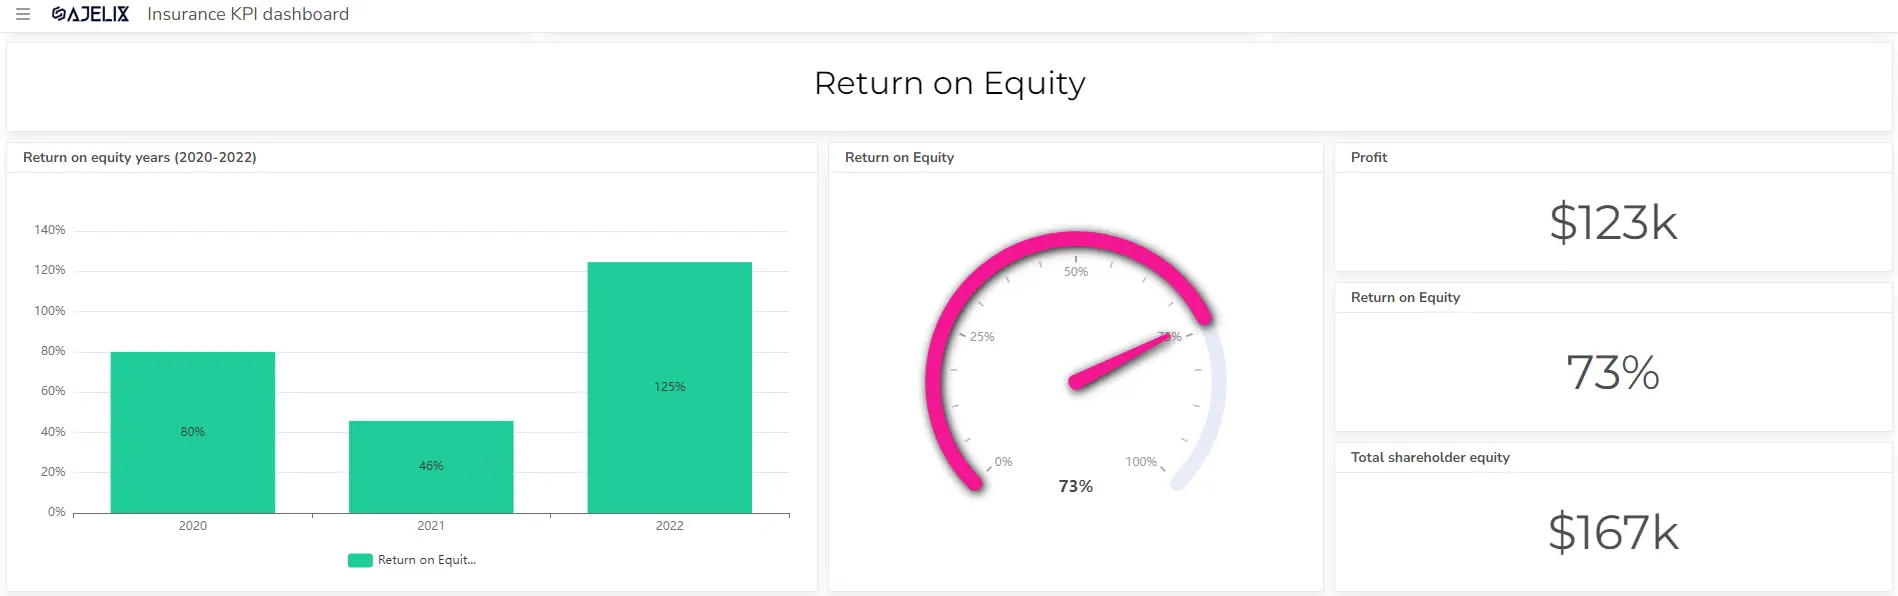
- Description: Measures profitability relative to shareholder investment.
- Formula: Net Income / Shareholders’ Equity
- Example: If net income is $100,000 and shareholders’ equity is $500,000, the ROE is 20%.
- Good Score: Higher is better, indicating strong returns for investors.
6. Solvency Ratio
- Description: Assesses the company’s ability to meet financial obligations.
- Formula: Varies depending on the specific ratio (e.g., Debt-to-Equity Ratio, Current Ratio)
- Example: A debt-to-equity ratio of 1.5 means the company has $1.50 of debt for every $1 of equity.
- Good Score: Depends on the specific ratio and industry standards, but generally a lower debt-to-equity ratio and a higher current ratio indicate better financial health.
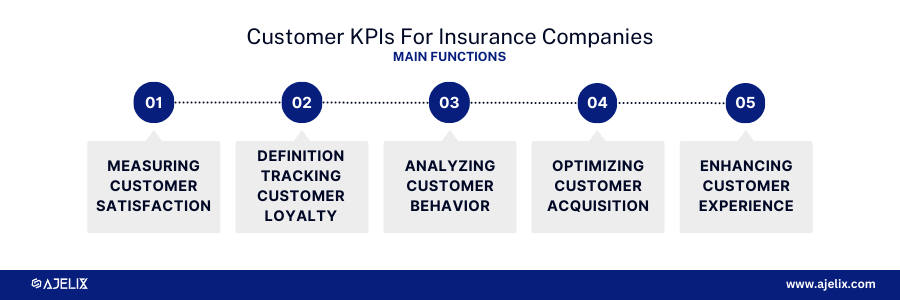
Customer KPIs for Insurance Companies
The primary goal of customer KPIs in the insurance industry is to measure customer satisfaction, loyalty, and the overall customer experience. By tracking these metrics, insurers can identify areas for improvement, enhance customer relationships, and drive long-term growth.
Main functions of tracking customer KPIs:
- Measuring Customer Satisfaction: Assess customer happiness and identify areas for improvement.
- Tracking Customer Loyalty: Evaluate customer retention and advocacy.
- Analyzing Customer Behavior: Understand customer preferences and purchasing patterns.
- Optimizing Customer Acquisition: Evaluate the effectiveness of customer acquisition channels.
- Enhancing Customer Experience: Identify opportunities to improve the customer journey.
7. Customer Acquisition Cost (CAC)
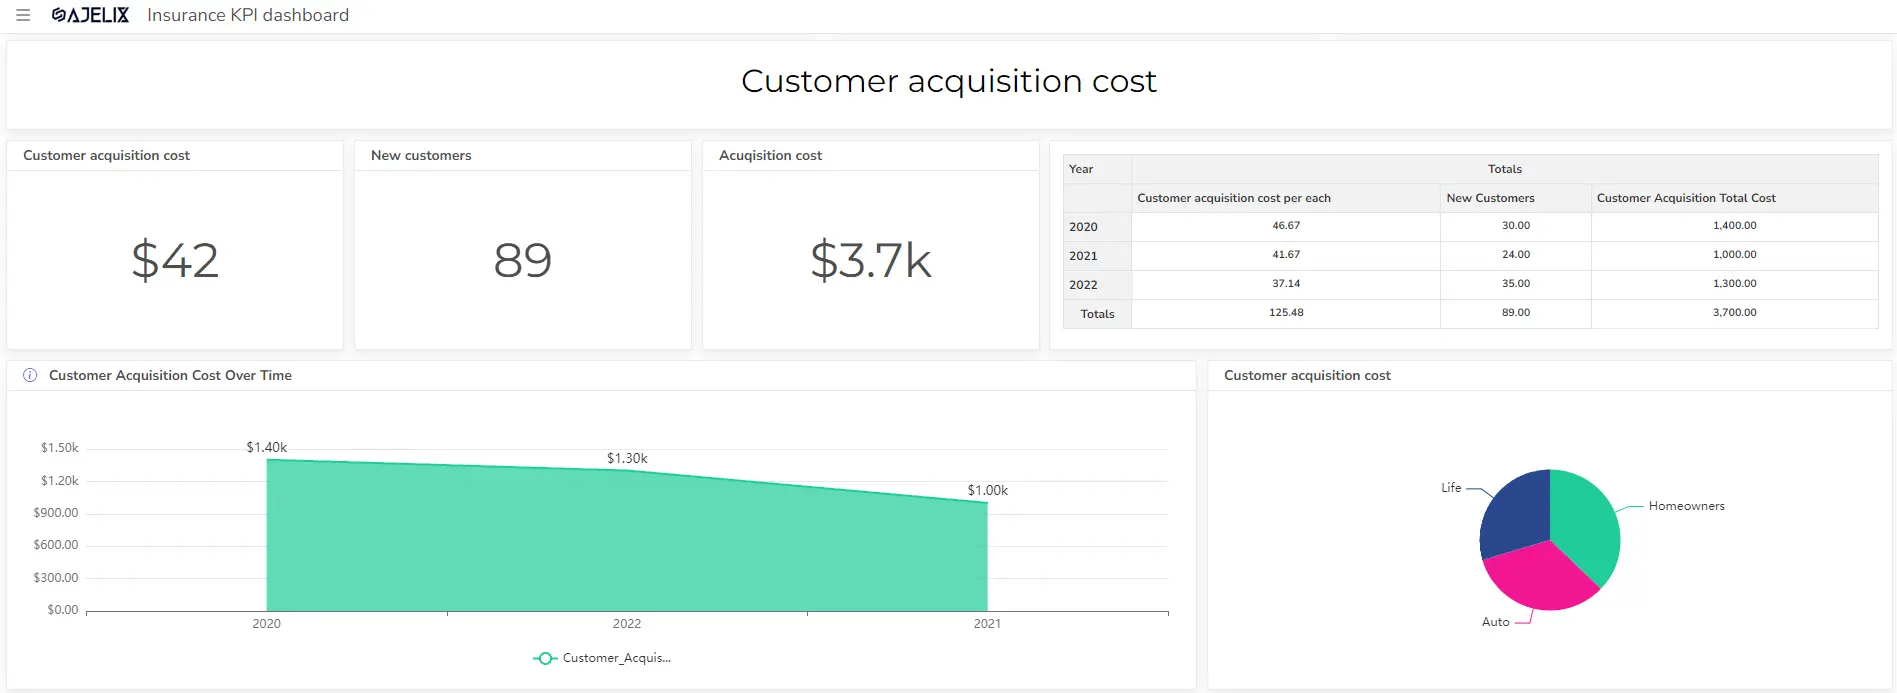
- Description: Measures the cost of acquiring a new customer.
- Formula: Total Cost of Customer Acquisition / Number of New Customers Acquired
- You can calculate this metric using an online customer acquisition cost calculator here.
- Example: If an insurance company spends $10,000 on marketing and acquires 50 new customers, the CAC is $200 per customer.
- Good Score: Lower CAC is generally better, indicating efficient customer acquisition. However, it’s essential to balance CAC with customer quality and lifetime value.
8. Customer Lifetime Value (CLTV)
- Description: Predicts the total revenue a customer will generate throughout their relationship with the company.
- Formula: Average Revenue Per Customer * Customer Lifespan
- Calculate this metric using the customer lifetime value calculator here.
- Example: If the average customer spends $1,000 annually and stays with the company for 5 years, the CLTV is $5,000.
- Good Score: Higher CLTV indicates a strong customer base and long-term profitability.
9. Customer Retention Rate
- Description: Measures the percentage of customers who continue doing business.
- Formula: (Number of Customers at End of Period – Number of New Customers Acquired) / Number of Customers at Beginning of Period
- Calculate this metric using our customer retention rate calculator.
- Example: If a company had 1000 customers at the beginning of the year, acquired 200 new customers, and ended the year with 1100 customers, the retention rate is 90%.
- Good Score: Higher retention rates indicate strong customer satisfaction and loyalty.
10. Net Promoter Score (NPS)
- Description: Measures customer loyalty and satisfaction.
- Formula: Percentage of Promoters – Percentage of Detractors
- Example: If 30% of customers are promoters, 20% are detractors, and 50% are passives, the NPS is 10.
- Good Score: A higher NPS indicates strong customer satisfaction and loyalty. Generally, a score above 0 is considered good, with scores above 50 being exceptional.
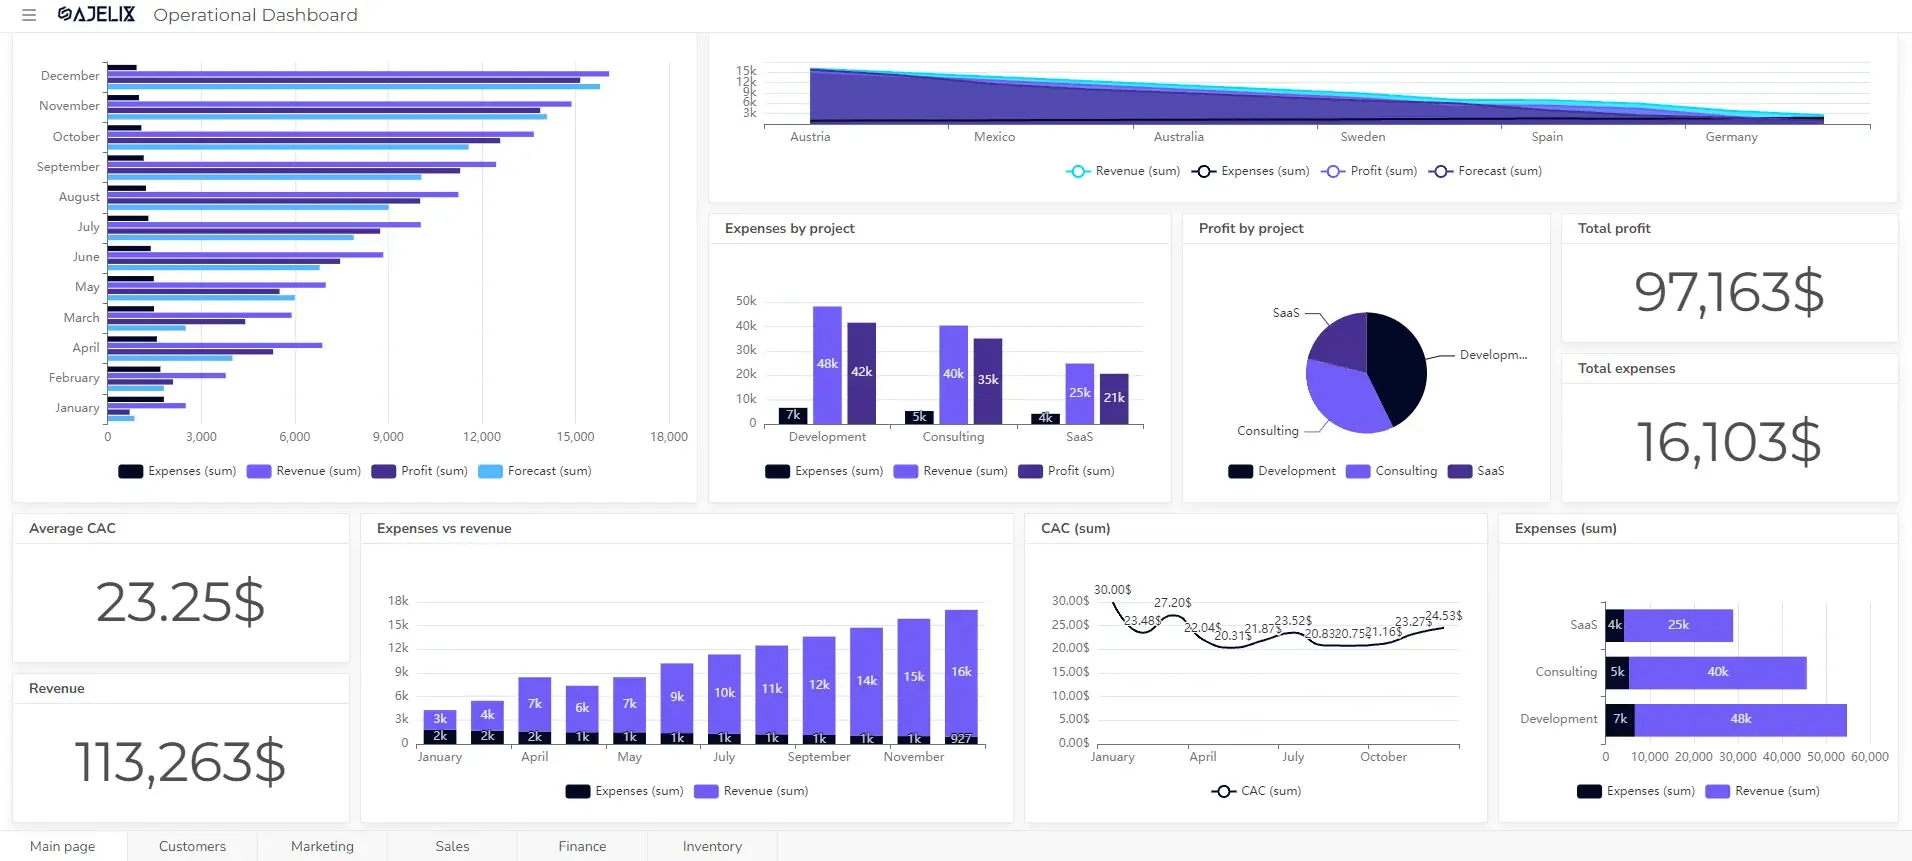
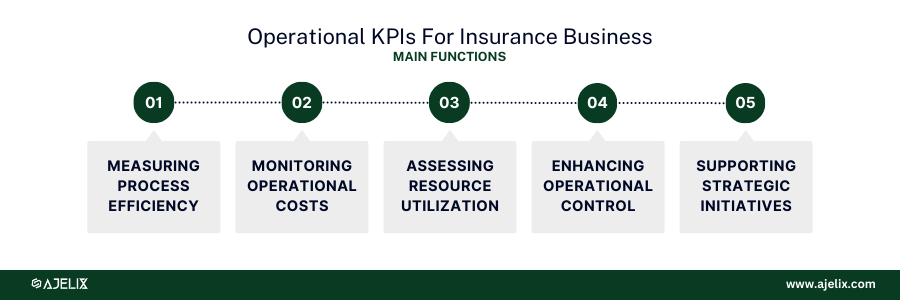
Operational KPIs for Insurance Business
The primary goal of operational KPIs in the insurance industry is to measure the efficiency and effectiveness of internal processes and operations. By tracking these metrics, insurers can identify bottlenecks, improve productivity, and reduce costs.
Main functions of operational KPI tracking:
- Measuring Process Efficiency: evaluate the performance of key operational processes.
- Monitoring Operational Costs: track expenses and identify cost-saving opportunities.
- Assessing Resource Utilization: optimize the use of human and technological resources.
- Enhancing Operational Control: improve process adherence and consistency.
- Supporting Strategic Initiatives: provide data for operational improvements and strategic decision-making. You might also find a valuable guide on how to create an operational dashboard.
11. Claims Processing Time
- Description: Measures the average time taken to process a claim from receipt to settlement.
- Formula: Total time spent on claims / Number of claims processed
- Example: If it took 1000 hours to process 200 claims, the average processing time is 5 hours per claim.
- Good Score: Lower is better, indicating efficient claims handling and improved customer satisfaction.
12. Underwriting Cycle Time
- Description: Measures the average time taken to underwrite a policy from application to issuance.
- Formula: Total underwriting time / Number of policies underwritten
- Example: If it took 500 hours to underwrite 100 policies, the average underwriting cycle time is 5 hours per policy.
- Good Score: Lower is better, indicating efficient underwriting processes and faster policy issuance.
13. Policy Issuance Time
- Description: Measures the time taken to issue a new policy from application approval to policy delivery.
- Formula: Total time to issue policies / Number of policies issued
- Example: If it took 200 hours to issue 50 policies, the average policy issuance time is 4 hours per policy.
- Good Score: Lower is better, improving customer satisfaction and reducing time to revenue.
14. First-Notice-of-Loss (FNOL) Processing Time
- Description: Measures the time taken to process initial claim information from the policyholder.
- Formula: Total time spent on FNOL / Number of FNOLs processed
- Example: If it took 100 hours to process 50 FNOLs, the average processing time is 2 hours per FNOL.
- Good Score: Lower is better, indicating efficient initial claim handling and faster claims settlement.
15. Quote-to-Bind Ratio
- Description: Measures the efficiency of converting quotes into policies.
- Formula: Number of policies issued / Number of quotes generated
- Example: If 50 policies were issued from 100 quotes, the quote-to-bind ratio is 50%.
- Good Score: Higher is better, indicating effective sales and underwriting processes.
16. Claims Ratio
- Description: Indicates the proportion of premiums paid out in claims.
- Formula: Total Claims Paid / Total Earned Premiums
- Example: If claims totaled $800,000 and earned premiums were $1,000,000, the claims ratio is 80%.
- Good Score: Lower is better, as it indicates higher profitability.
17. Average Payout Per Claim
- Description: Measures the average amount paid out for each claim.
- Formula: Total Claims Paid / Number of Claims
- Example: If total claims paid were $1,000,000 and 500 claims were filed, the average payout is $2,000.
- Good Score: Lower is generally better, indicating efficient claims management.
18. Policy Renewal Rate
- Description: Measures the percentage of policies renewed.
- Formula: Number of Renewed Policies / Number of Policies Up for Renewal
- Example: If 800 out of 1000 policies were renewed, the renewal rate is 80%.
- Good Score: Higher is better, indicating strong customer satisfaction and retention.
19. Average Time to Settle a Claim
- Description: Measures the efficiency of the claims process.
- Formula: Total Time Spent on Claims / Number of Claims
- Example: If total time spent on 100 claims was 500 hours, the average time is 5 hours per claim.
- Good Score: Lower is better, indicating faster claim resolution and improved customer satisfaction.
20. Claim Frequency
- Description: Measures the number of claims per policyholder.
- Formula: Number of Claims / Number of Policyholders
- Example: If 100 claims were filed by 1000 policyholders, the claim frequency is 0.1.
- Good Score: Lower is generally better, indicating lower risk.
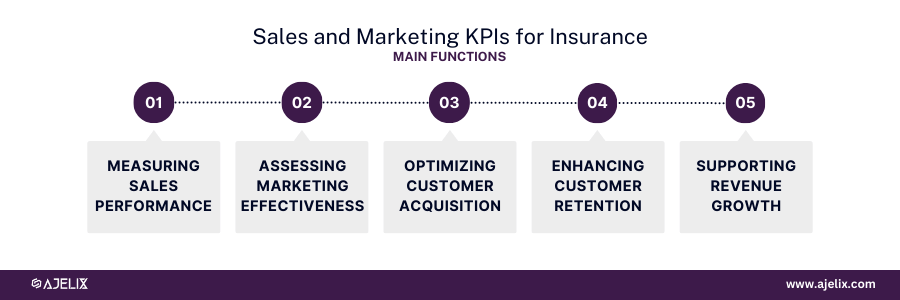
Sales and Marketing KPIs for Insurance
The primary goal of sales and marketing KPIs in the insurance industry is to measure the effectiveness of sales and marketing efforts in generating revenue, acquiring new customers, and retaining existing ones.
Main functions of tracking sales and marketing KPIs
- Measuring Sales Performance: Evaluate sales team productivity and effectiveness.
- Assessing Marketing Effectiveness: Measure the impact of marketing campaigns on revenue.
- Optimizing Customer Acquisition: Improve lead generation and conversion rates.
- Enhancing Customer Retention: Identify opportunities to retain customers.
- Supporting Revenue Growth: Drive sales and increase market share.
21. New Business Written
- Description: Measures the amount of new insurance premiums generated.
- Formula: Total value of new policies written
- Example: $1,000,000 in new premium written
- Good Score: Higher is better, indicating strong sales performance.
22. Sales Conversion Rate
- Description: Measures the effectiveness of converting leads into customers.
- Formula: (Number of closed deals / Number of leads) * 100
- Example: 20% of leads converted into customers
- Good Score: Higher is better, indicating efficient sales processes.
23. Marketing ROI
- Description: Evaluate the return on marketing investments.
- Formula: (Revenue Generated – Marketing Expenses) / Marketing Expenses
- Example: A marketing ROI of 3:1 means for every $1 spent on marketing, $3 in revenue was generated.
- Good Score: Higher is better, indicating effective marketing campaigns.
24. Number of Referrals
- Description: Measures customer satisfaction and loyalty through referrals.
- Formula: Total number of referrals generated
- Example: 150 referrals received
- Good Score: Higher is better, indicating strong customer satisfaction and advocacy.
25. Sales Growth
- Description: Measures the increase in revenue over a specific period.
- Formula: (Current Period Revenue – Previous Period Revenue) / Previous Period Revenue
- Example: If revenue increased from $1,000,000 to $1,200,000, sales growth is 20%.
- Good Score: Higher is better, indicating business expansion.
26. New Policies per Agent
- Description: Measures the productivity of sales agents.
- Formula: Total New Policies / Number of Agents
- Example: If 10 agents sold 100 new policies, the average is 10 new policies per agent.
- Good Score: Higher is better, indicating strong sales performance.
How to create an Insurance KPI Dashboard?
Time needed: 5 hours
Discover how to build a powerful insurance KPI dashboard with our step-by-step guide. Try Ajelix BI for free to see how easy it can be.
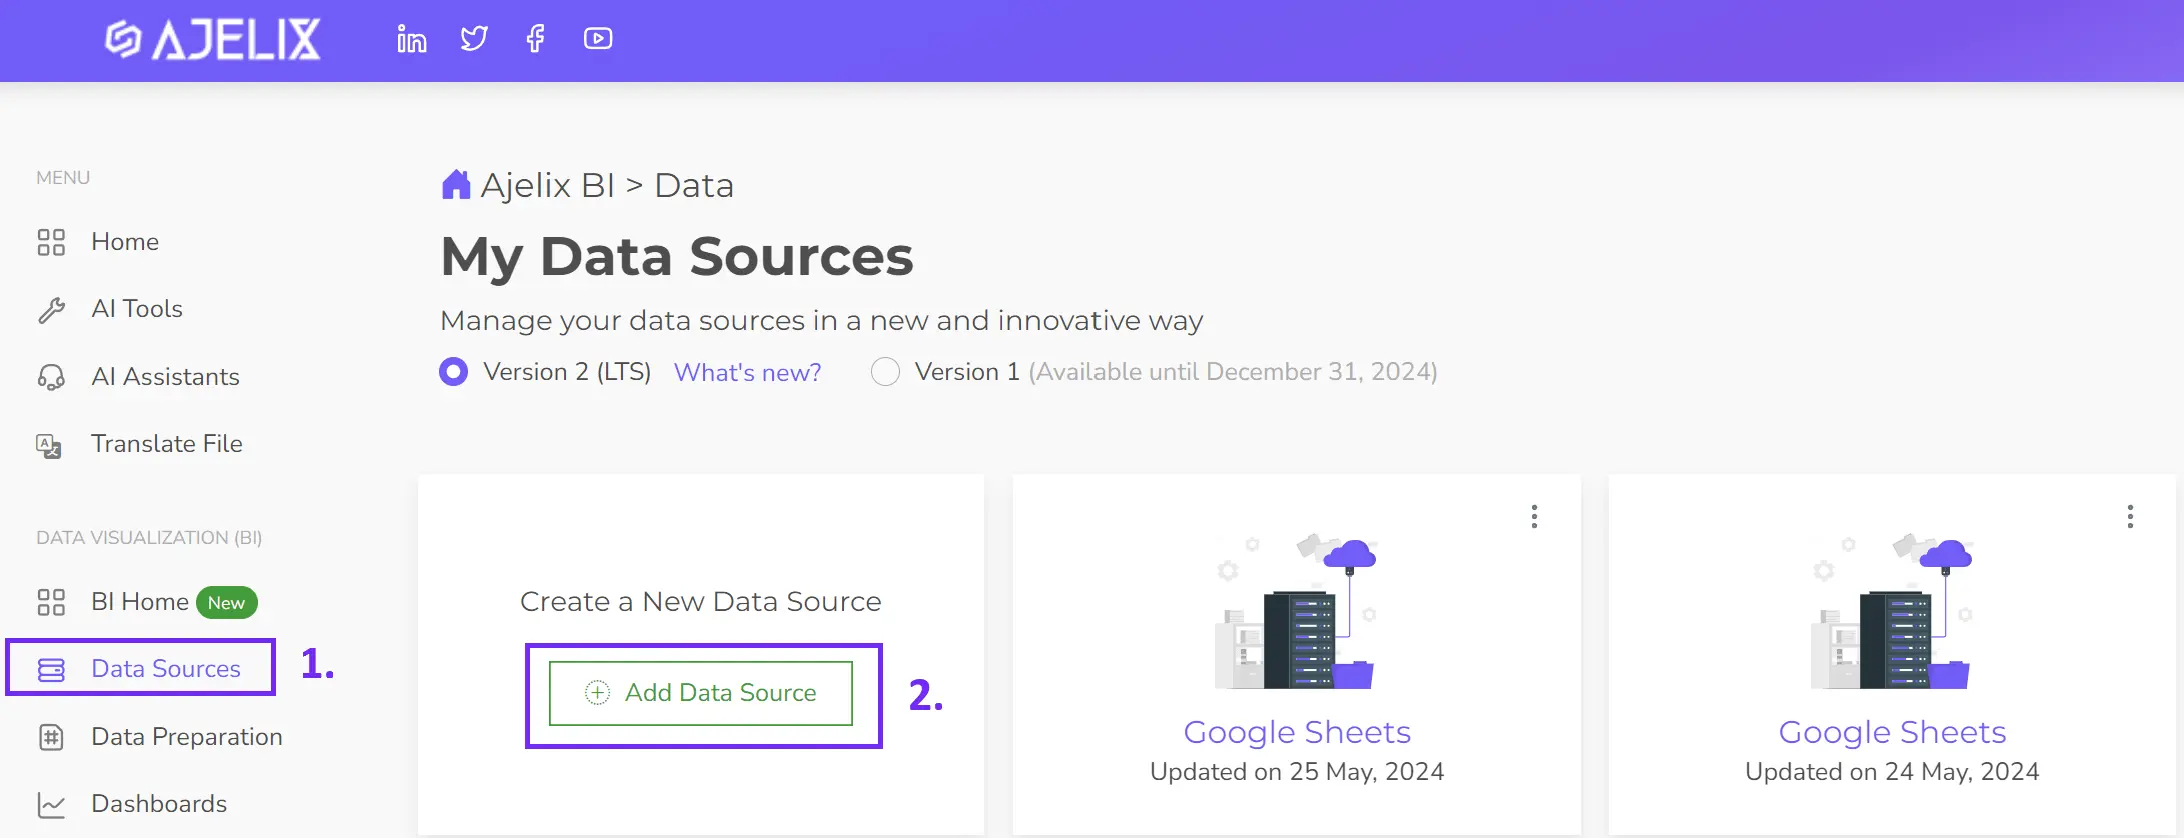
- Connect your data source
The first step to building your digital dashboard is connecting to your data. Easily upload Excel or CSV files, or link to Google Sheets or SQL Server using Ajelix BI.
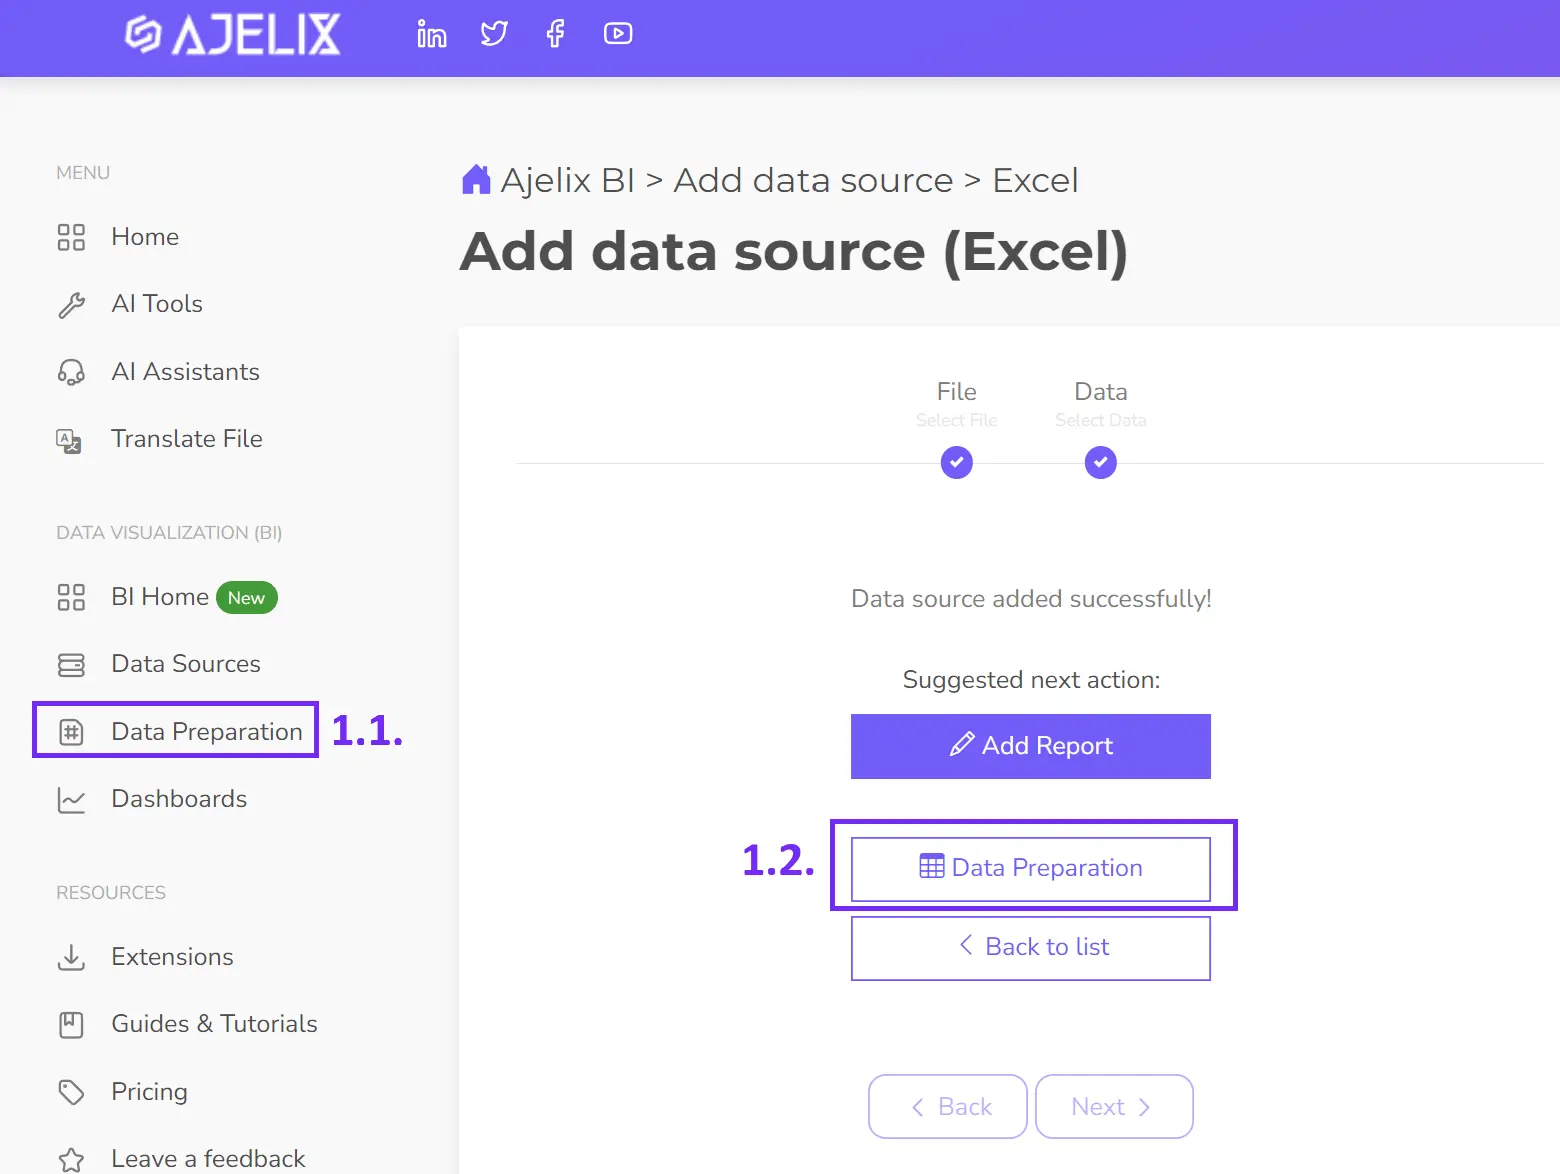
- Clean and transform your data
Before visualizing your data, you can clean and transform it within Ajelix BI. This includes formatting changes and filtering. While optional, it’s highly recommended for accurate and reliable insights.
- Create KPIs
Certain KPIs necessitate custom calculations beyond the capabilities of your data source. This article detailed over 25 essential KPIs readily calculated within Ajelix BI. The accompanying image demonstrates the straightforward KPI creation process through data modeling:
1. Choose the desired data source.
2. Establish a new measure field.
3. Assign a suitable KPI name.
4. Input the calculation formula.
5. Apply the changes.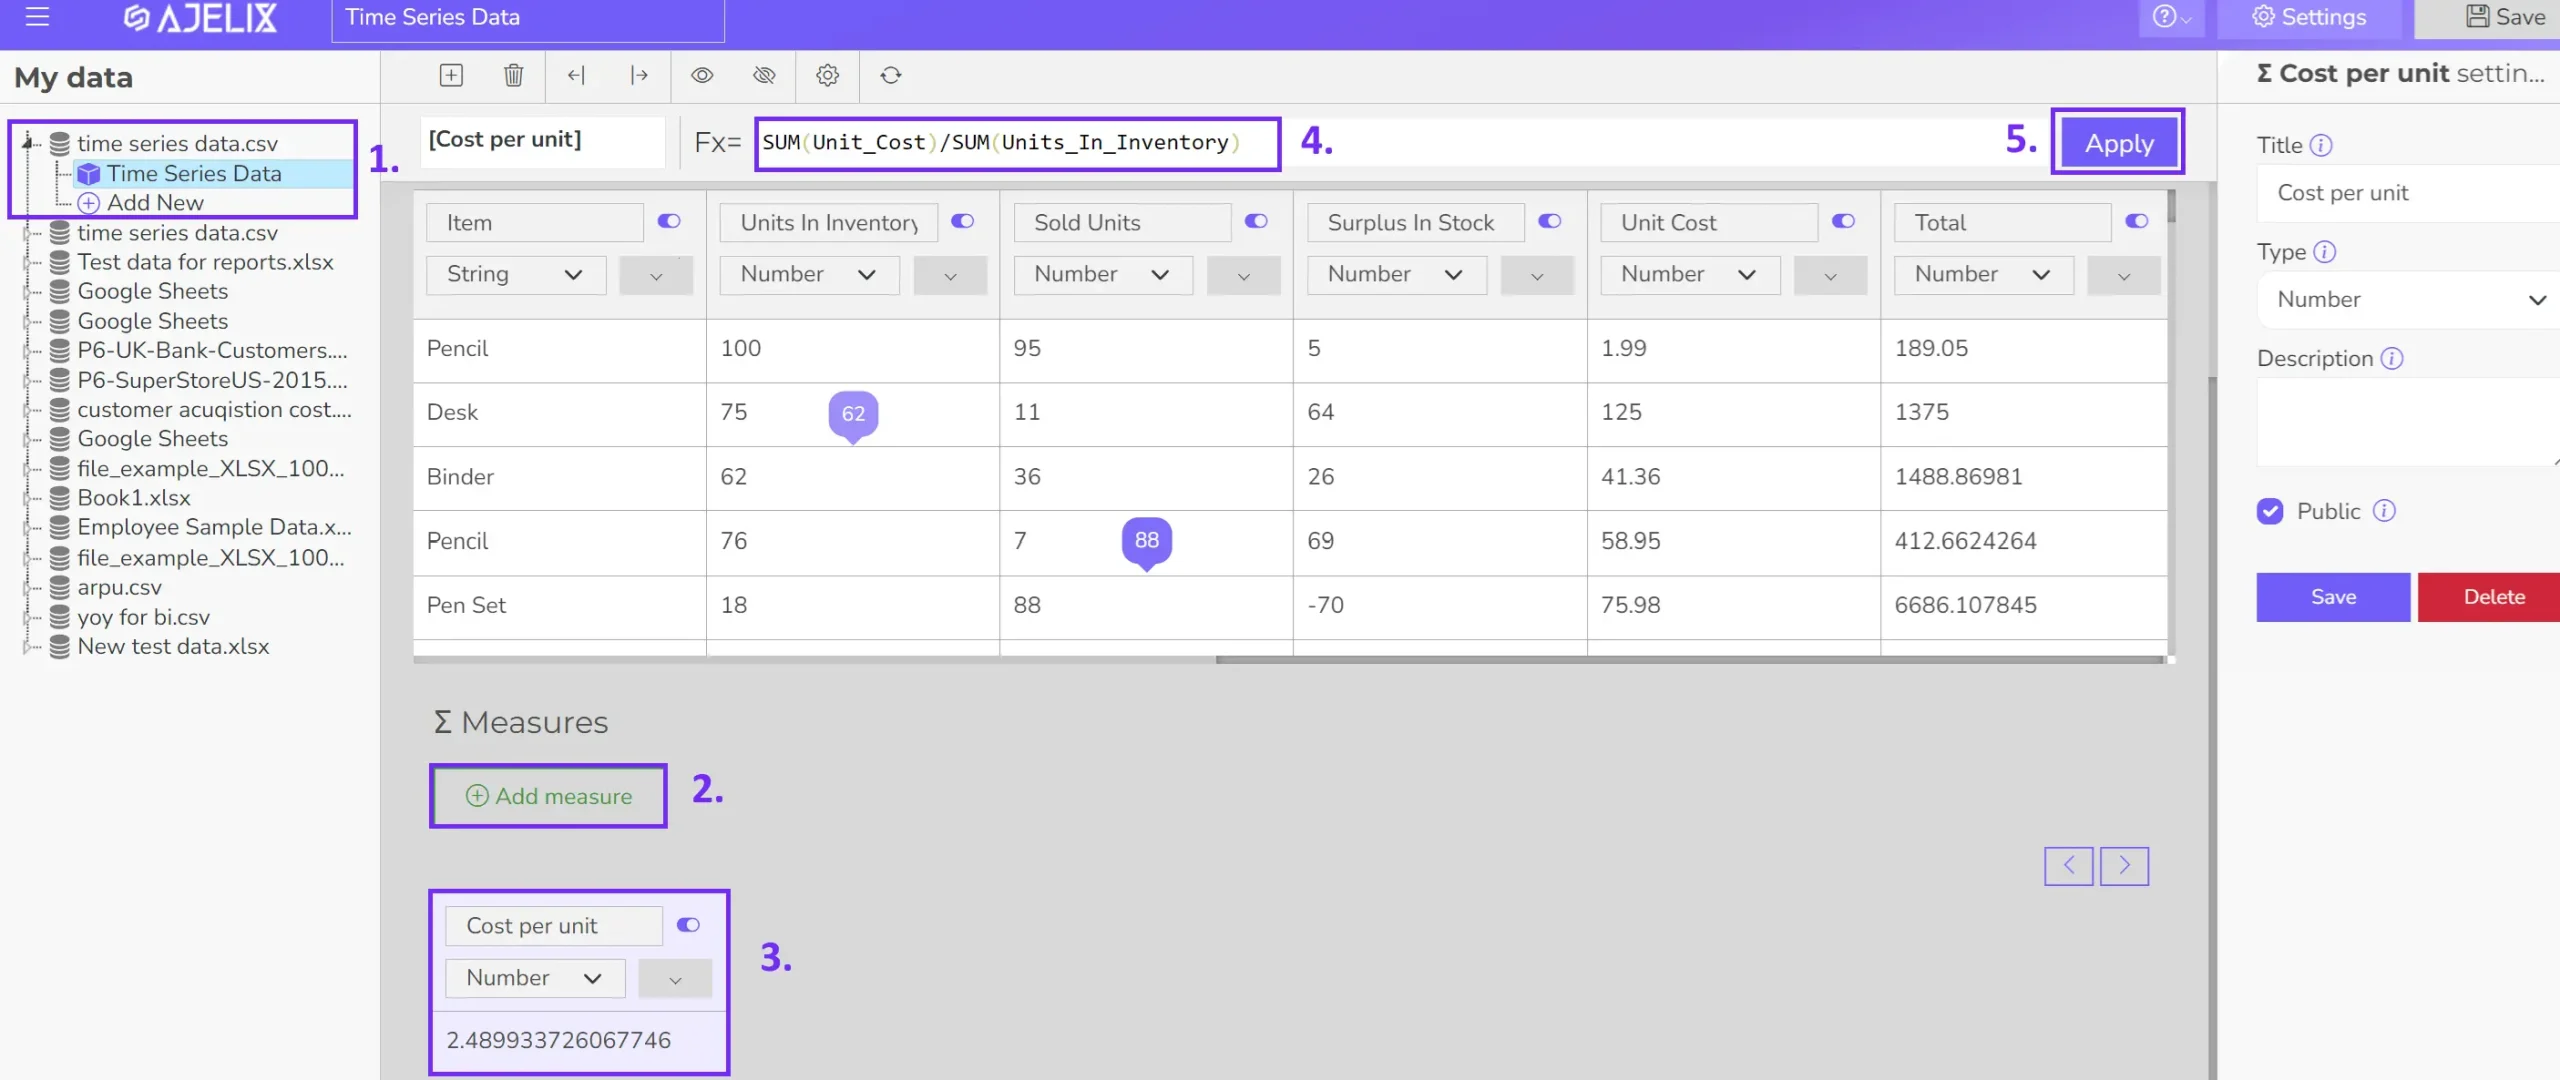
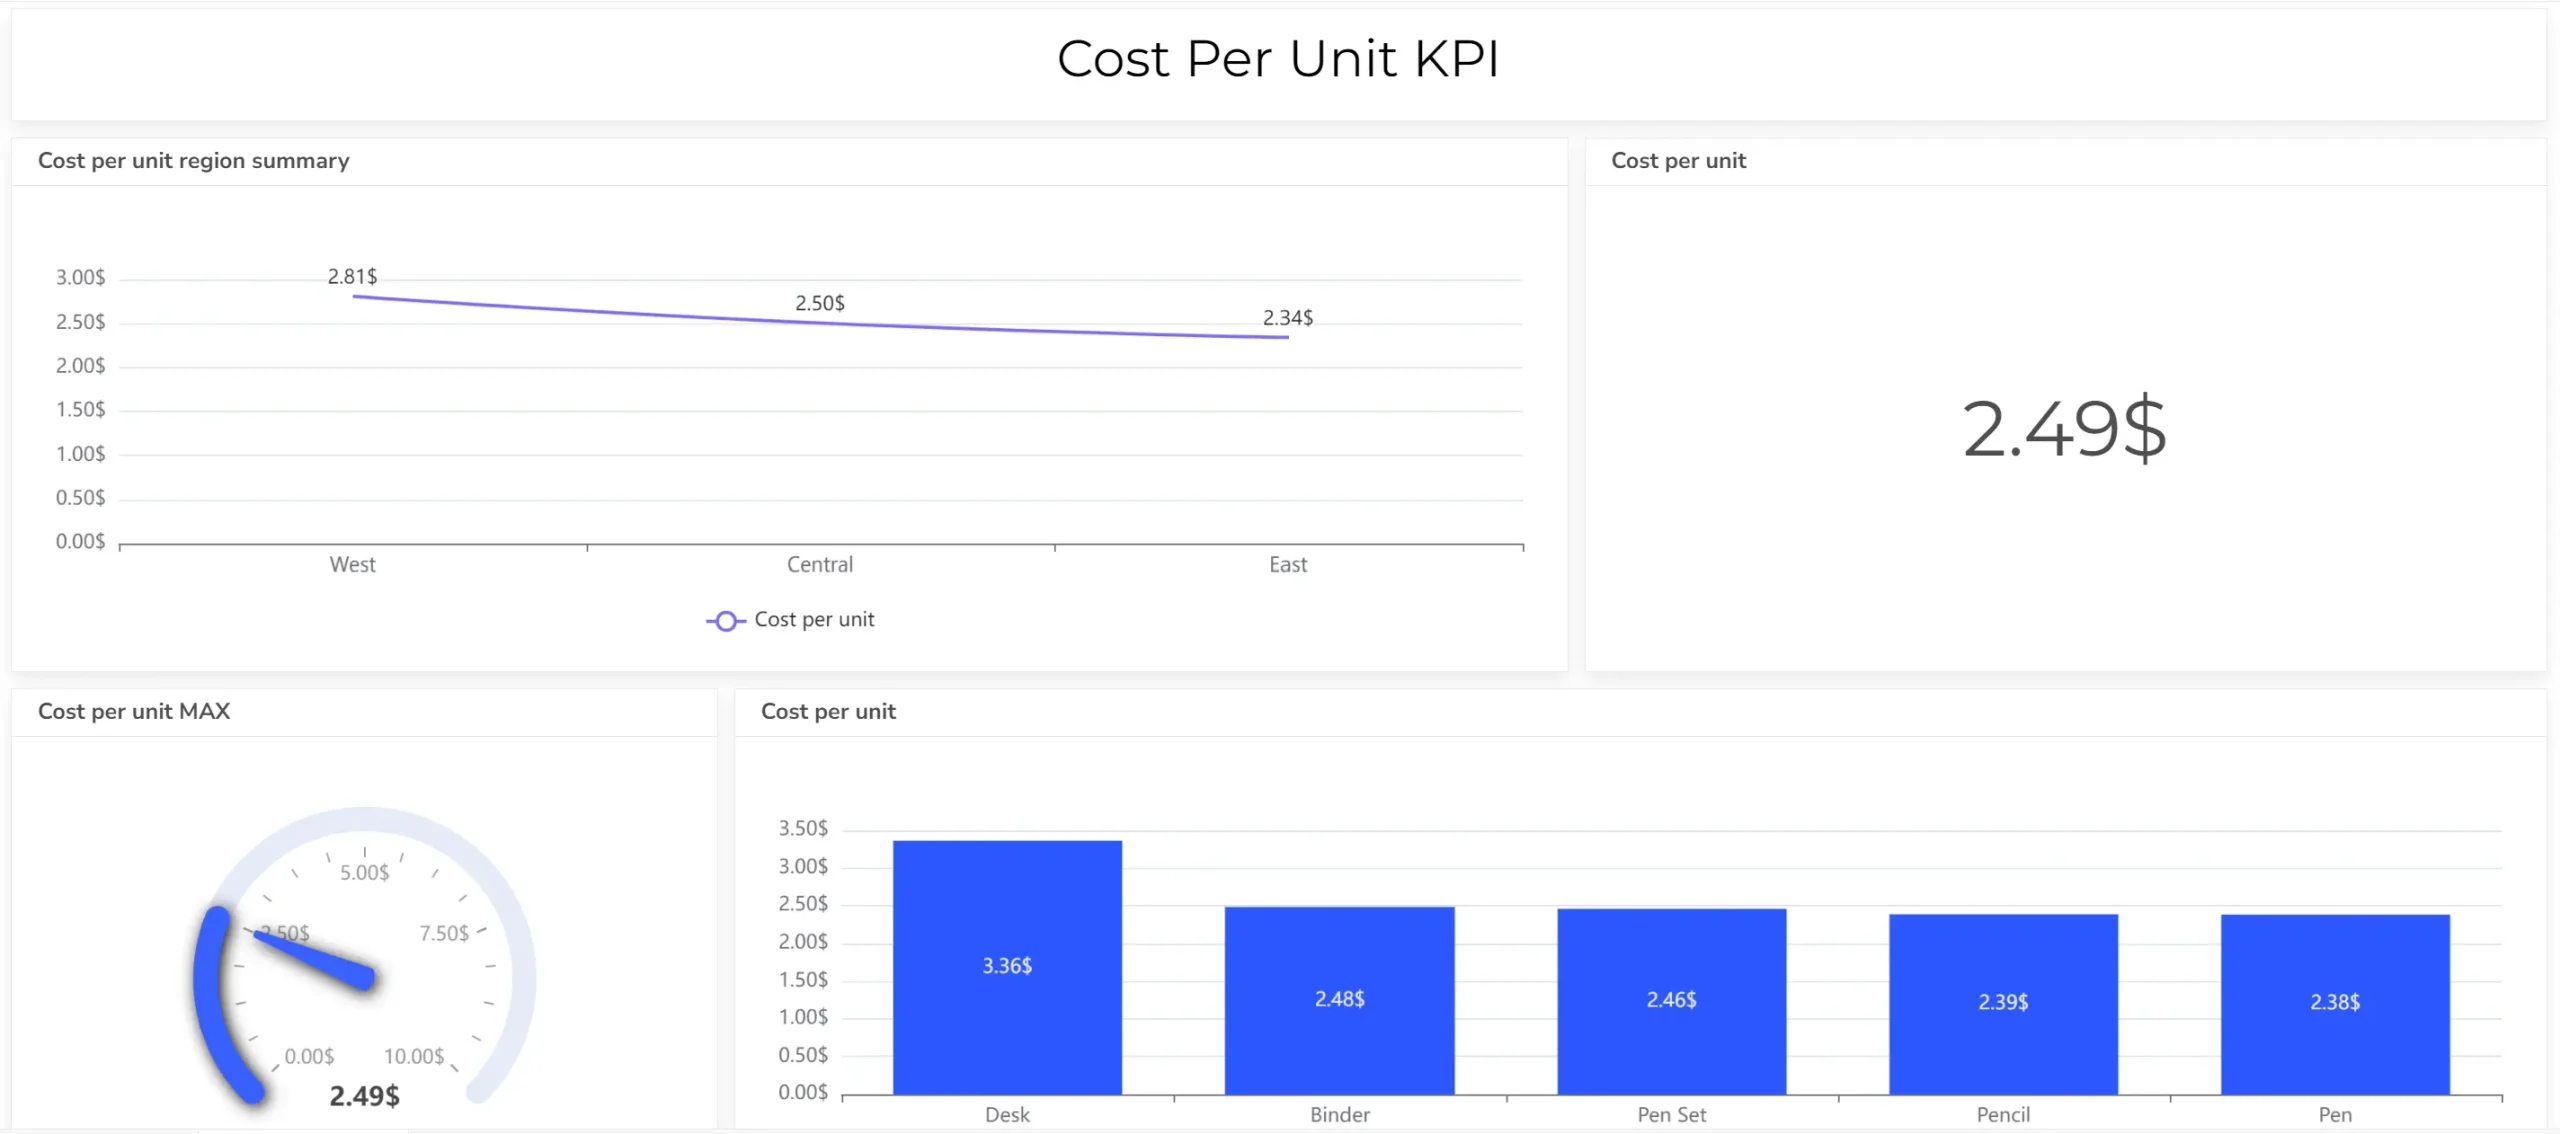
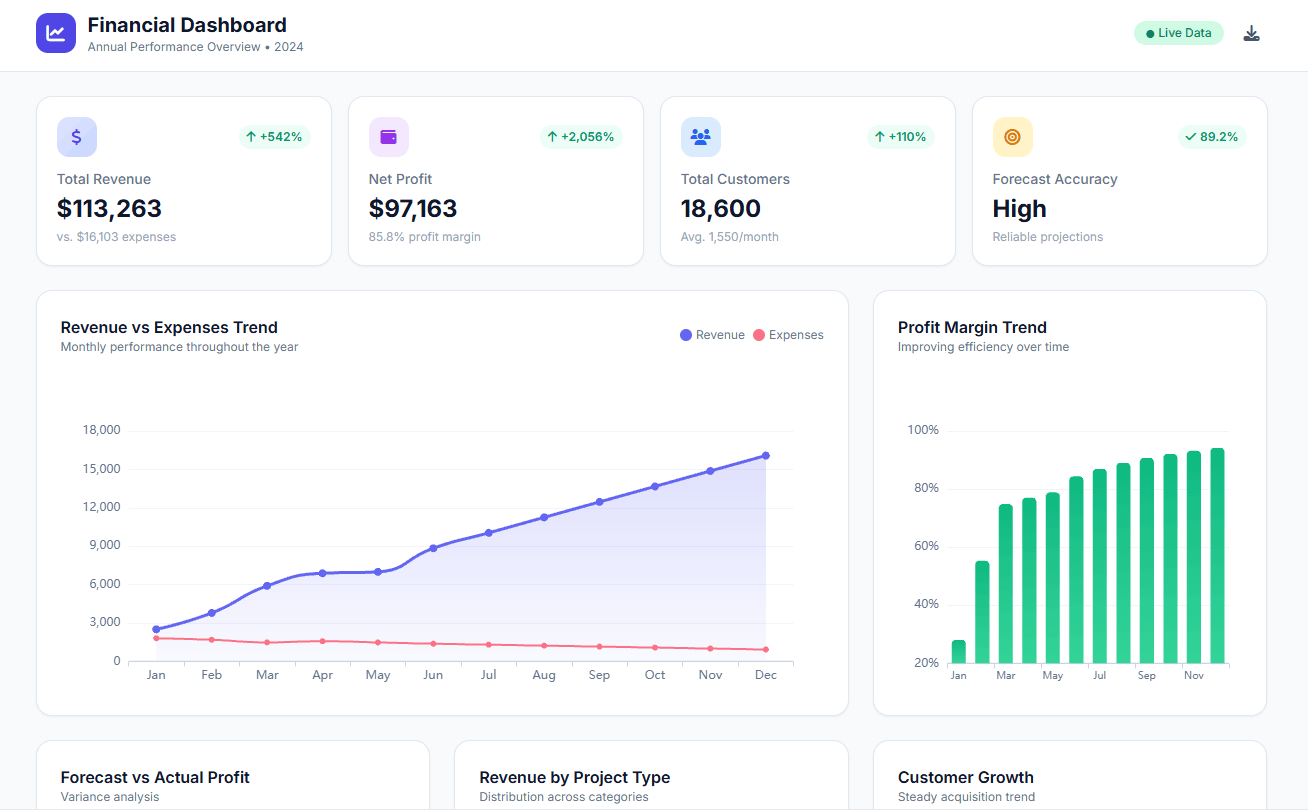
- Build your visualizations
Select the optimal chart type for each KPI (card, gauge, line graph, etc.). Easily populate charts with data by clicking on corresponding data columns. Alternatively, let Ajelix BI’s AI automatically generate charts based on your data.
- Customize your dashboard
Add titles, descriptions, and format the layout for clarity and visual appeal.
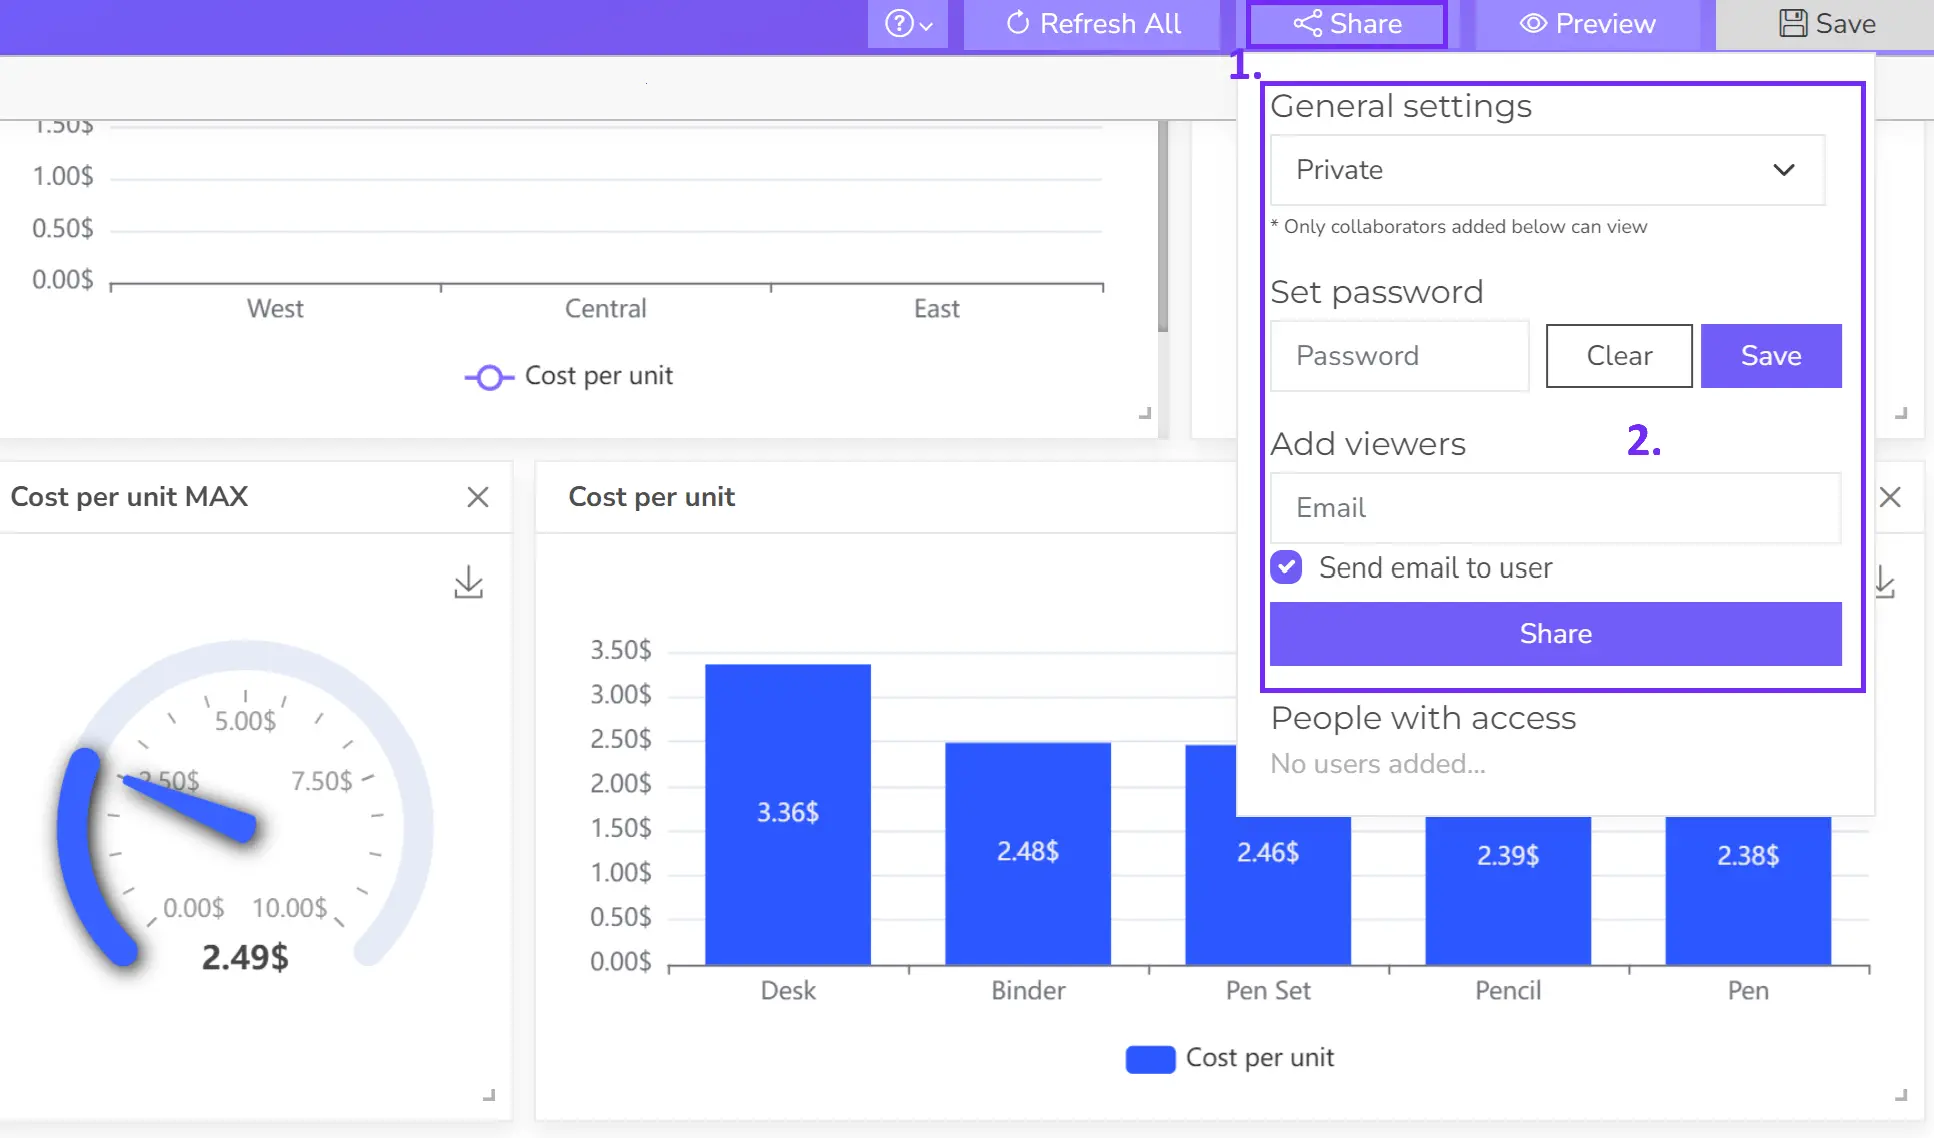
- Share your dashboard
Once happy, publish your dashboard and share it with relevant users for real-time insights.
Struggling with manual calculations & tiring setups?
Let agentic AI do the heavy lifting.
Start free
Fast sign up & easy setup
Tools for KPI tracking
The choice of a KPI tracking tool depends on several factors, including the complexity of your KPIs, the size of your organization, your budget, and your technical expertise. Here are some popular options:
Business Intelligence (BI) and Data Visualization Tools
- Ajelix BI: User-friendly visualization tool with KPI creation capabilities
- Tableau: Powerful data visualization tool for creating interactive dashboards.
- Power BI: Microsoft’s cloud-based business intelligence service.
- Qlik Sense: Offers in-memory data processing for rapid analysis.
- Looker: Cloud-based data exploration and visualization platform.
Dedicated KPI Tracking Software
- SimpleKPI: Offers user-friendly dashboards and reports with a focus on ease of use.
- Geckoboard: Provides live KPI tracking dashboards with a drag-and-drop interface.
- Databox: Offers data import from various sources and customizable dashboards.
- Scoro: Combines project management and KPI tracking for a comprehensive overview.
- ClickUp: A project management tool with robust KPI tracking capabilities.
Spreadsheet Software (for smaller teams or simple KPIs)
- Microsoft Excel: Offers basic data analysis and visualization capabilities.
- Google Sheets: Cloud-based spreadsheet with collaboration features.
Reporting gives you a headache?
Upload your data and create professional reports with agentic AI

Start free
Try free and upgrade whenever
FAQ
Start by identifying your agency’s specific goals and objectives. Then, select KPIs that align with these goals and provide actionable insights. Consider your agency’s size, type of insurance, and target market when making your choices.
Loss ratio measures the proportion of premiums paid out in claims, while expense ratio compares operating expenses to earned premiums. Both are crucial for assessing profitability.
The ideal customer retention rate varies by insurance type and market. However, generally, a higher retention rate indicates strong customer satisfaction and loyalty.
Use data visualization tools to create a dashboard that displays key metrics in a clear and concise format. Consider using a combination of charts, graphs, and tables to present the data effectively.
From data to report in one minute or less with Ajelix BI