15 Accounting KPIs For Your Accounting Department
Accounting KPIs are measurable metrics that track the performance of an accounting department and finances. These metrics help accountants assess efficiency, accuracy, and how well the business is meeting financial goals.
There are different KPIs for accounting functions, but some common ones focus on cash flow, processing times, and how quickly invoices get paid.
You will find 15 accounting KPIs that can help you track the accounting department’s strengths and weaknesses and financial metrics. We’ll explore metrics that track cash flow, process speed, error rates, and more, giving insights you need to optimize your accounting function and drive its success.
Change the way you work with agentic AI
One-click dashboards,KPI tracking, and AI-powered insights—for work that actually gets done.

What Are Accounting KPIs?
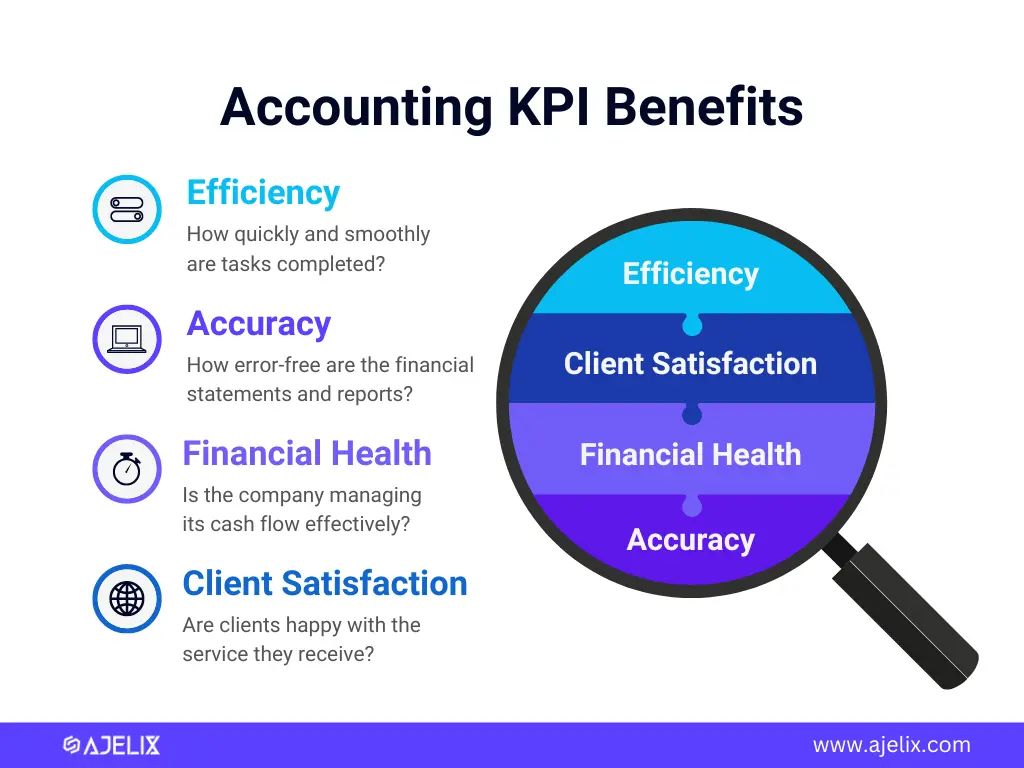
Accounting KPIs, or Key Performance Indicators, are quantifiable measurements used by accounting teams to assess their performance and effectiveness. They act like digital dashboards providing insights into various aspects of the accounting function, including:
- Efficiency: How quickly and smoothly are tasks completed? (e.g., processing invoices, closing the books)
- Accuracy: How error-free are the financial statements and reports?
- Financial Health: Is the company managing its cash flow effectively?
- Client Satisfaction (for accounting firms): Are clients happy with the service they receive?
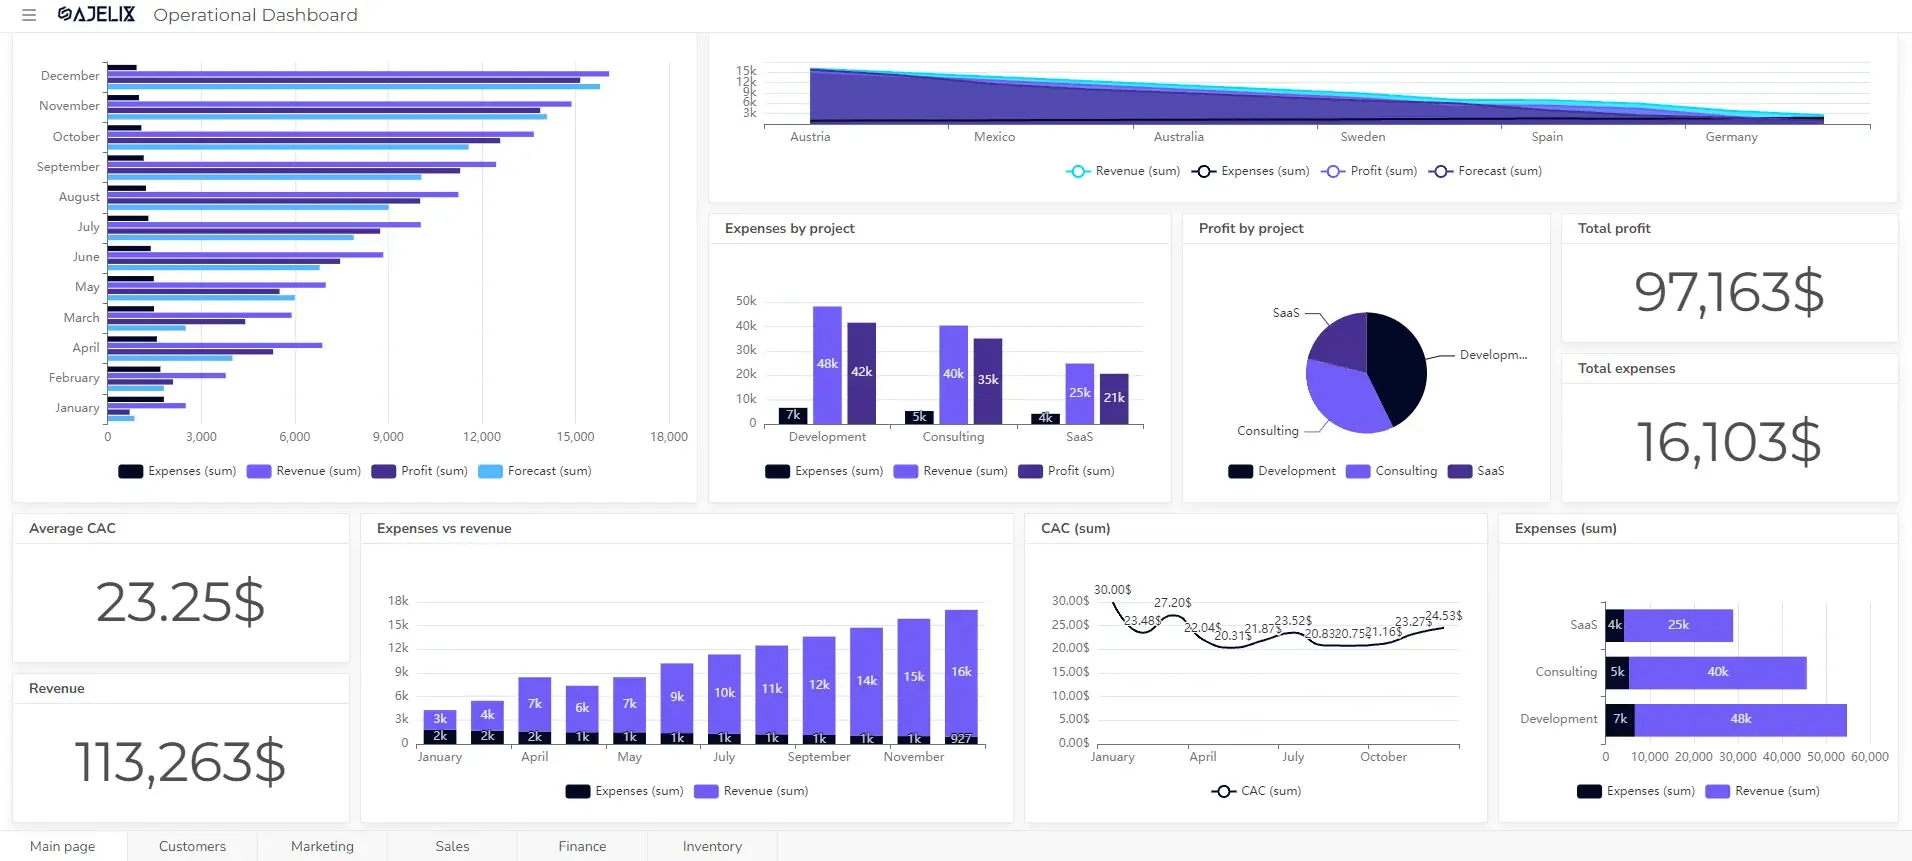
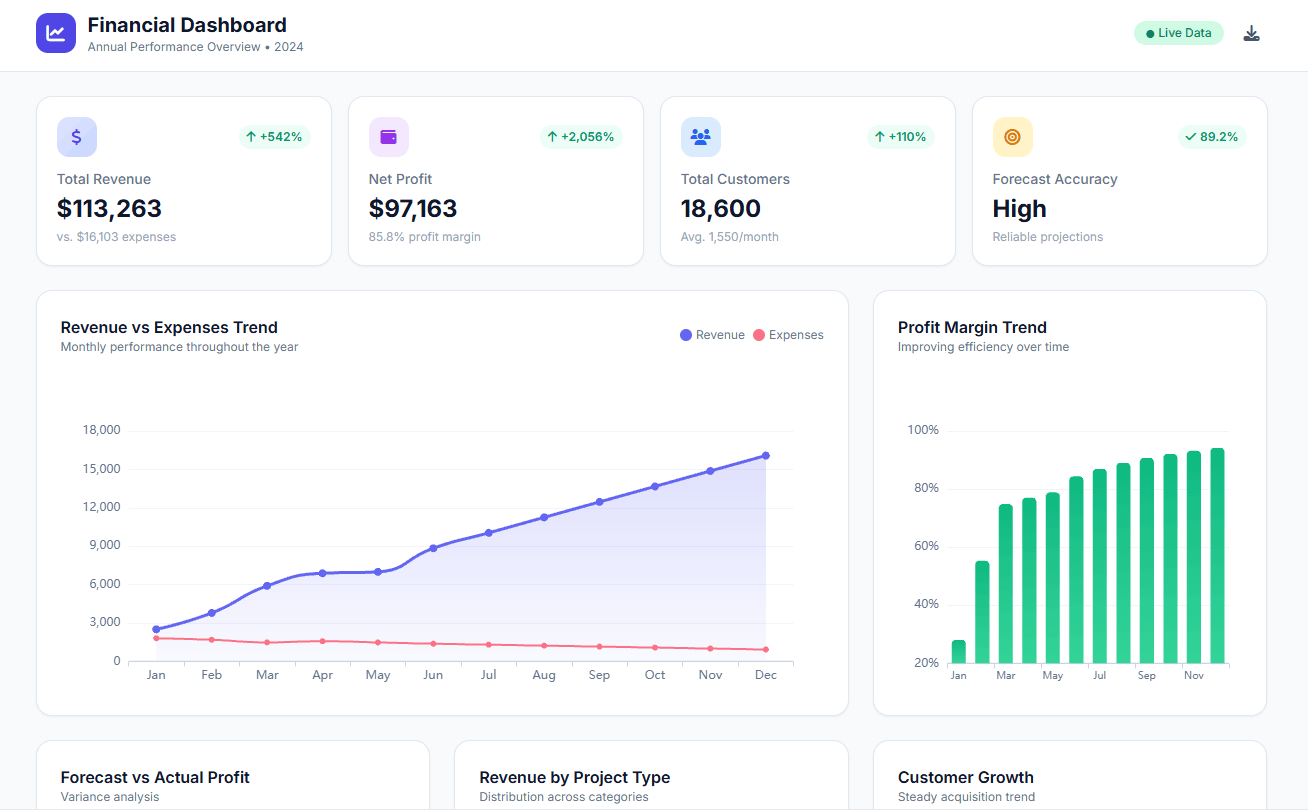
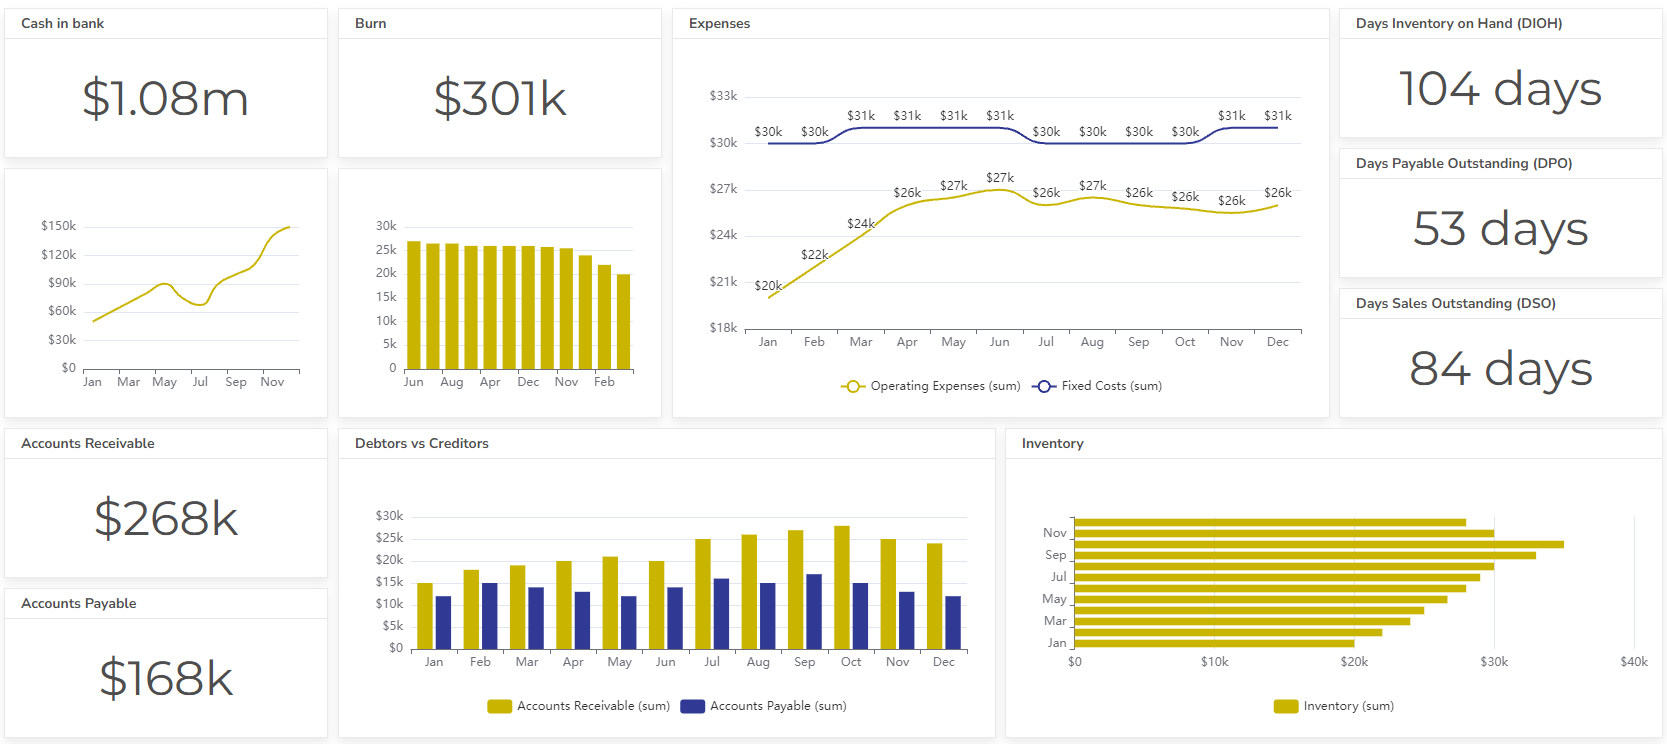
By tracking these KPIs over time, accounting departments can identify areas for improvement, optimize their processes, and ultimately contribute more effectively to the organization’s overall success. For better tracking teams can use accounting dashboards with real-time data updates.
Did you know you can automate the KPI calculation process and get live updates for your data? Set up your accounting KPI dashboard on Ajelix BI.
List With 15 Most Important Accounting KPIs
- Accounts Receivable Turnover (ART)
- Days Sales Outstanding (DSO)
- Current Ratio
- Quick Ratio
- Debt-to-Equity Ratio
- Inventory Turnover
- Gross Margin
- Operating Margin
- Net Profit Margin
- Cash Flow Ratio
- Budget vs. Actual Variances
- Days to Close
- Error Rate
- E-Invoicing Rate
- Percentage of Automated Processes
1. Accounts Receivable Turnover (ART)
This KPI measures how efficiently you collect payments from customers. A lower ART ratio indicates slow collections and potential cash flow problems.
ART = Net Credit Sales / Average Accounts Receivable
- Net Credit Sales: the total revenue from credit sales during a specific period (usually a year). Remember, this excludes cash sales and any returns or allowances made by customers.
- Average Accounts Receivable: the average amount of money owed to the company by customers on outstanding invoices at any given time during the period. It’s typically calculated by adding the beginning and ending accounts receivable balances and dividing by 2.
Example:
Let’s assume a company has Net Credit Sales of $1,000,000 and an Average Accounts Receivable of $125,000.
ART = $1,000,000 / $125,000 = 8
This means the company collects its accounts receivable 8 times a year on average.
A higher ART ratio generally indicates a company is collecting its receivables efficiently. Higher ART (above 8) suggests efficient collections but could also indicate overly strict credit policies that might limit sales. Lower ART (below 5) suggests slow collections or overly lenient credit policies. Companies with a lower ART may be at risk of cash flow problems.
2. Days Sales Outstanding (DSO)
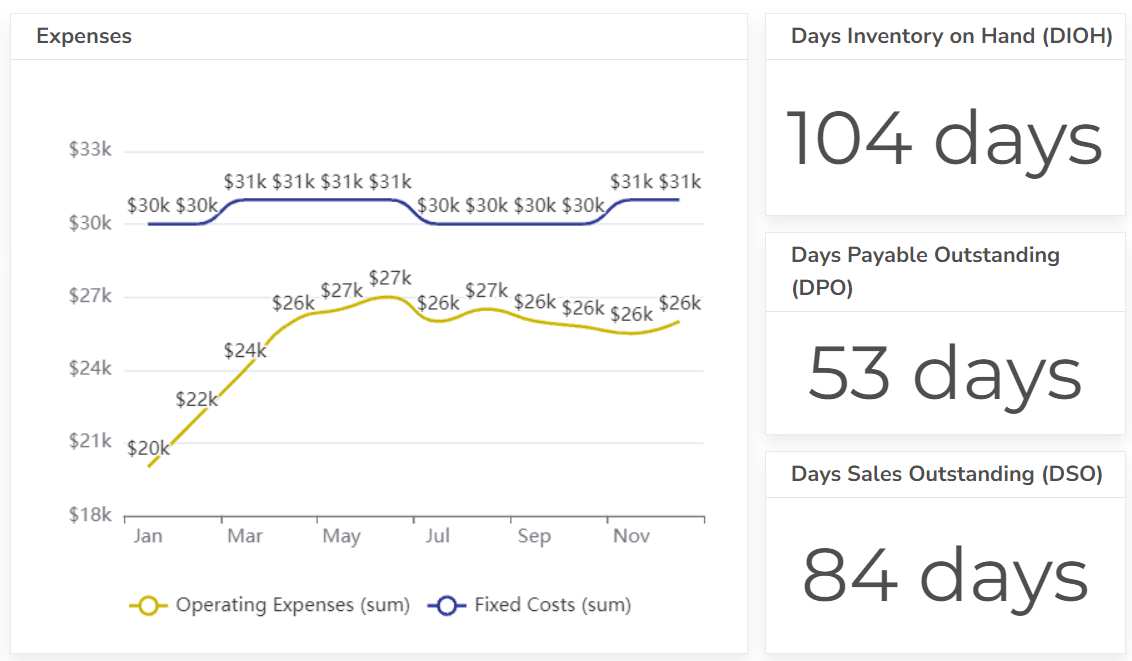
Days Sales Outstanding is a similar metric to ART but expressed in days instead of a ratio. It reflects the average time it takes for customers to pay their invoices after the sale is made.
DSO = (Average Accounts Receivable / Net Credit Sales) * Number of Days in the Period
- Average Accounts Receivable: the average amount of money owed to the company by customers on outstanding invoices at any given time during a specific period. It’s typically calculated by adding the beginning and ending accounts receivable balances and dividing by 2.
- Net Credit Sales: the total revenue from credit sales during a specific period (usually a year). Remember, this excludes cash sales and any returns or allowances made by customers.
- Number of Days in the Period: This depends on the timeframe you’re analyzing the DSO for. If you’re calculating DSO annually, you’d use 365 days. You can adjust this value for quarterly (typically 90 days) or monthly (around 30 days) calculations.
Example:
For instance, let’s say a company has an Average Accounts Receivable of $125,000 and Net Credit Sales of $1,000,000. We’ll assume we’re calculating DSO for an annual period (365 days).
- DSO = ($125,000 / $1,000,000) * 365 days = 45.6 days
This signifies that it takes the company an average of 45.6 days to collect payment on its invoices after a sale is made.
While a lower rate is ideal, the sweet spot depends on your industry. Generally, aim for a metric below industry averages to balance efficient collections while maintaining healthy sales volume. Avoid an excessively low DSO that might restrict sales or a very high DSO that could strain cash flow.
3. Current Ratio
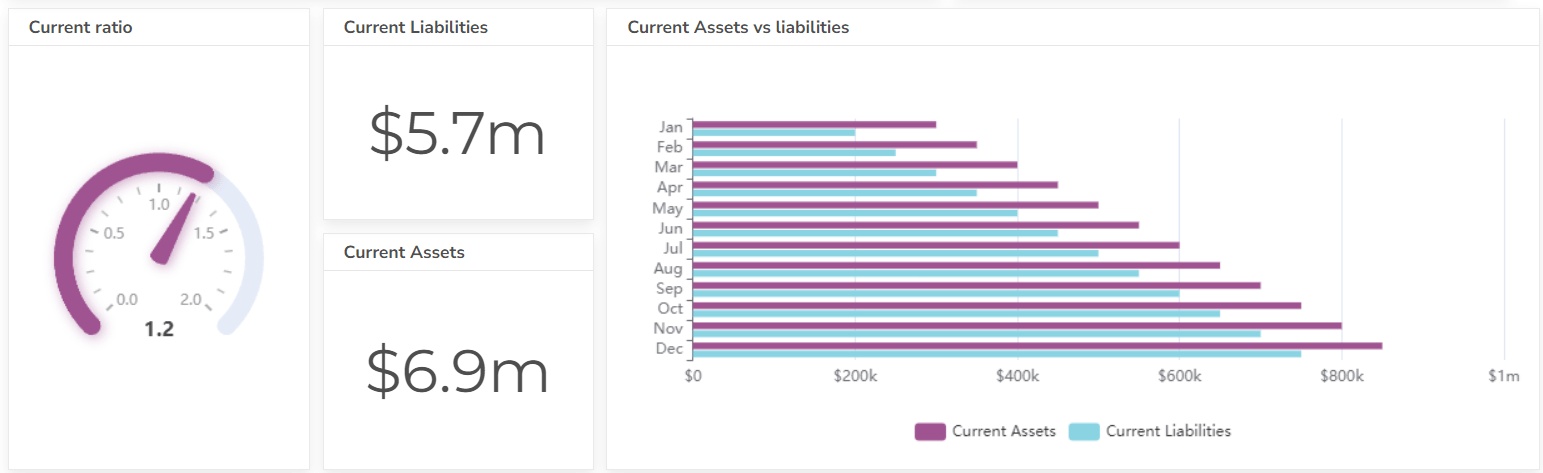
The current ratio assesses a company’s short-term liquidity, and its ability to pay off current liabilities with current assets. A current ratio of less than 1 indicates potential difficulty meeting short-term obligations.
Current Ratio = Current Assets / Current Liabilities
- Current Assets: assets that a company expects to convert into cash within one year. This typically includes cash, cash equivalents, accounts receivable, inventory, and prepaid expenses.
- Current Liabilities: obligations a company expects to pay within one year. Examples include accounts payable, short-term loans, accrued expenses, and current portions of long-term debt.
Example:
Suppose a company has Current Assets of $500,000 and Current Liabilities of $300,000.
- Current Ratio = $500,000 / $300,000 = 1.67
This indicates the company has $1.67 of current assets for every $1 of current liabilities.
A good current ratio exists between 1.5 and 3. This indicates a balance between having enough current assets to cover short-term debts (above 1) and not tying up too much capital in slow-moving inventory or receivables (below 3). Deviations from this range in either direction warrant further investigation depending on your industry.
Struggling with manual calculations & tiring setups?
Let agentic AI do the heavy lifting.
Start free
Fast sign up & easy setup
4. Quick Ratio
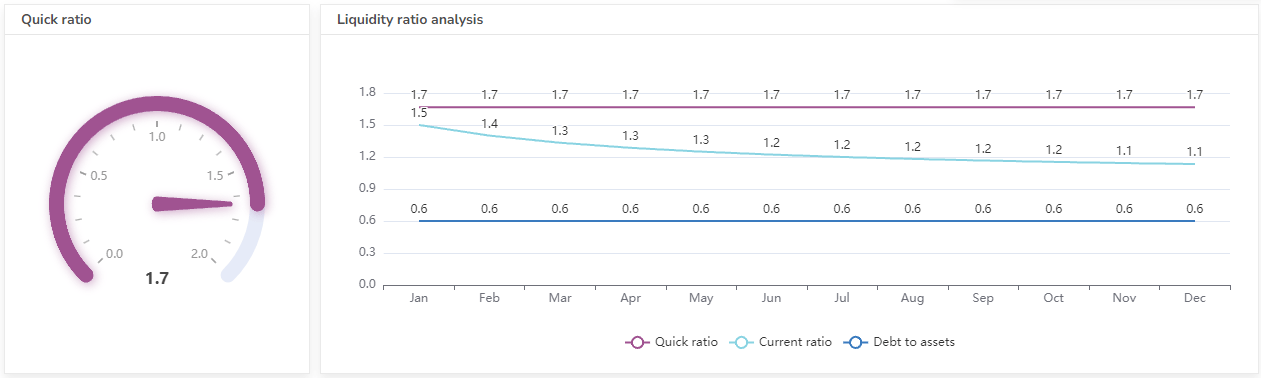
Similar to the current ratio, the quick ratio excludes inventory from current assets as inventory may be difficult to sell quickly to generate cash.
Quick Ratio = (Cash & Cash Equivalents + Marketable Securities + Accounts Receivable) / Current Liabilities
- Cash & Cash Equivalents: includes actual cash on hand and highly liquid assets readily convertible to cash within a short period (usually less than 90 days).
- Marketable Securities: are investment securities that can be easily bought and sold on a stock exchange, providing quick access to cash.
- Accounts Receivable: represents the money owed by customers for credit purchases. While not as quick to convert to cash as cash equivalents or marketable securities, it’s still considered a relatively liquid asset.
- Current Liabilities: Similar to the Current Ratio, these are obligations a company expects to pay within one year.
Example:
Imagine a company has:
- Cash & Cash Equivalents: $100,000
- Marketable Securities: $50,000
- Accounts Receivable: $125,000
- Current Liabilities: $300,000
Plugging these values into the formula:
- Quick Ratio = ($100,000 + $50,000 + $125,000) / $300,000 = 0.92
This indicates the company has $0.92 of its most liquid assets for every $1 of current liabilities.
| Quick Ratio Range | Interpretation | Example |
|---|---|---|
| Above 2 | Very Strong Liquidity – May indicate excess cash not being used for growth | The company may need to sell inventory or take on additional debt to cover expenses |
| 1 – 2 | Good Liquidity – Comfortable cushion to cover short-term obligations | The company may be overly cautious or lack profitable investment opportunities |
| Below 1 | Weak Liquidity – Potential difficulty meeting short-term obligations solely with highly liquid assets | Company may need to sell inventory or take on additional debt to cover expenses |
5. Debt-to-Equity Ratio
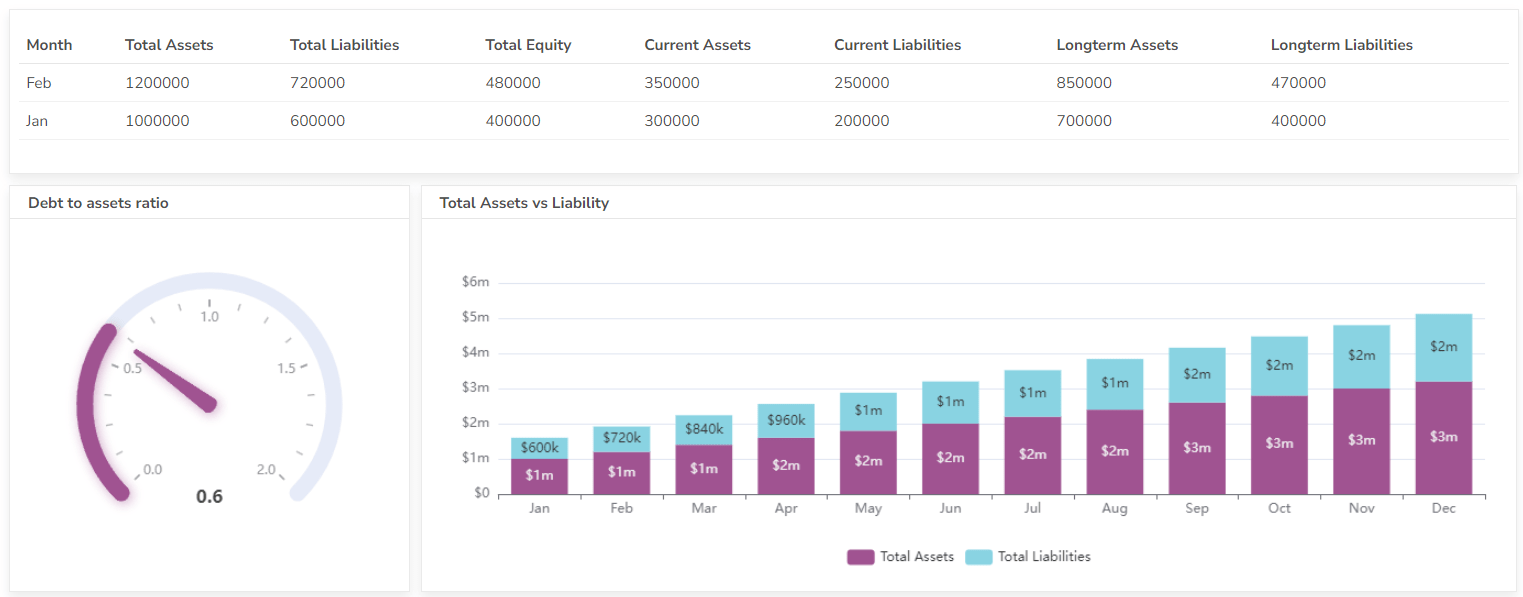
This KPI measures a company’s financial leverage, and its reliance on debt financing compared to investor equity. A high ratio suggests the company may be overleveraged and at risk of defaulting on its loans.
D/E Ratio = Total Debt / Total Shareholders’ Equity
- Total Debt: all the company’s liabilities, including short-term debt (accounts payable, accrued expenses) and long-term debt (loans, bonds).
- Total Shareholders’ Equity: the company’s net worth, essentially the difference between its assets and liabilities. It represents the investment of shareholders in the company.
Example:
For instance, let’s say a company has Total Debt of $750,000 and Total Shareholders’ Equity of $1,000,000.
- D/E Ratio = $750,000 / $1,000,000 = 0.75
This signifies that the company has $0.75 of debt for every $1 of shareholder equity.
| Debt-to-Equity Ratio Range | Interpretation | Example |
|---|---|---|
| Below 1 | Conservative Financing – Relies more on equity, potentially limiting growth opportunities | The company is financially stable and can manage debt obligations |
| 1 – 2 | Balanced Financing – Moderate use of debt alongside equity financing | Company is financially stable and can manage debt obligations |
| Above 2 | High Leverage – Increased risk as debt burden grows | Company may be vulnerable to rising interest rates or economic downturns |
For better tracking, you might consider using financial BI to help measure metrics in real time.
6. Inventory Turnover
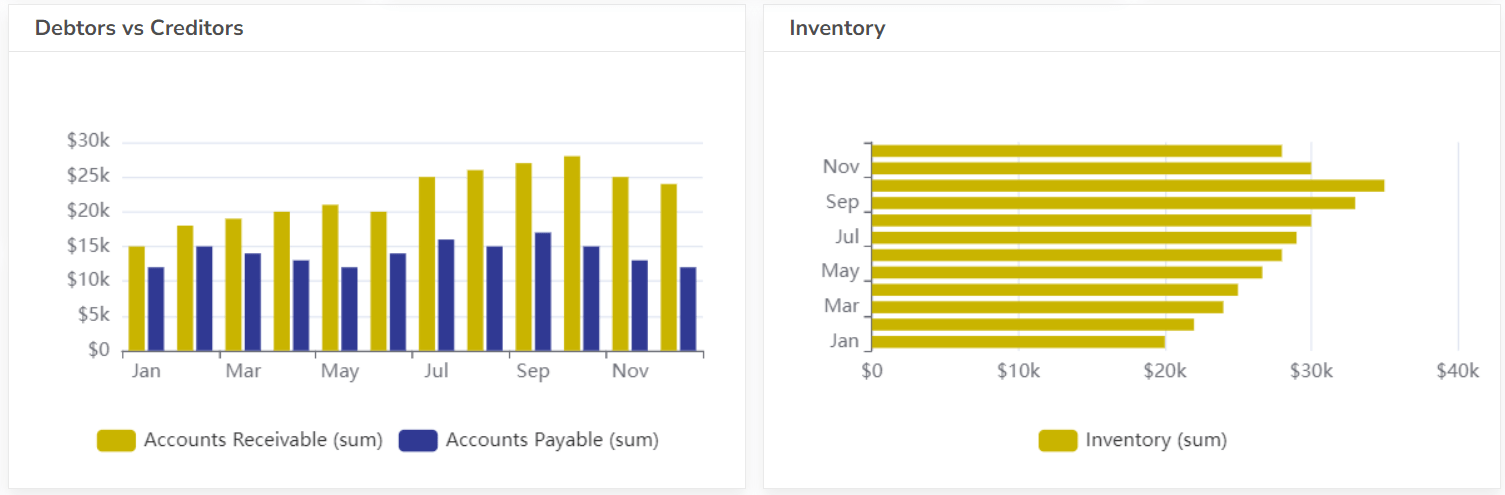
This ratio measures how many times a company sells and replaces its inventory over a period. A low inventory turnover ratio could indicate excess stock or inefficient inventory management.
Inventory Turnover Ratio = Cost of Goods Sold (COGS) / Average Inventory
- Cost of Goods Sold (COGS): direct cost of producing the goods a company sells during a period. It typically includes the cost of materials, labor, and overhead directly involved in production.
- Average Inventory: the average amount of inventory a company holds throughout a specific period. It’s often calculated by adding the beginning and ending inventory balances and dividing by 2.
Example:
Suppose a company has a Cost of Goods Sold (COGS) of $800,000 and an Average Inventory of $200,000:
- Inventory Turnover Ratio = $800,000 / $200,000 = 4
This indicates the company turns over its stock (sells and replaces its inventory) 4 times a year on average.
| Industry | Inventory Turnover Ratio Range | Interpretation |
|---|---|---|
| High-turnover industries (e.g., Grocery Stores) | 8 – 15 | Very efficient inventory management minimizes holding costs |
| Mid-Turnover Industries (e.g., Apparel) | 4 – 8 | Balanced inventory management, avoids stockouts and minimizes holding costs |
| Low-Turnover Industries (e.g., Machinery) | 1 – 3 | Less emphasis on rapid inventory turnover due to longer production cycles or high-value items |
7. Gross Margin
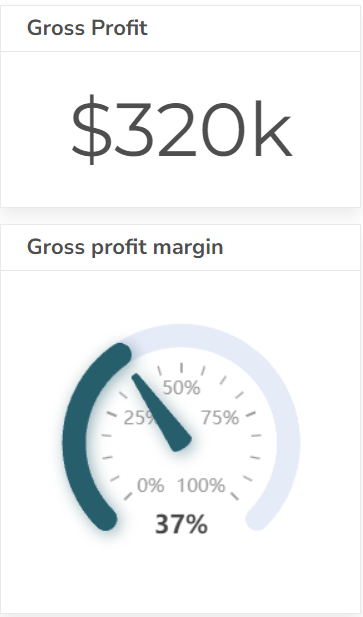
Gross margin is the profit a company makes after subtracting the cost of goods sold from its revenue. A higher gross margin indicates a company is more efficient in its production process.
Gross Margin Ratio = (Revenue – Cost of Goods Sold (COGS)) / Revenue
- Revenue: represents the total income generated from sales of products or services during a specific period.
- Cost of Goods Sold (COGS): reflects the direct cost of producing the goods a company sells during a period. It typically includes the cost of materials, labor, and overhead directly involved in production.
Example:
Imagine a company has Revenue of $1,000,000 and a Cost of Goods Sold (COGS) of $600,000:
- Gross Margin Ratio = ($1,000,000 – $600,000) / $1,000,000 = 0.4 or 40%
This signifies that for every $1 of revenue, the company keeps $0.40 (or 40%) after covering the cost of producing the goods.
| Industry | Gross Margin Ratio Range | Interpretation |
|---|---|---|
| High Margin Industries (e.g., Software, Retail) | 60% or above | Very efficient production process, strong control over COGS |
| Average Margin Industries (e.g., Manufacturing, Restaurants) | 20% – 40% | Balanced production efficiency, reflects industry norms |
| Low Margin Industries (e.g., Commodities, Airlines) | 10% or below | Lower pricing power or high production costs, profitability may depend on volume |
8. Operating Margin
This KPI goes a step further than gross margin by also factoring in operating expenses. It reflects the profitability of a company’s core operations. A profit and loss dashboard can provide a comprehensive overview of your company’s financial performance, including your net profit or loss, revenue, expenses, and other key metrics.
Operating Margin Ratio = Operating Income / Revenue
- Operating Income: represents the profit a company makes after deducting all operating expenses from its revenue. Operating expenses include expenses incurred for day-to-day operations like rent, salaries, marketing, and depreciation.
- Revenue: reflects the total income generated from sales of products or services during a specific period.
Example:
Let’s say a company has Revenue of $1,000,000 and Operating Income of $200,000:
- Operating Margin Ratio = $200,000 / $1,000,000 = 0.2 or 20%
This indicates that for every $1 of revenue, the company earns $0.20 (or 20%) in profit after covering its core operating expenses.
| Industry | Operating Margin Ratio Range | Interpretation |
|---|---|---|
| High Margin Industries (e.g., Technology, Consulting) | 15% or above | Very efficient operations, strong control over expenses |
| Average Margin Industries (e.g., Manufacturing, Retail) | 5% – 15% | Balanced operating efficiency, reflects industry norms |
| Low Margin Industries (e.g., Commodities, Restaurants) | Below 5% | May struggle with high operating costs or a competitive landscape with low profit margins |
9. Net Profit Margin
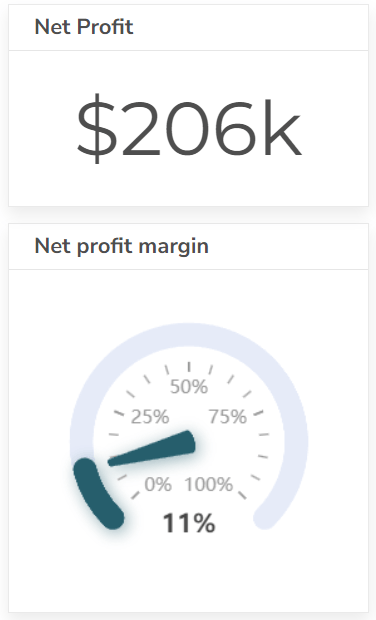
The net profit margin is the ultimate measure of profitability, representing the portion of revenue remaining after all expenses are paid.
Net Profit Margin Ratio = Net Profit / Total Revenue * 100%
- Net Profit (Net Income): the profit a company earns after deducting all expenses from its revenue. You can find net profit on the company’s income statement.
- Total Revenue: This reflects the total income generated from sales of products or services during a specific period.
Example:
Imagine a company has a Net Profit of $1 million and Total Revenue of $10 million:
- Net Profit Margin Ratio = $1 million (Net Profit) / $10 million (Total Revenue) * 100% = 10%
This signifies that for every $1 of revenue, the company keeps $0.10 (or 10%) in profit after covering all its expenses.
10. Cash Flow Ratio
This ratio assesses a company’s ability to generate cash from its operations to cover its ongoing expenses and short-term debt obligations. You can also use the cash-flow dashboard to better track these ratios.
Cash Flow Ratio = Operating Cash Flow (OCF) / Current Liabilities
- Operating Cash Flow (OCF): the cash company generates from its normal business activities after accounting for operating expenses. It’s not the same as net income, as it excludes non-cash expenses like depreciation and amortization. You can find OCF on the company’s cash flow statement.
- Current Liabilities: obligations a company expects to pay within one year. Examples include accounts payable, short-term loans, accrued expenses, and current portions of long-term debt.
Example:
Imagine a company has Operating Cash Flow of $400,000 and Current Liabilities of $300,000:
- Cash Flow Ratio = $400,000 / $300,000 = 1.33
This signifies that the company can cover its current liabilities 1.33 times over with the cash generated from its core operations.
| Cash Flow Ratio Range | Interpretation | Example |
|---|---|---|
| Above 1.5 | Strong Cash Flow Generation | Comfortably cover short-term debts and potentially invest in growth or debt repayment. |
| 1 – 1.5 | Adequate Cash Flow | The company might struggle to meet short-term obligations solely with operating cash flow, potentially needing additional financing. |
| Below 1 | Weak Cash Flow | Might struggle to meet short-term obligations solely with operating cash flow, potentially needing additional financing. |
11. Budget vs. Actual Variances
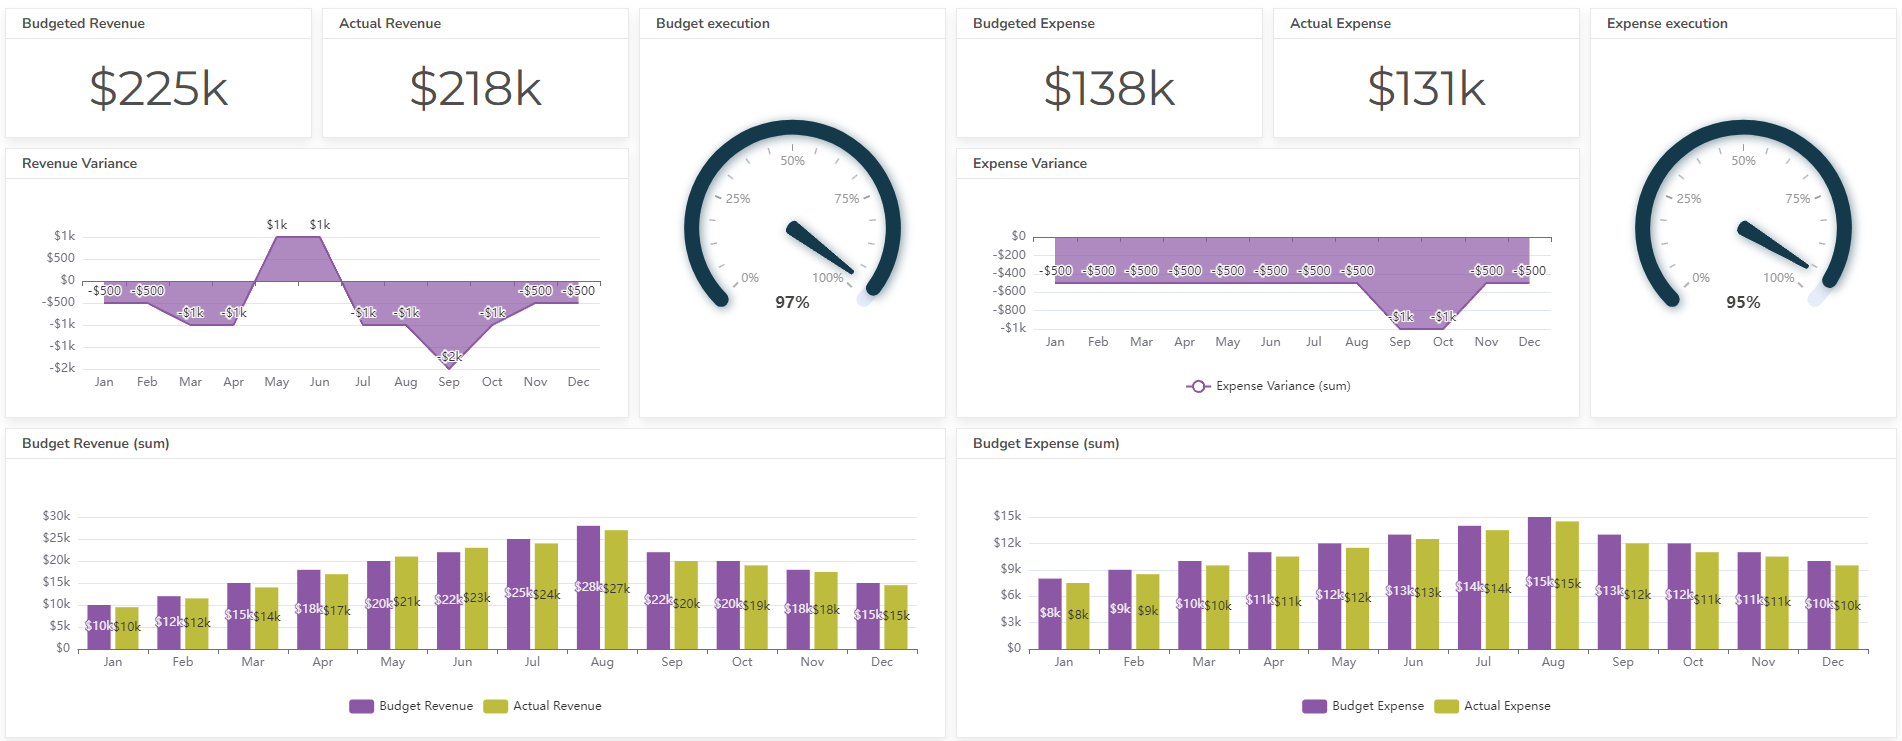
Tracking variances between budgeted and actual financial results helps identify areas where spending is exceeding expectations or where revenue is falling short. Here’s how to calculate it:
- Identify the Category: Choose a specific budget category, such as revenue, expenses, or a specific line item within those categories (e.g., marketing expenses).
- Calculate the Variance: There are two ways to calculate the variance:
- Variance = Actual Amount – Budgeted Amount: the dollar amount difference between what actually happened and what was planned.
- Variance % = (Actual Amount – Budgeted Amount) / Budgeted Amount * 100: expresses the variance as a percentage of the budgeted amount, providing a clearer picture of the relative difference.
Example:
Let’s say a company budgeted for $10,000 in marketing expenses for a month. However, they actually spent $12,000.
- Dollar Variance = $12,000 (Actual) – $10,000 (Budgeted) = $2,000 (This indicates the company spent $2,000 more than planned.)
- Variance % = ($12,000 – $10,000) / $10,000 * 100 = 20% (This signifies a 20% overspend compared to the budget.)
There’s no “good” or “bad” variance. It depends on the specific category and the company’s goals. A small unfavorable variance might be acceptable, while a large one might warrant investigation. The key is to analyze variances within the context of the budget and overall financial performance.
12. Days to Close
This KPI measures the time it takes to finalize the accounting books for a specific period. A longer close time may indicate inefficiencies in the accounting process.
Days to Close (DTC) = Average Sales Cycle Length (in Days) / Number of Closed Deals
- Average Sales Cycle Length (in Days): the typical time it takes for a prospect to move through your sales funnel and convert into a paying customer. You can calculate this by averaging the time it takes for individual deals to close.
- Number of Closed Deals: the total number of deals successfully closed within a specific period (e.g., month, quarter, year).
Example:
Imagine a sales team closes 10 deals in a month, and the average sales cycle for those deals is 30 days.
- DTC = (30 days/deal) x 10 deals = 30 days
This signifies that on average, it takes the sales team 30 days to close a deal.
| Days to Close Range | Interpretation | Example |
|---|---|---|
| Lower DTC (Faster) | Efficient Sales Process | Sales team closes deals quickly, indicating a streamlined process. |
| Industry Average DTC | Balanced Sales Cycle | DTC falls within the typical timeframe for your industry. |
| Higher DTC (Slower) | Potentially Inefficient Sales Process | Longer DTC might suggest areas for improvement in lead nurturing, sales effectiveness, or dealing with complex buying decisions. |
13. Error Rate
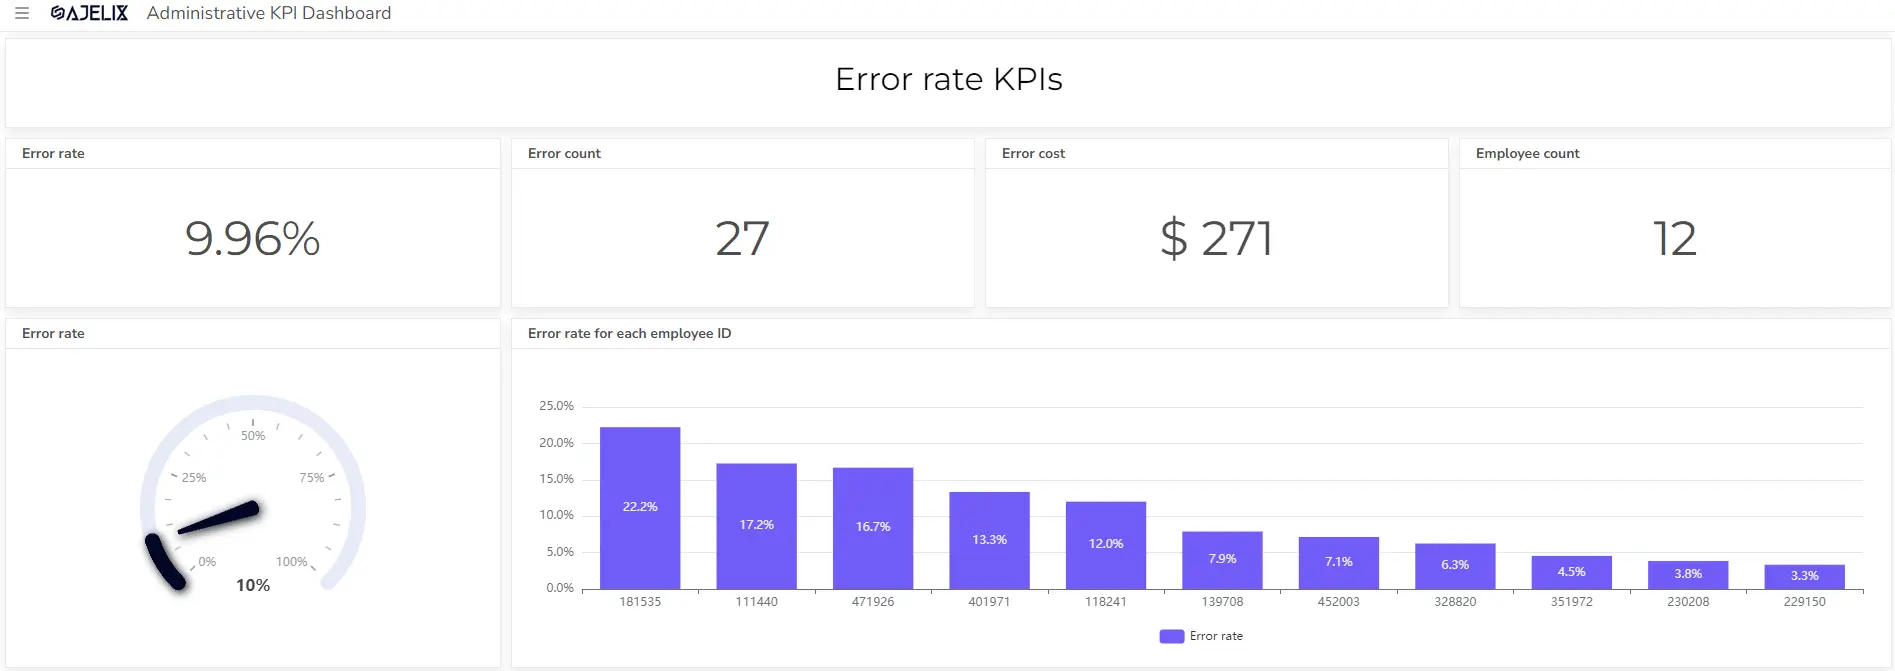
No accounting department is perfect, but tracking the rate of errors helps identify areas for improvement and ensure the accuracy of financial statements.
Error Rate = (Number of Errors) / (Total Number of Data Points) * 100%
Example:
Imagine processing 1,000 customer records, and you identify 50 errors (e.g., missing information, incorrect formatting).
- Error Rate = (50 Errors) / (1,000 Data Points) * 100% = 5%
This signifies a 5% error rate in your data set.
A lower error rate (closer to 0%) is preferable for most data analysis to ensure accurate results and reliable conclusions. A higher error rate might be tolerable for less critical data or situations where some level of error is unavoidable. However, a high error rate can significantly impact the validity of your data and its usefulness.
14. E-Invoicing Rate
This KPI measures the percentage of invoices issued electronically. E-invoicing can improve efficiency and reduce processing costs.
E-Invoicing Rate = (Number of E-Invoices Issued) / (Total Number of Invoices Issued) * 100%
- Number of E-Invoices Issued: This represents the total number of invoices a company has issued electronically during a specific period (e.g., month, quarter, year).
- Total Number of Invoices Issued: This reflects the total number of invoices a company has issued during the same period, including both electronic and paper invoices.
Example:
Imagine a company issues 1,000 invoices in a month, and 800 of those are electronic invoices.
- E-Invoicing Rate = (800 E-Invoices) / (1,000 Total Invoices) * 100% = 80%
This signifies that the company has an 80% e-invoicing rate, meaning 80% of their invoices are issued electronically.
15. Percentage of Automated Processes
Tracking the automation rate of accounting tasks helps assess the efficiency of the department and identify areas where automation can be further implemented.
Percentage of Automated Processes = (Number of Automated Processes) / (Total Number of Processes) * 100%
- Number of Automated Processes: the total number of processes within a company that are handled electronically or by automated software, eliminating the need for manual intervention.
- Total Number of Processes: the total number of processes a company performs to operate, including both automated and manual processes.
Example:
Imagine a company has 50 total processes across various departments. They’ve successfully automated 20 of those processes.
- Percentage of Automated Processes = (20 Automated Processes) / (50 Total Processes) * 100% = 40%
This indicates that the company has automated 40% of its processes.
How To Create Accounting KPI Dashboard
Time needed: 1 hour
This guide outlines building a KPI accounting dashboard with Ajelix BI, a freemium business intelligence platform. Though specific steps might differ across BI tools, the core process remains consistent.
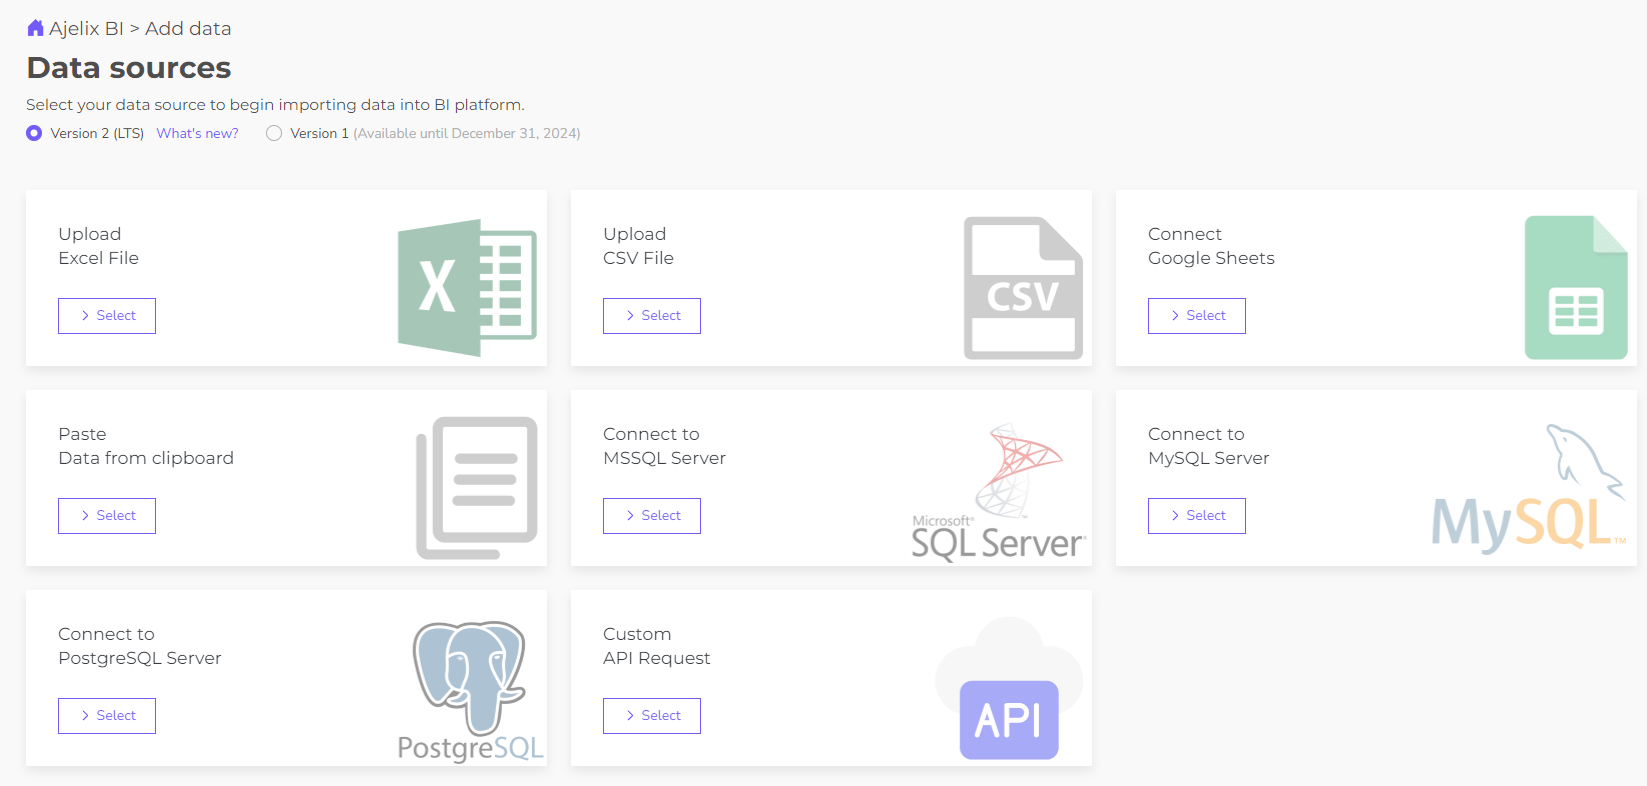
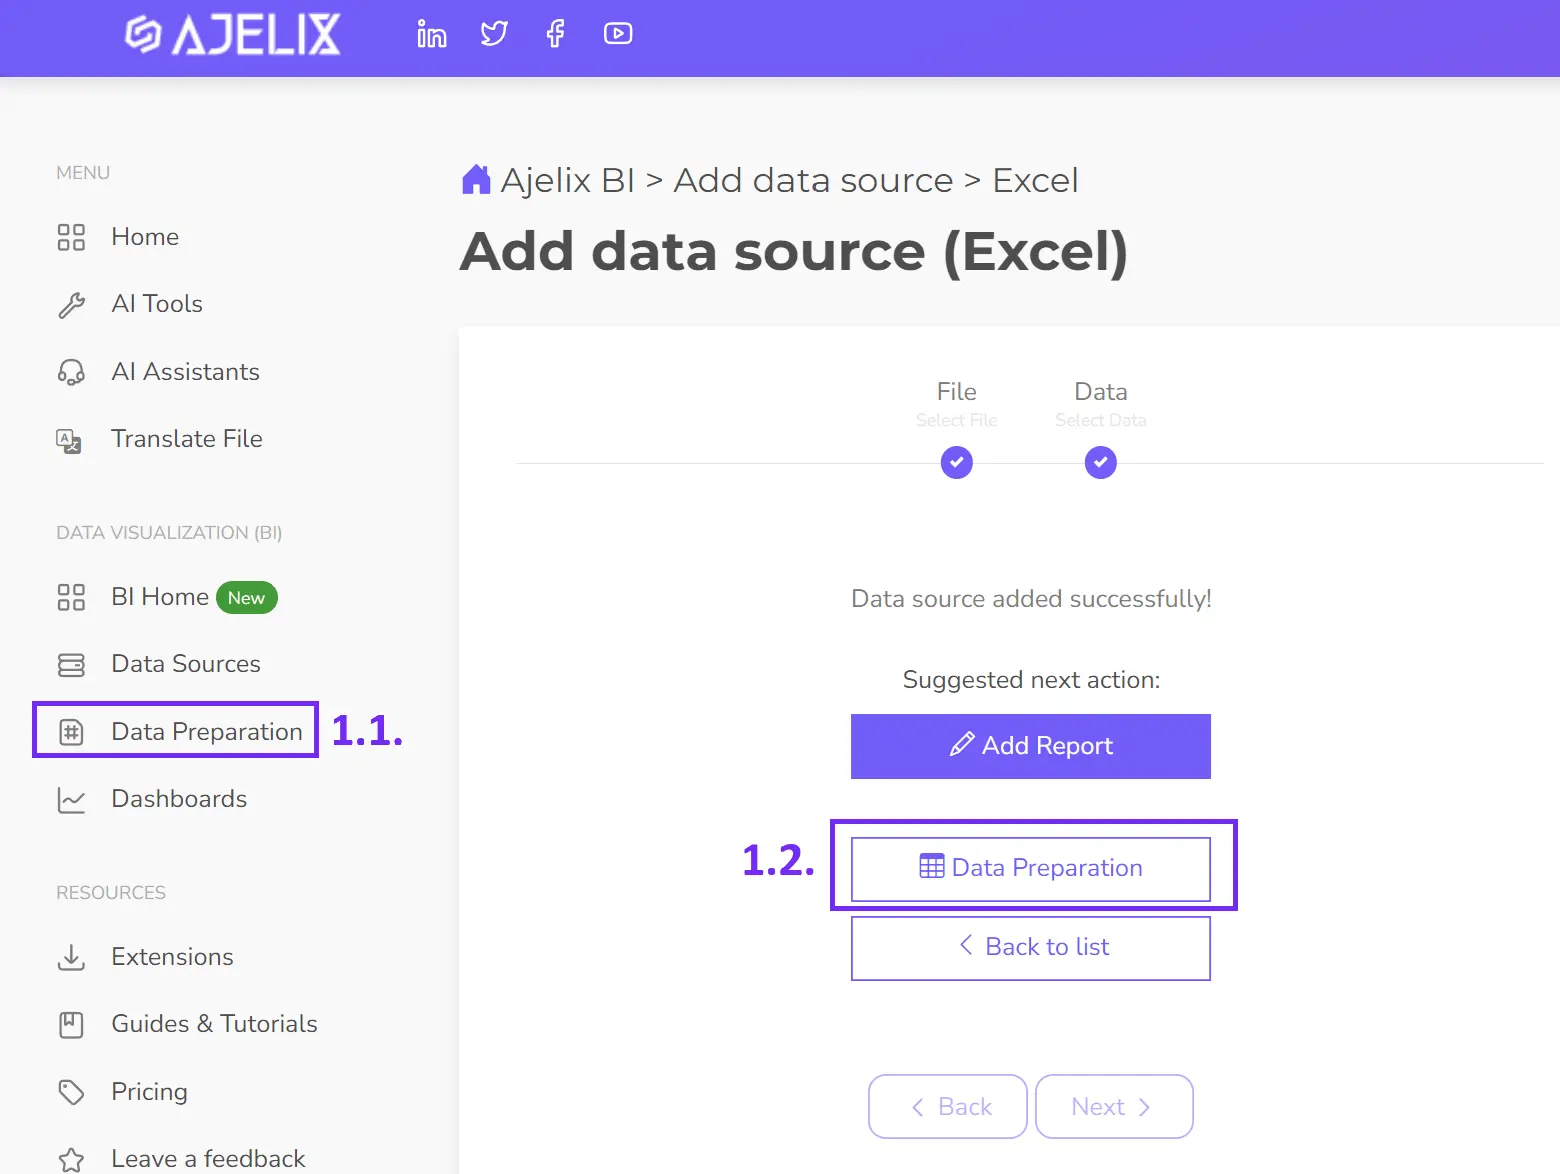
- Connect your data source
Within your BI tool, the instructions will guide you through connecting to your data. This process typically involves uploading files like Excel or CSV, or directly connecting to databases like MySQL, PostgreSQL, MSSQL or Google Sheets.
- Clean and transform your data (optional)
Ajelix BI empowers you to transform your data (e.g., format conversion, filtering) for improved accuracy and consistency. While this step is optional, it’s highly recommended to unlock deeper insights from your analysis.
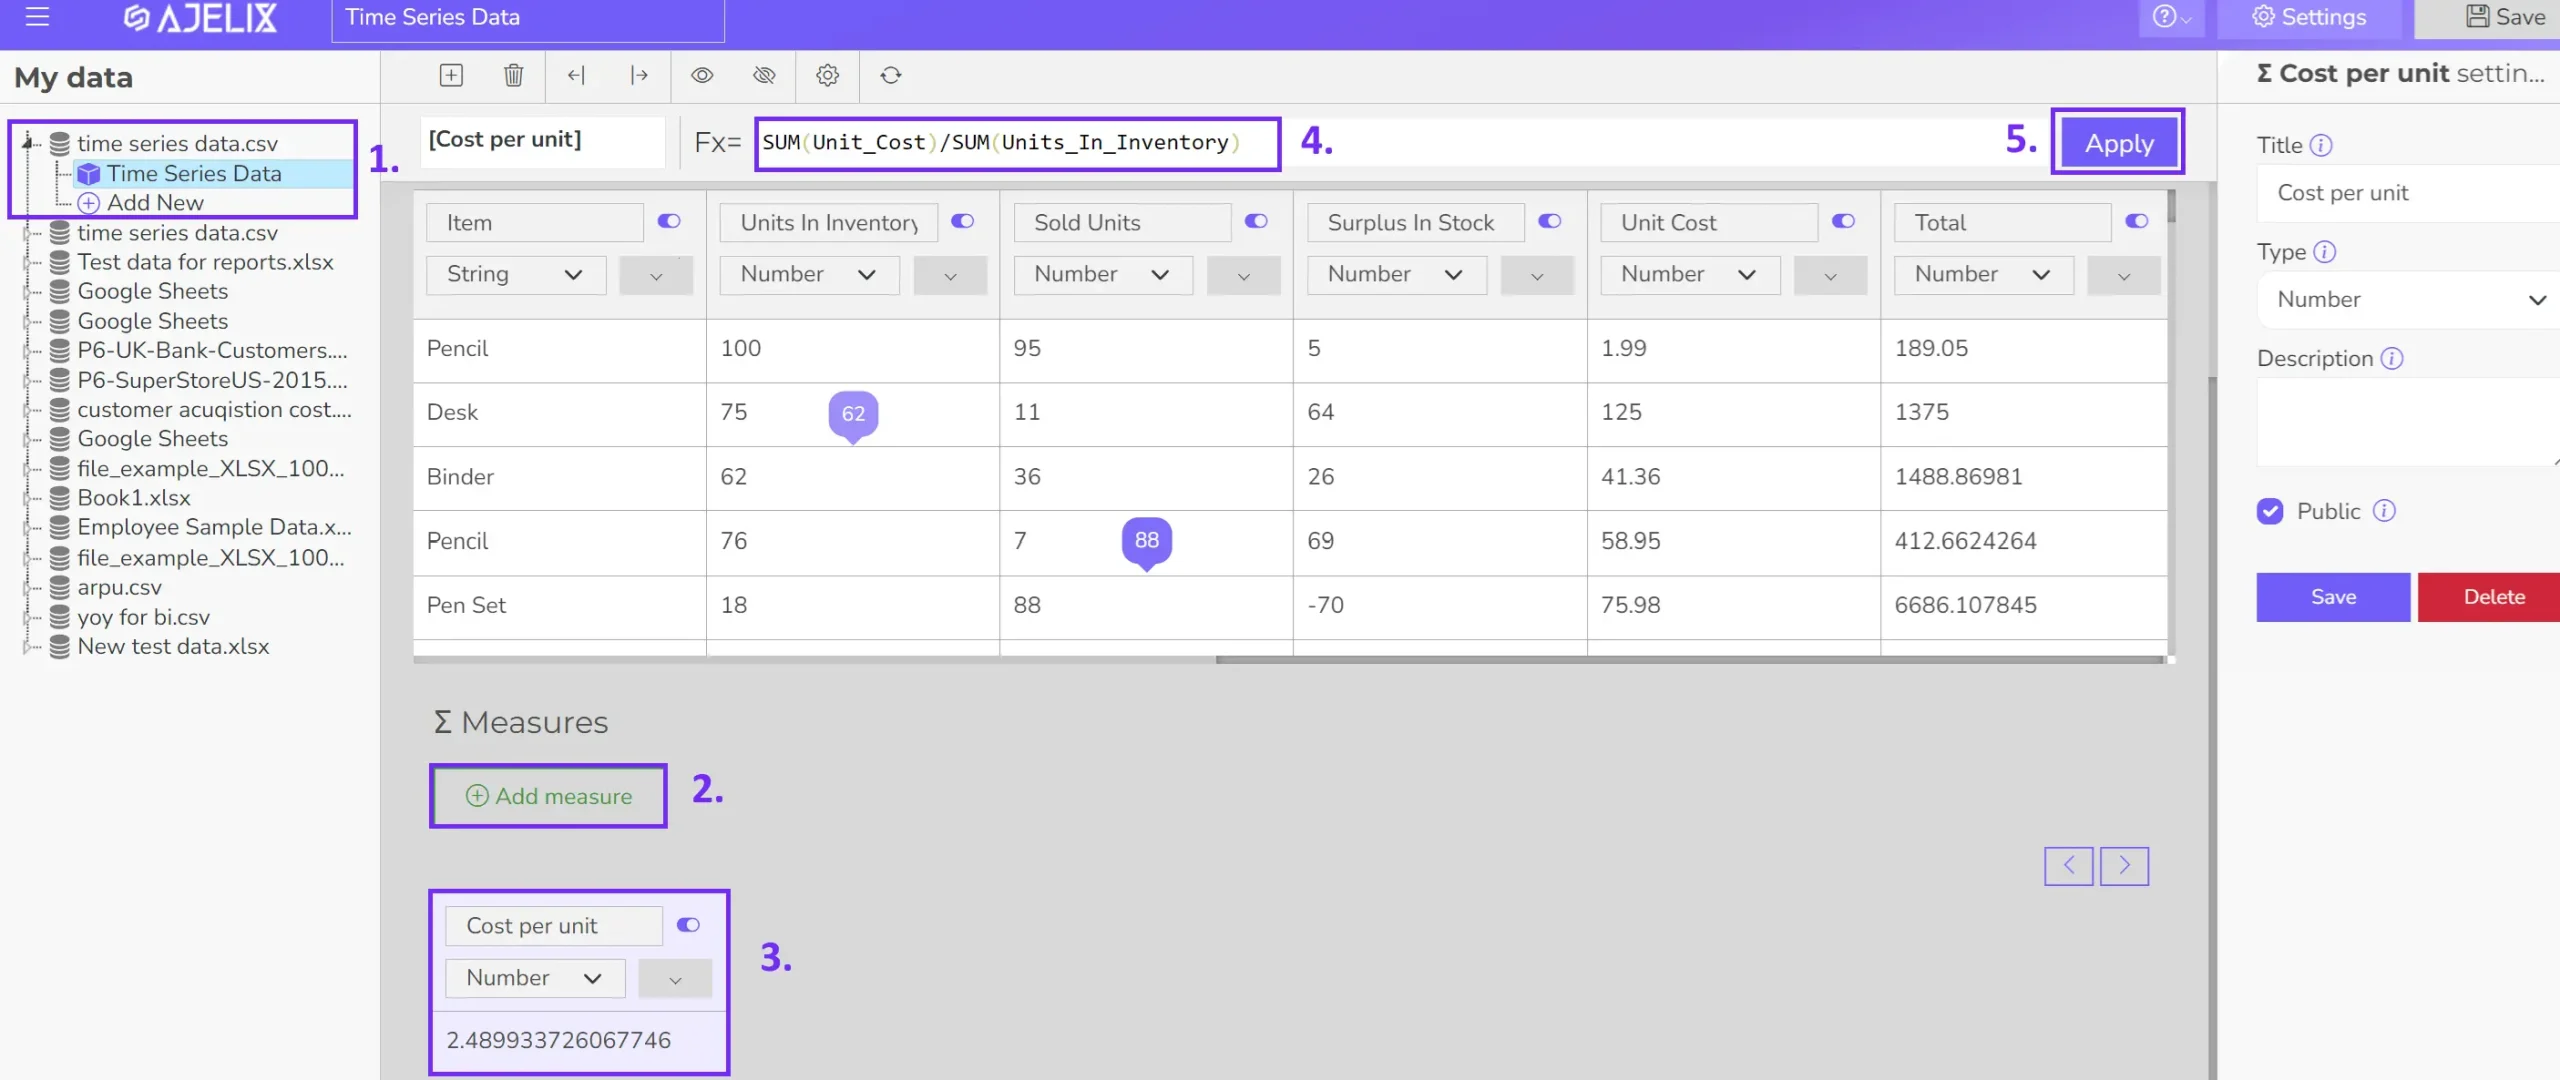
- Create calculated fields (optional)
Some KPIs may require calculations beyond your data source. Luckily, this guide explored over 15 essential accounting KPIs with formulas you can define and measure using Ajelix BI‘s data modeling capabilities. The following image illustrates the steps involved in crafting your own KPIs.
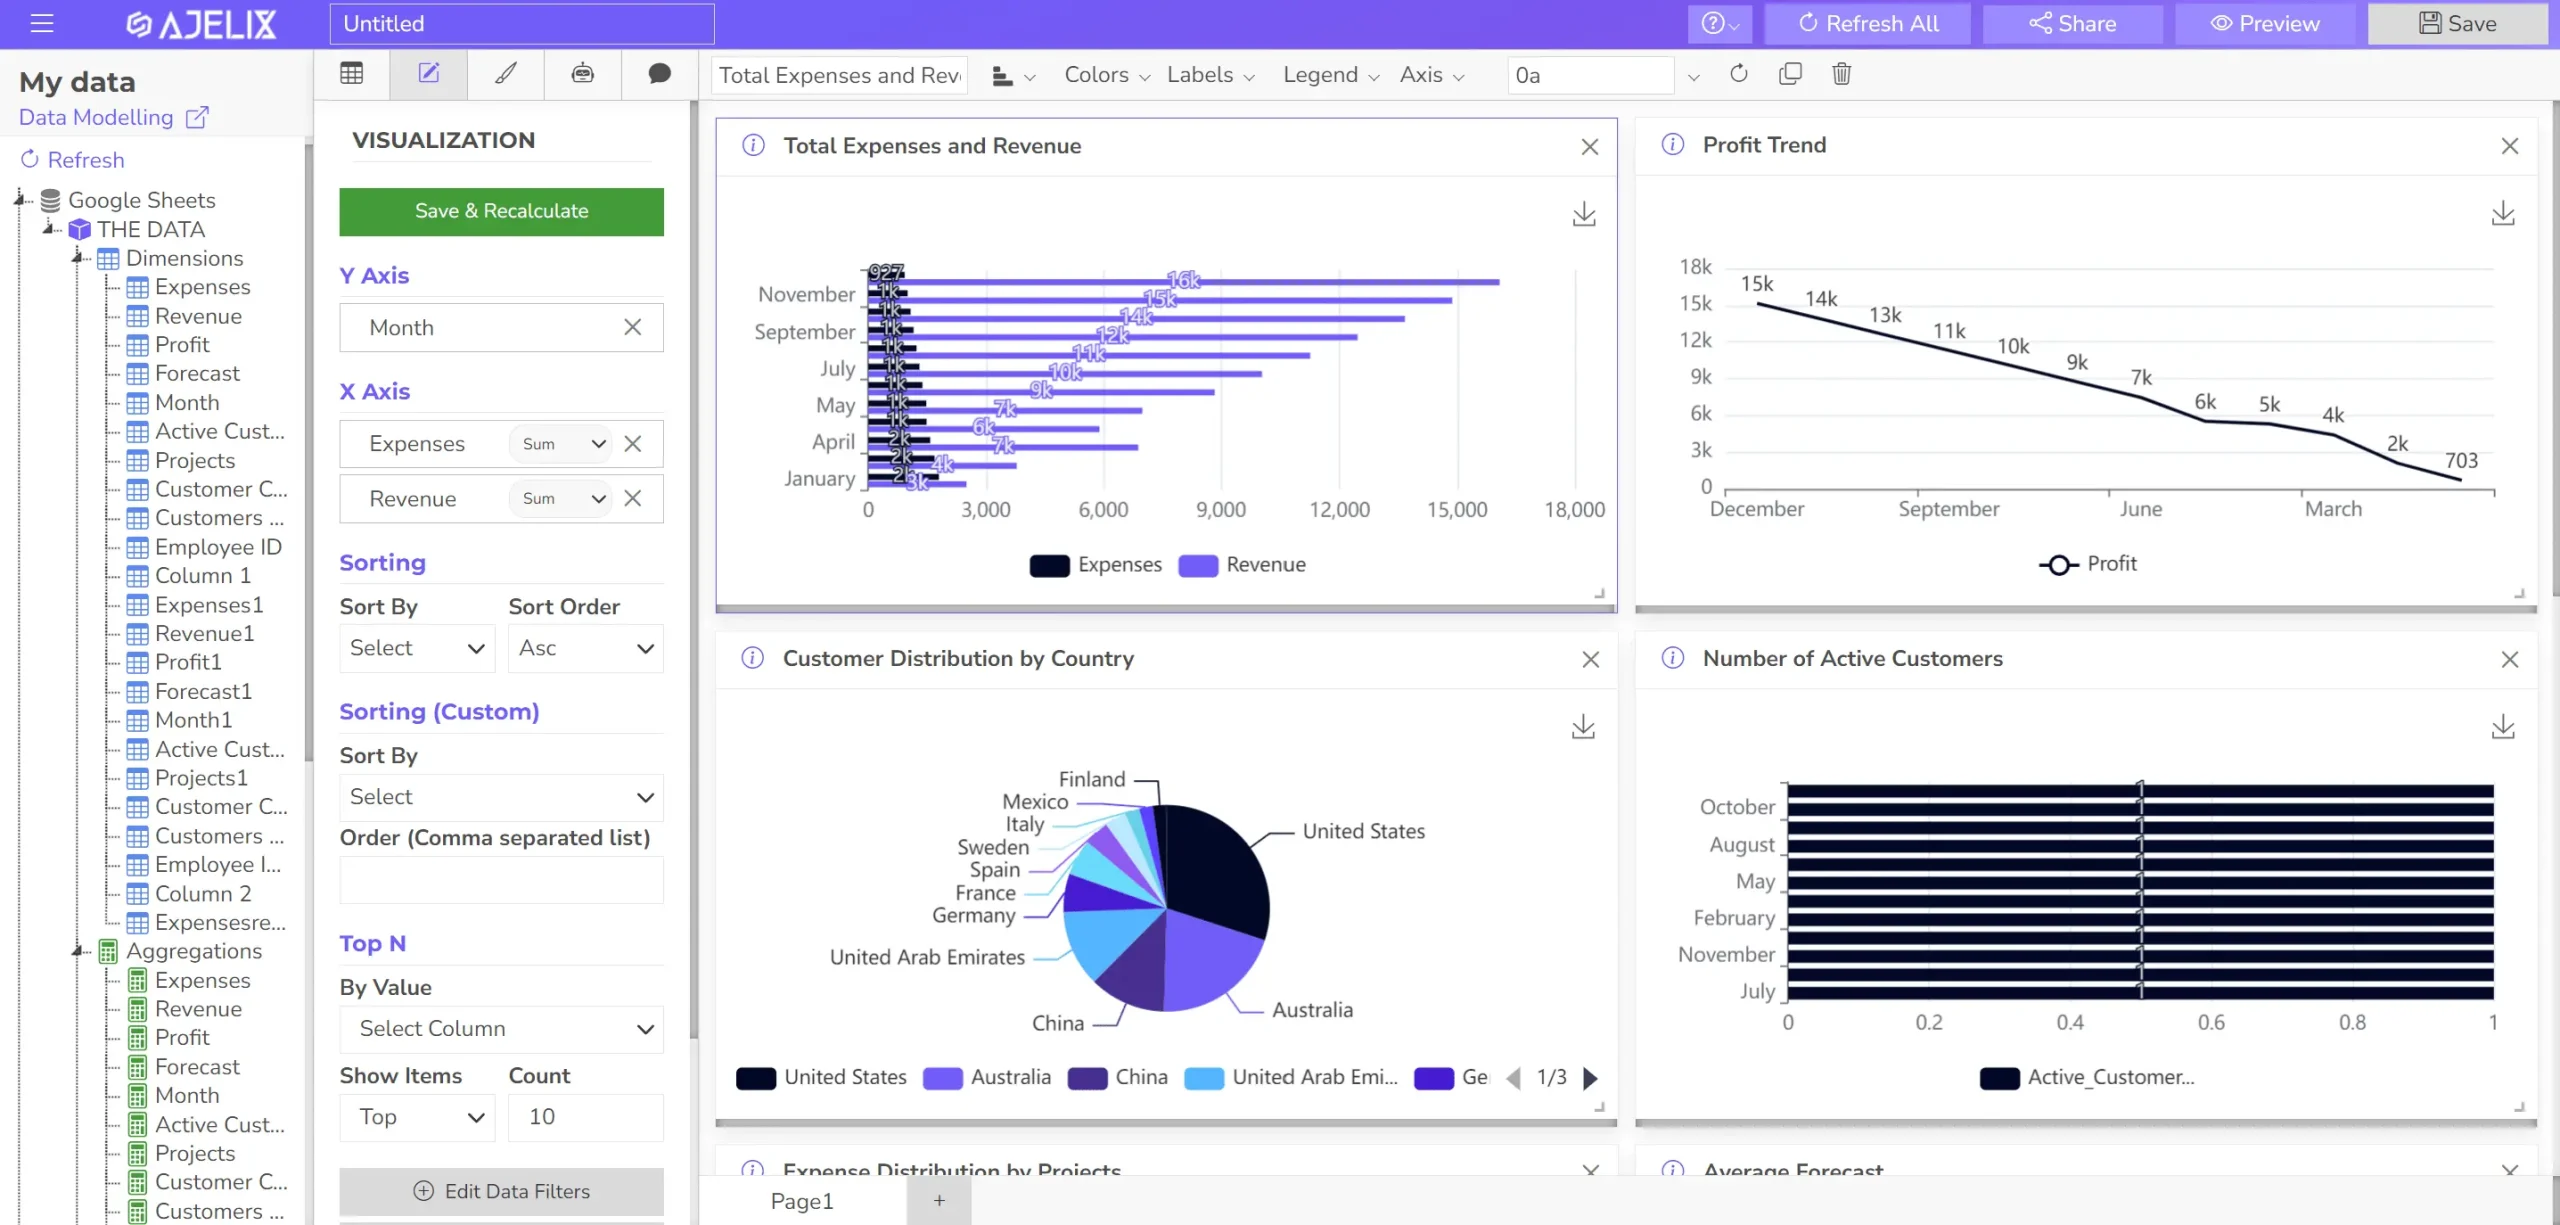
- Build your visualizations
Select the most suitable visual format for each KPI, such as cards, gauge charts, or line graphs. Ajelix BI simplifies this process with drag-and-drop functionality to populate your chosen visualizations with data fields. Even better, leverage the built-in AI assistant to generate charts automatically based on your data. Experiment with it and see the automation magic unfold!
- Customize your dashboard
To enhance clarity and visual appeal, incorporate informative titles and descriptions for each KPI element. Additionally, arrange the layout strategically to optimize readability and user experience.
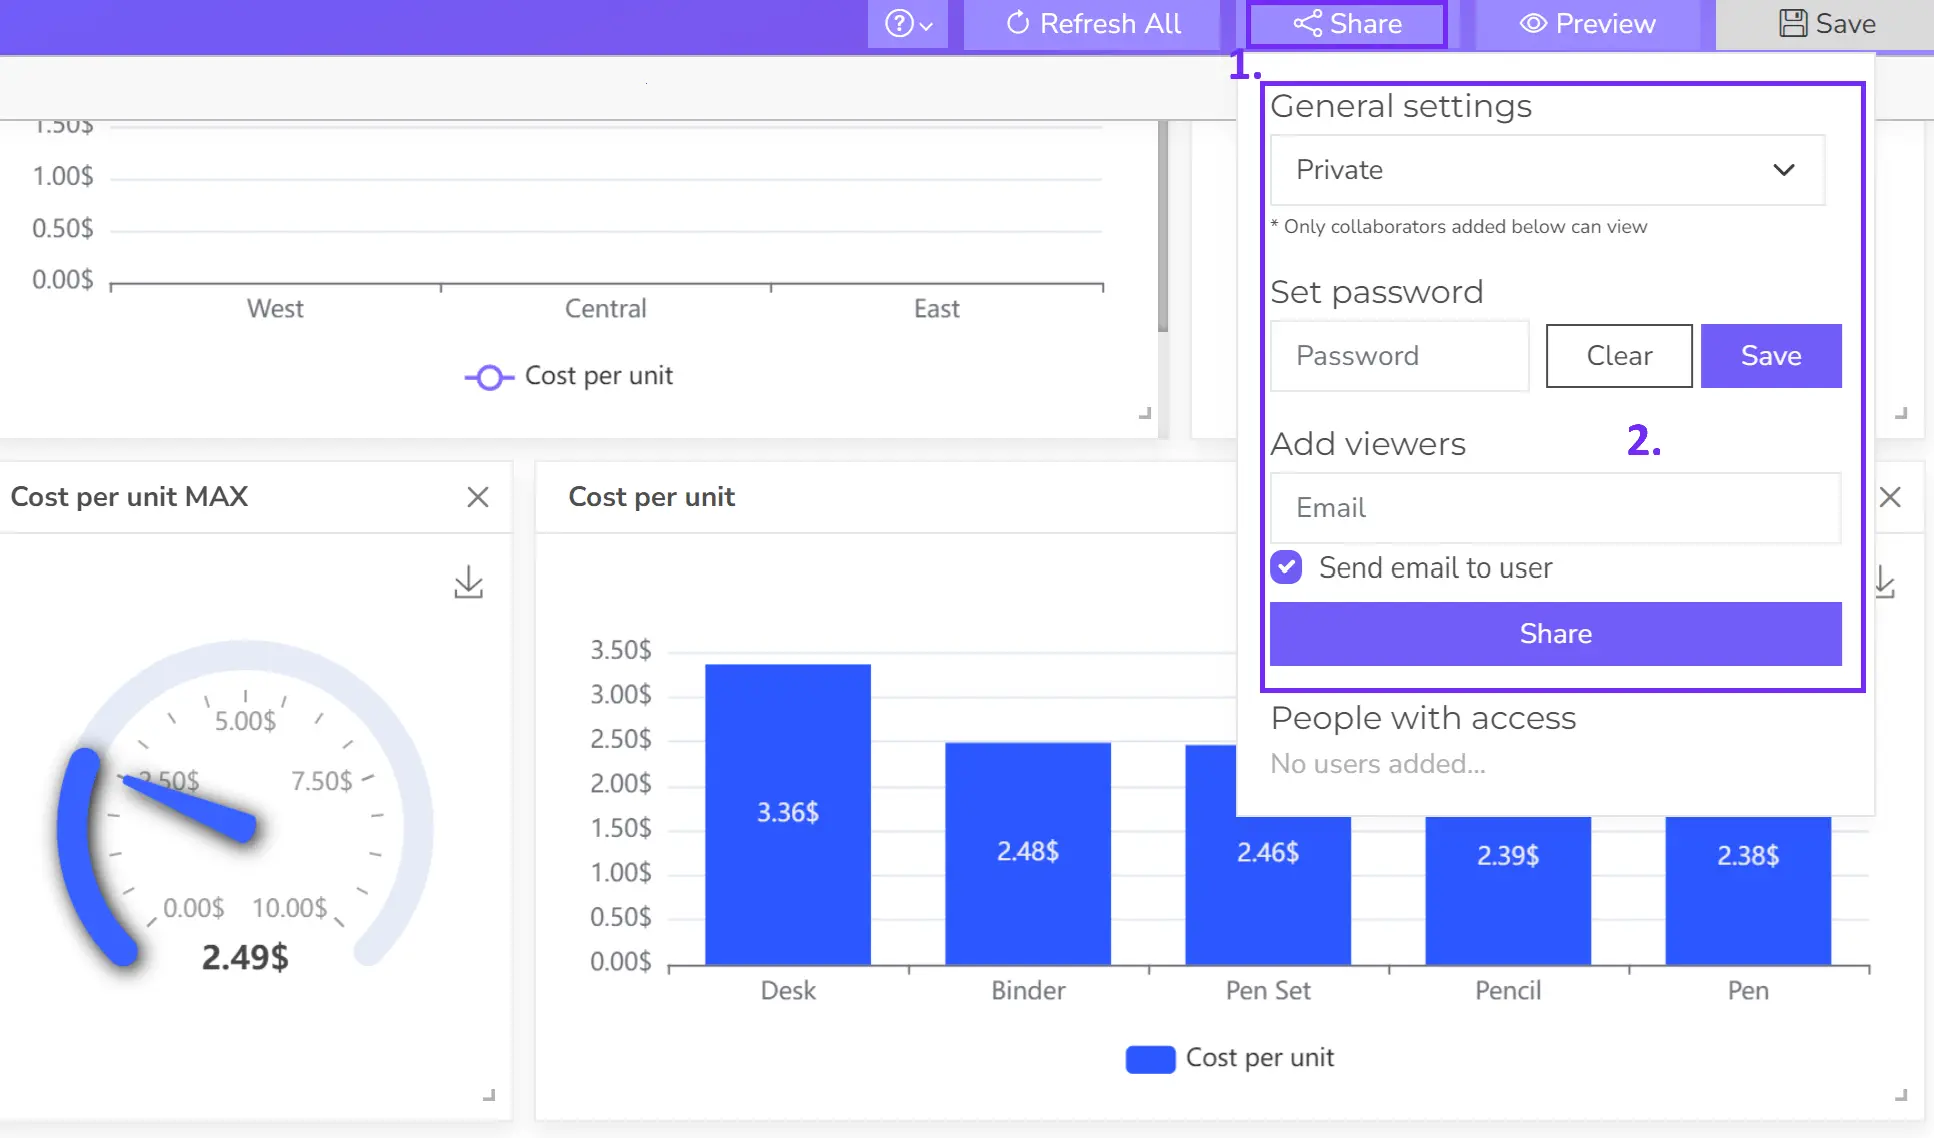
- Share your dashboard
Once you’re satisfied with your creation, publish the dashboard to empower relevant users with real-time insights.
Reporting gives you a headache?
Upload your data and create professional reports with agentic AI

Start free
Try free and upgrade whenever
Conclusion
Accounting KPIs equip your department with the power of data-driven decision making. By monitoring these key metrics, you can streamline operations, optimize resource allocation, identify areas for cost reduction, and ensure the financial health of your organization.
These 15 essential accounting KPIs provide valuable insights into various aspects of your financial performance, including profitability, liquidity, solvency, and efficiency. By proactively tracking and analyzing these metrics, you can gain a deeper understanding of your financial standing, make informed decisions, and contribute to the overall success of your organization.
FAQ
The frequency depends on the KPI. Key metrics like daily cash flow need daily monitoring, while others like inventory turnover might be tracked monthly or quarterly.
Both the accounting department (data analysis) and relevant stakeholders (informed decisions) should be involved.
Spreadsheets can work for basic needs, but accounting software or business intelligence (BI) tools offer better automation and analysis capabilities.
Effective inventory management can be achieved through a two-pronged approach: boosting sales and optimizing inventory levels. On the sales side, focus on strategies to increase demand for your products. On the inventory side, implement practices like more frequent ordering in smaller quantities to minimize stock holding costs. This way, you can strike a balance between meeting customer needs and avoiding excess inventory.
From data to report in one minute or less with Ajelix BI