Restaurant Dashboard Examples & Templates

While the kitchen is a restaurant’s heart, data is its brain. Restaurant dashboards offer a comprehensive view of its performance, from sales and inventory to labor and customer satisfaction.
Using data, restaurants can identify trends, optimize operations, and deliver exceptional customer experiences. That’s where a well-designed restaurant admin dashboard becomes indispensable. This article delves into the power of effective data visualization, showcasing compelling restaurant sales dashboard and restaurant management dashboard examples.
We’ll explore how leveraging a comprehensive KPI dashboard can provide actionable insights, and offer practical dashboard template resources to help you streamline your restaurant’s operations and drive profitability.
Change the way you work with agentic AI
One-click dashboards,KPI tracking, and AI-powered insights—for work that actually gets done.

What is a restaurant dashboard?
A restaurant dashboard is a centralized platform that provides real-time insights into key performance indicators (KPIs), enabling restaurant owners to track data and make informed decisions.
From sales and inventory to labor and customer satisfaction, dashboards offer a comprehensive solution for improving your business operations.
5 Restaurant Dashboard Types
Restaurant dashboards can be categorized based on their focus, details, and visualized KPIs. Each restaurant owner has different areas that should be measured, and digital dashboards are a perfect way to do that.
Learn 5 different restaurant dashboard types and their differences:
- General Dashboard
- Sales Dashboard
- Inventory Dashboard
- Labor Dashboard
- Customer Satisfaction Dashboard
1. General Restaurant Dashboard Example
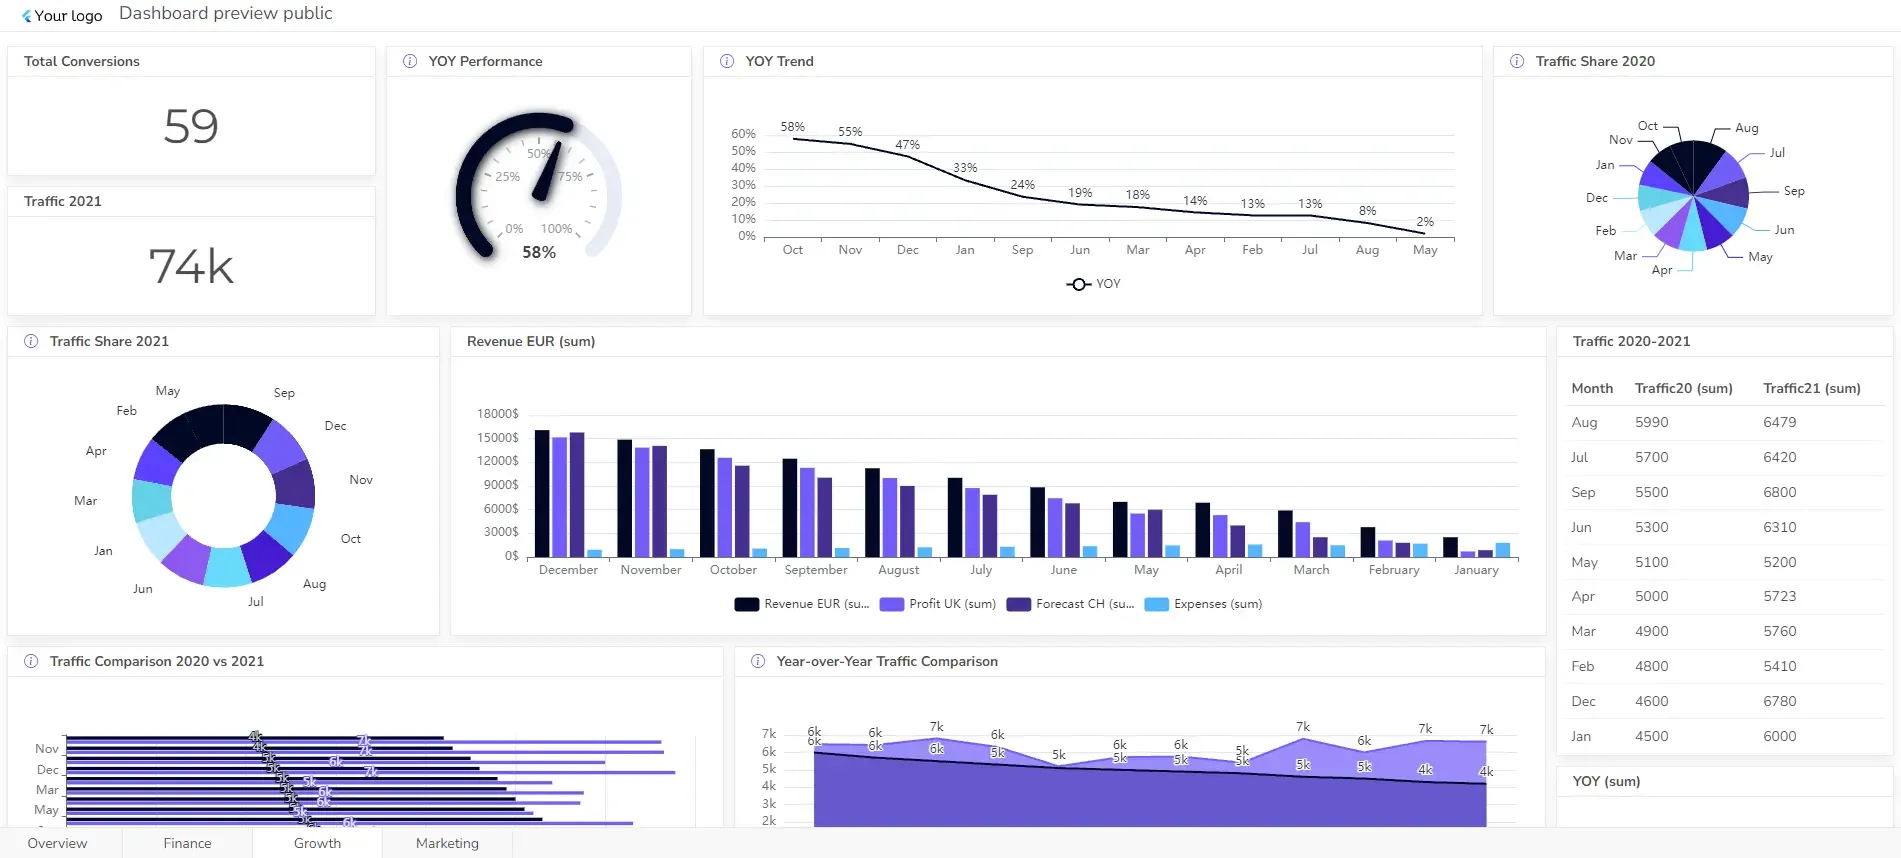
The General Dashboard offers a comprehensive overview of key performance indicators, providing a snapshot of the restaurant’s overall health.
Purpose: Provides a holistic view of restaurant performance, allowing managers to identify areas for improvement and make informed decisions quickly.
Key KPIs and Metrics
- Revenue: Total sales – Returns and discounts
- Expenses: Cost of goods sold + Labor costs + Operating expenses
- Profit Margin: (Revenue – Expenses) / Revenue
- Calculate this metric using a profit margin calculator.
- Customer Traffic: Number of customers served / Number of days open
- Average Check Value: Total revenue / Number of customers served
- Table Turnover Rate: Number of tables turned / Number of available tables
- Employee productivity
- Inventory levels
- Labor costs
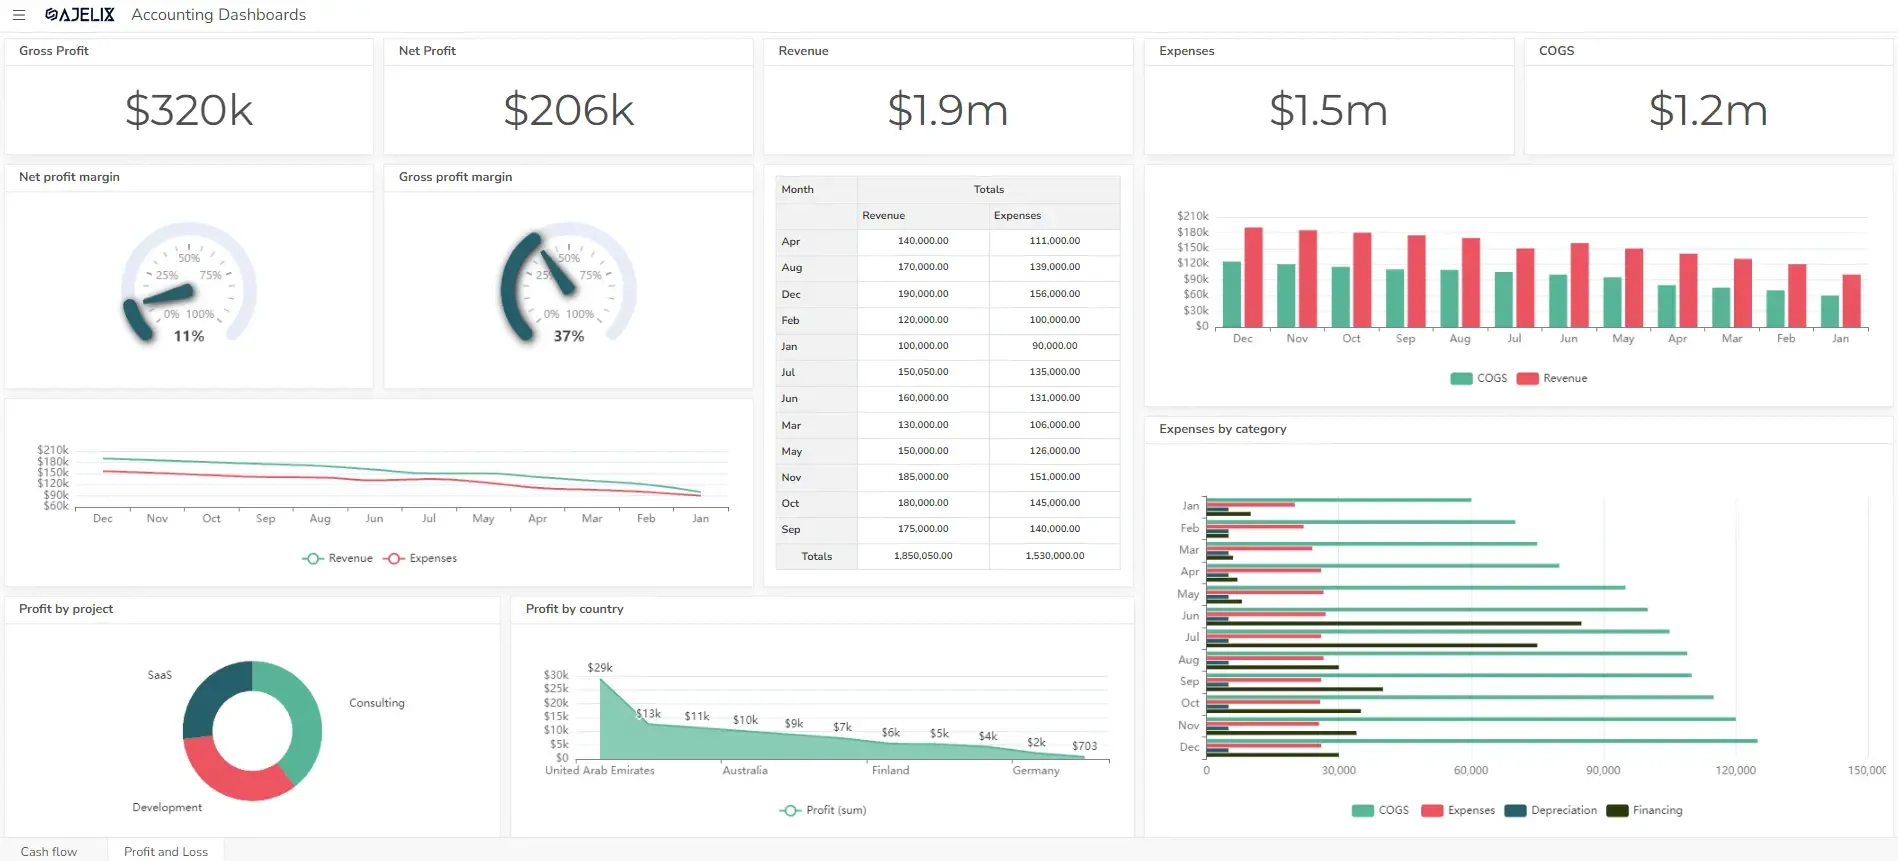
You can explore more than 20 financial KPIs that you can include in your dashboard for detailed analysis.
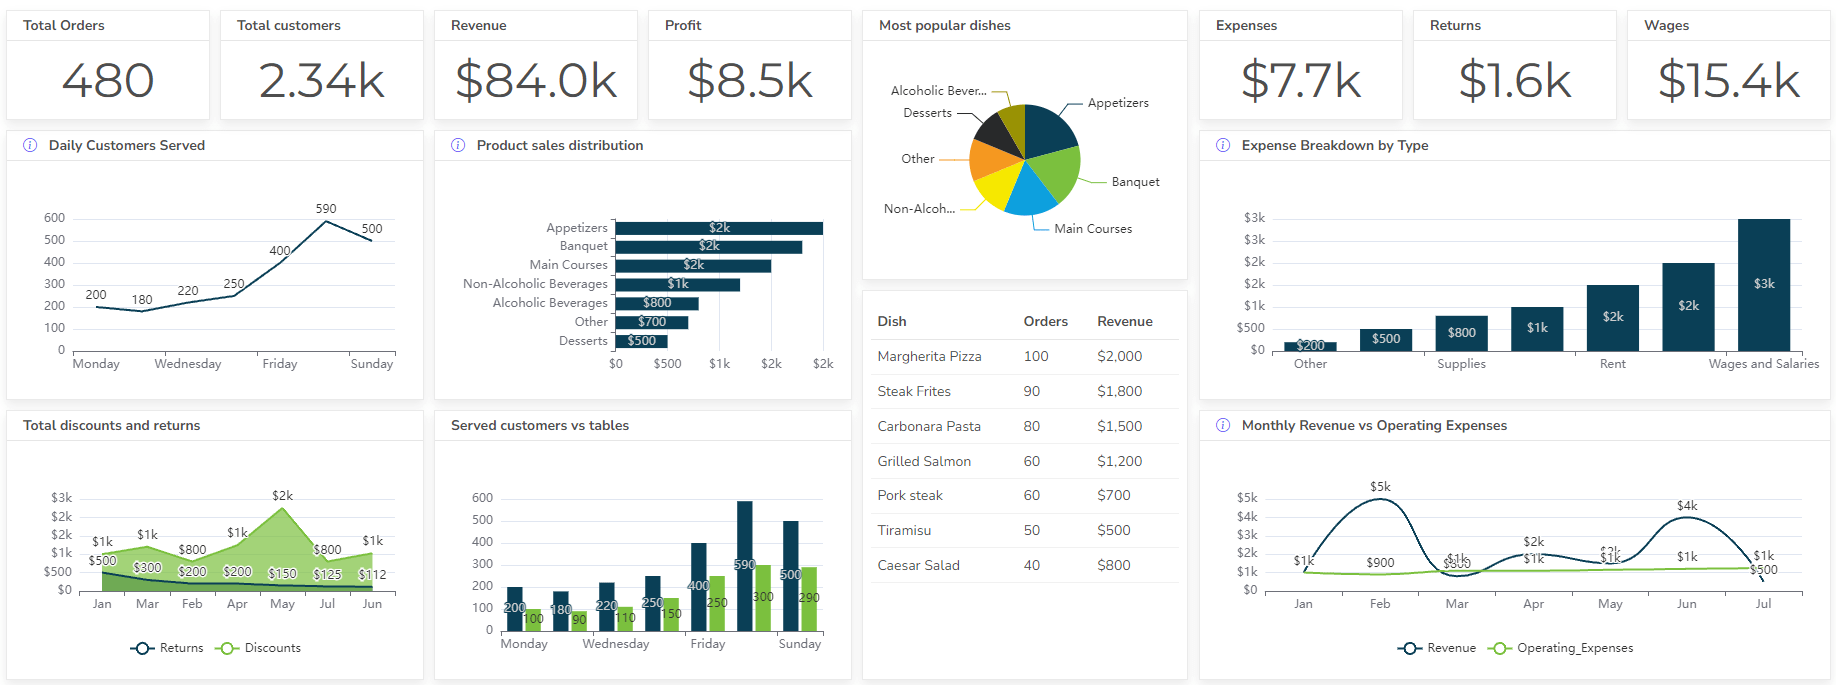
2. Restaurant Sales Dashboard Example
A robust restaurant sales dashboard is the cornerstone of effective restaurant management dashboard functionality, providing a clear, real-time view of revenue streams. Imagine instantly accessing your average restaurant sales per day, enabling you to identify peak hours and slow periods for strategic staffing and inventory adjustments.
In this section you can find a practical example of a sales report in restaurant format, showcasing the power of detailed restaurant sales reports.
The example shows how these dashboards can visualize crucial metrics like total sales, sales by category, and even individual server performance, allowing you to make data-driven decisions that directly impact your bottom line.
Purpose: Helps managers understand sales performance, identify top-selling items, and optimize restaurant marketing strategies.
Restaurant Performance Metrics
Understanding restaurant performance metrics is essential for any establishment aiming for sustained success. This section explores crucial KPIs for the food industry, giving you KPIs from front-of-house to back-of-house operations.
Whether you’re managing a bustling restaurant, a dynamic bar KPI set, a high-volume kpi for food delivery service, or a specialized kpi for barista station, tracking the right data is paramount.
Here are the core KPI hospitality measures, including customer satisfaction, table turnover rates, and food cost percentages, and even specialized catering KPIs.
- Total Sales: Sum of all sales transactions
- Sales by Product Category: Sum of sales for each product category
- Sales by Location: Sum of sales for each location
- Sales Trends Over Time: Graph of sales data over a specified period
- Customer Acquisition Rate: Number of new customers / Total number of customers
- Customer Retention Rate: Number of returning customers / Total number of customers
- Average check value
- Peak sales times
Discover other marketing KPIs that you can include in your dashboard.
By effectively utilizing these KPI in hospitality and implementing comprehensive restaurants performance analysis through detailed restaurant metrics reporting, you can identify areas for improvement and optimize your operations for maximum efficiency and profitability.
3. Inventory Dashboard Example For Restaurants
The Inventory dashboard provides insights into inventory levels, costs, and usage. This dashboard can help managers optimize inventory management, reduce costs, and prevent shortages or overstocking.
A restaurant inventory dashboard is crucial for efficient stock management, replacing basic restaurant inventory spreadsheets. It provides real-time visibility into stock levels, tracks expiration dates, and offers low-stock alerts.
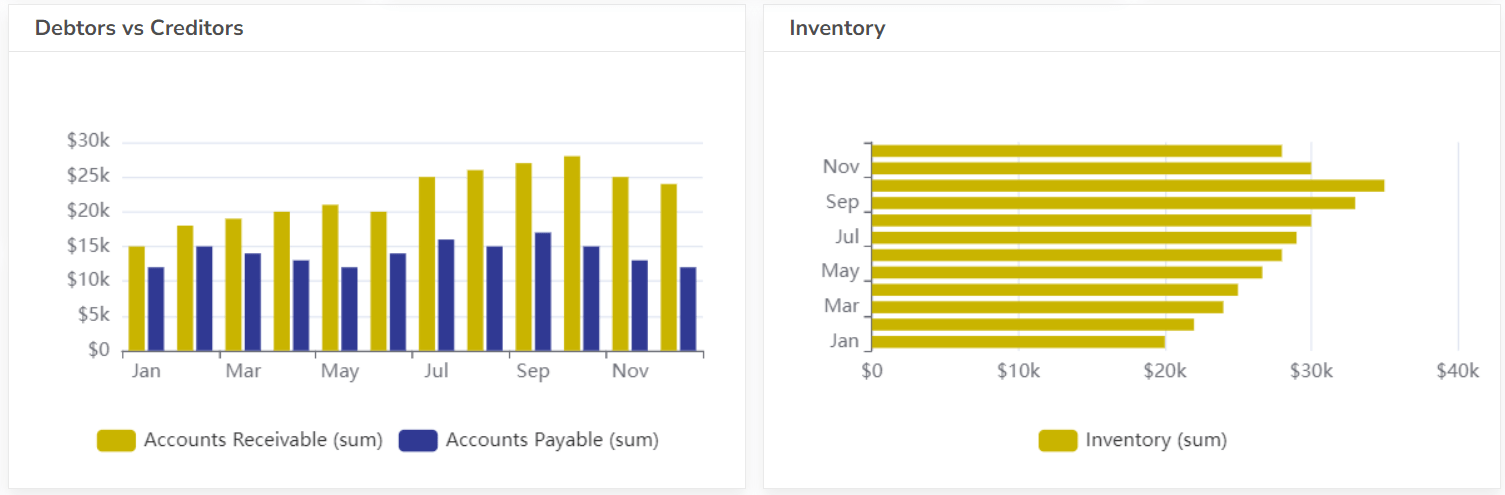
For cafe inventory and inventory management coffee shop, this ensures essential supplies are always available. Beyond food, it can manage a restaurant equipment inventory list.
Purpose: Ensures efficient inventory management, reduces food costs, and prevents stockouts.
A kitchen monitor displaying this data optimizes ordering, reduces waste, and boosts profitability. Integrating with a food inventory management system allows for sales vs. inventory analysis.
Key KPIs and Metrics
- Inventory Levels by Item: Quantity of each item in stock
- Inventory Costs: Cost of goods sold / Average inventory value
- Food Cost Percentage: Cost of goods sold / Revenue
- Inventory Turnover Rate: Cost of goods sold / Average inventory value
- Stockouts: Number of items out of stock
- Food Waste: Quantity of food discarded
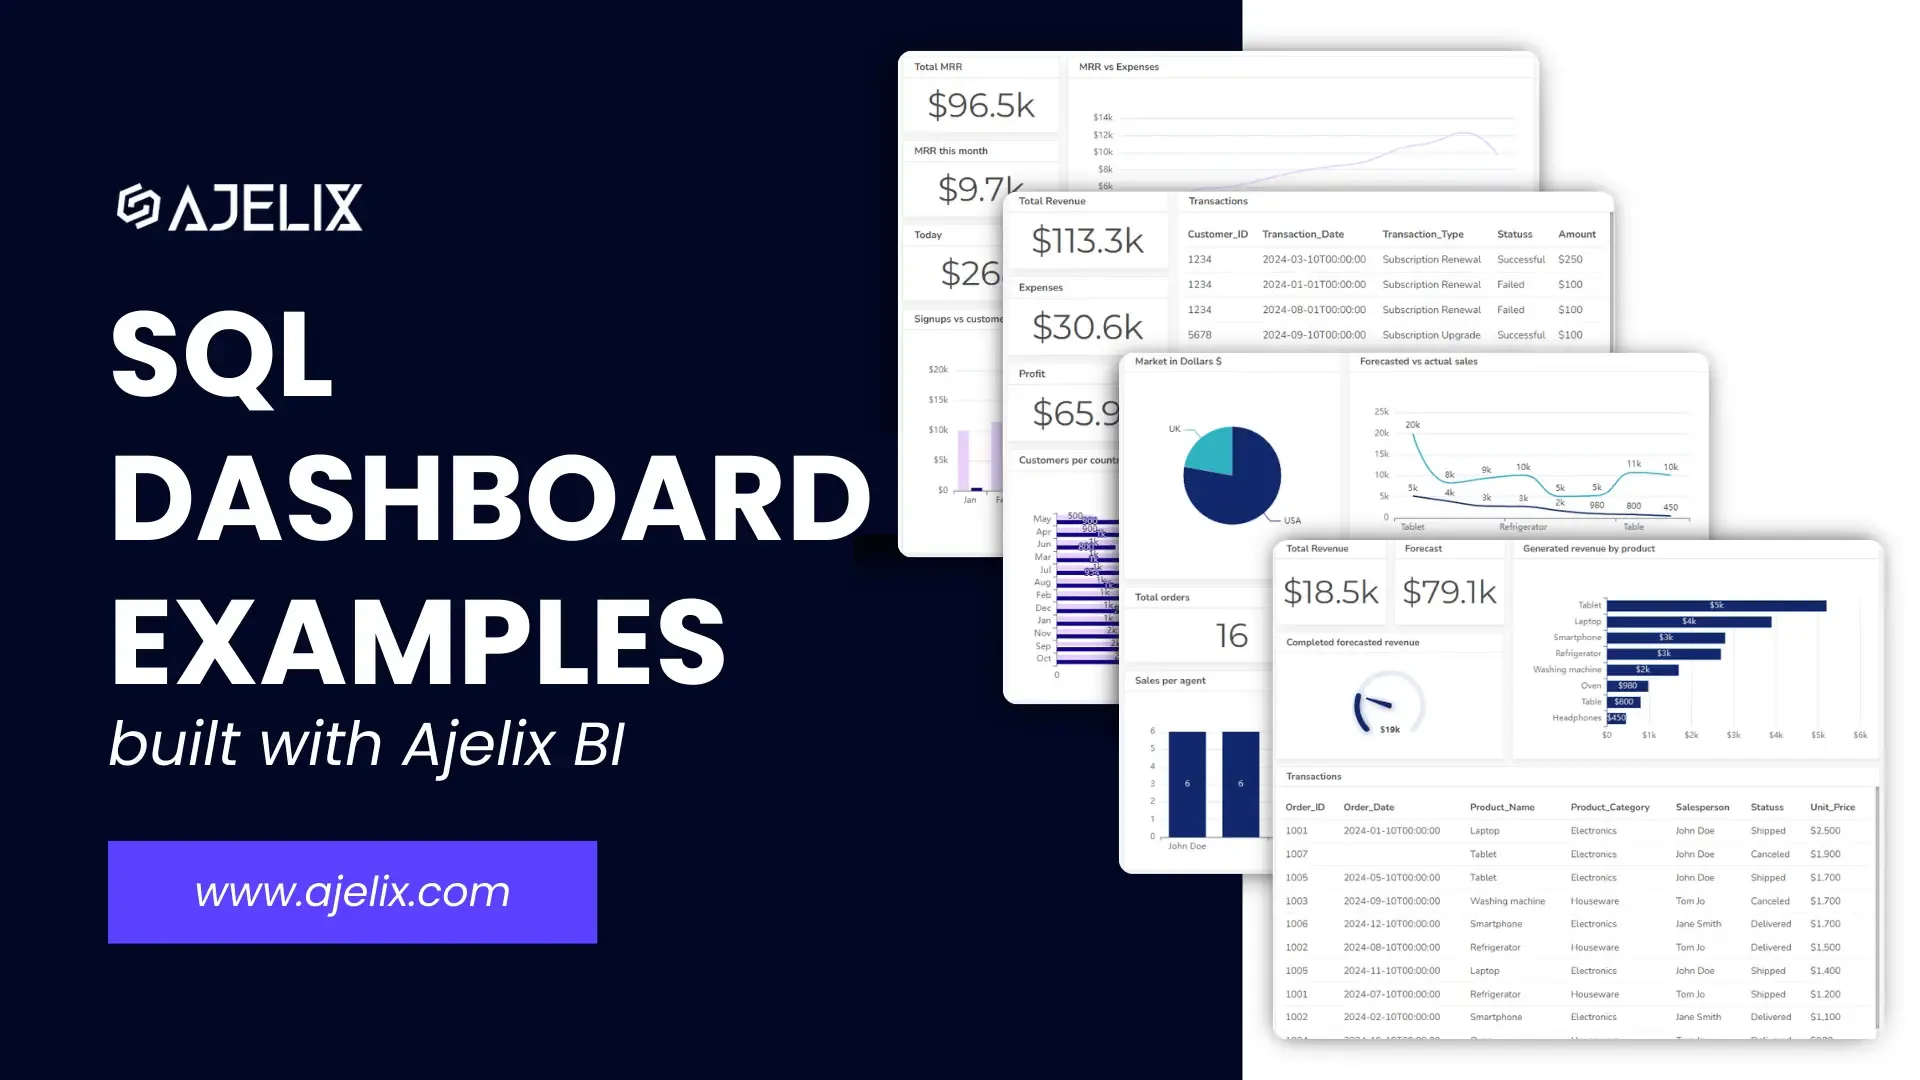
Explore how SQL dashboards can help you track real-time data all in one place.
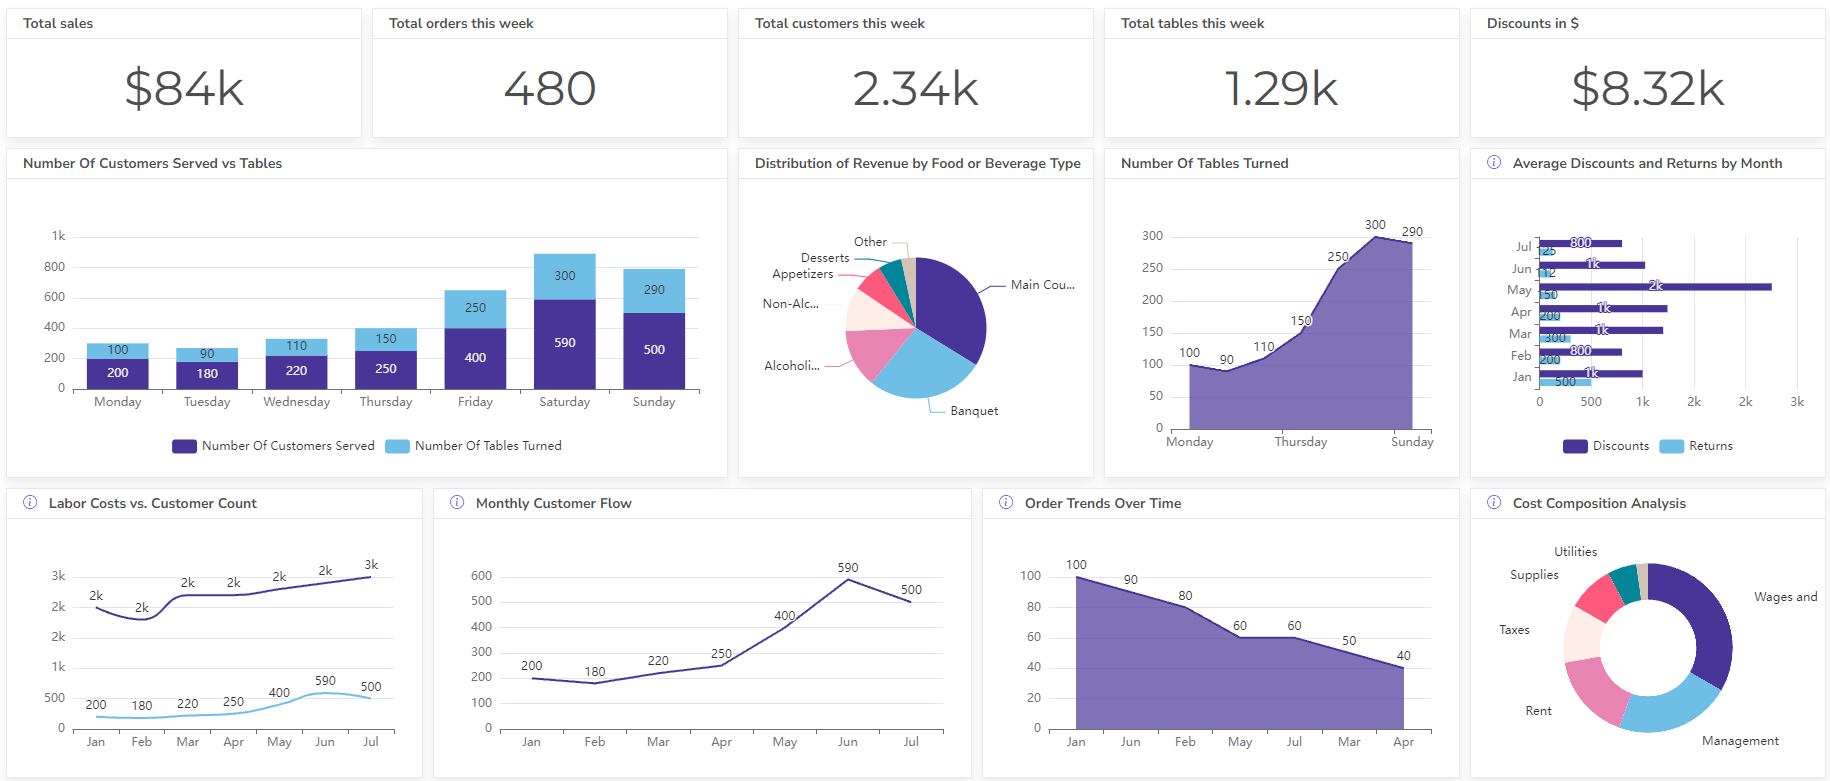
4. Restaurant Labor Dashboard Example
A comprehensive restaurant labor dashboard is essential for optimizing staffing and controlling costs. This dynamic can help managers effectively track restaurant labor in real-time, providing insights into employee hours, scheduling adherence, and labor costs.
By utilizing robust labor tracking features, restaurants can identify areas for improvement, such as overstaffing during slow periods or understaffing during peak hours. A well-designed restaurant tracker provides visual representations of key labor metrics, enabling quick and informed decisions.
This allows for proactive management, ensuring efficient staffing levels and ultimately improving the bottom line through precise restaurant tracking.
Purpose: Helps manage labor costs, improve employee scheduling, and enhance productivity.
Key KPIs and Metrics
- Labor Costs: Total wages and benefits paid to employees
- Employee Turnover Rate: Number of employees leaving / Average number of employees
- Employee Scheduling: Schedule of employee shifts
- Labor Productivity: Total sales / Total labor hours
- Overtime Hours: Total hours worked beyond regular hours
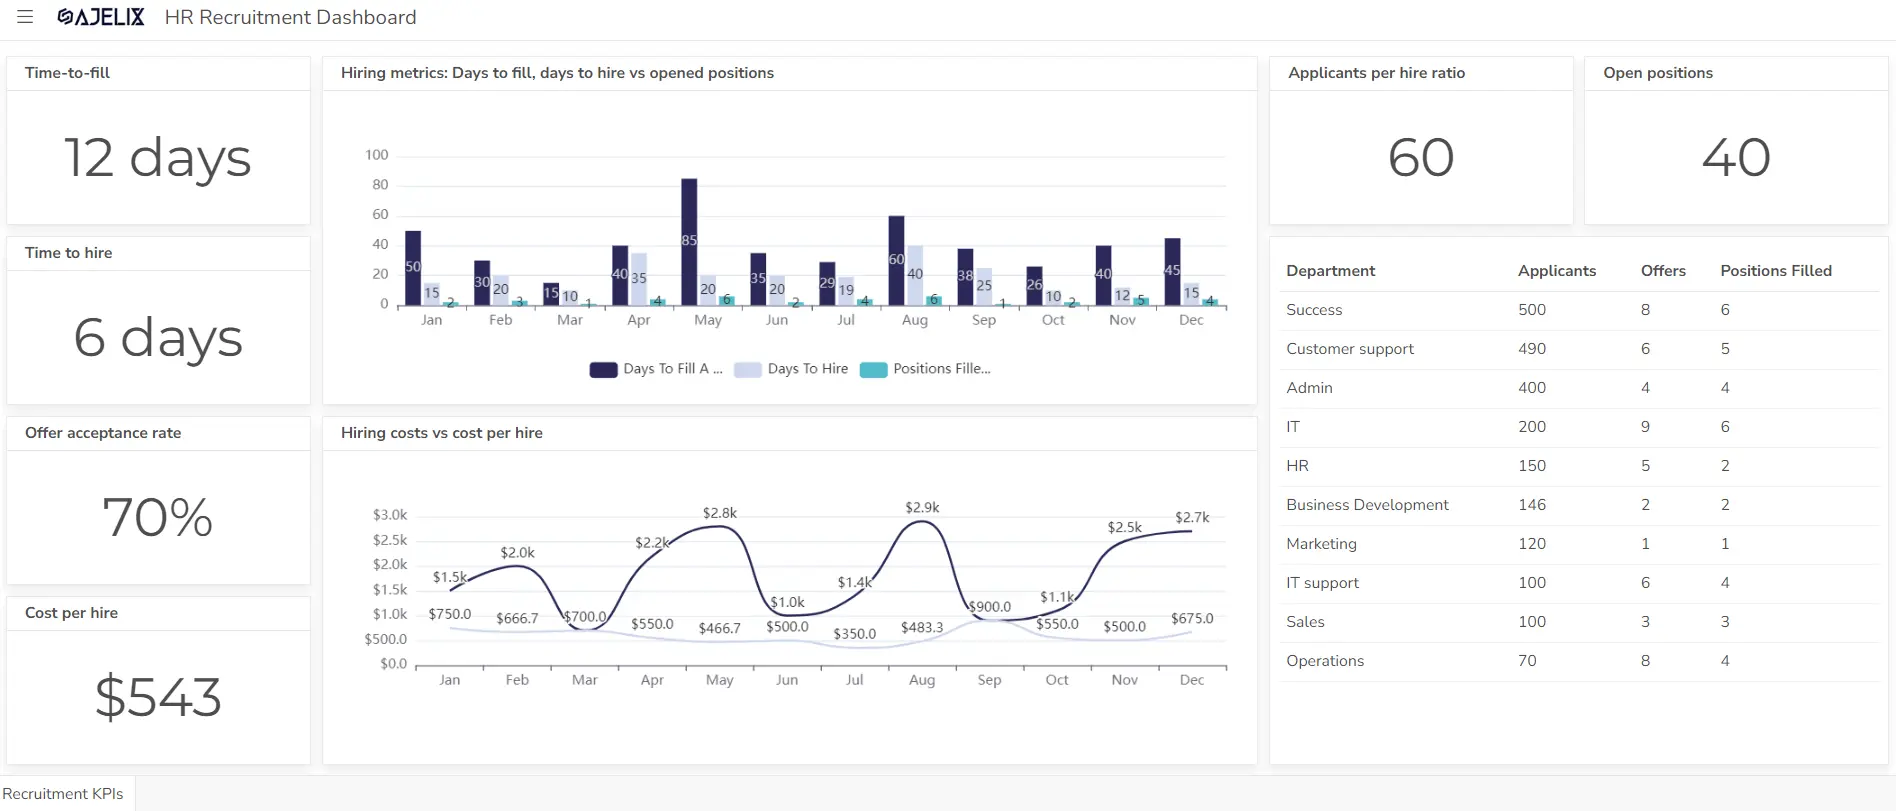
Explore other HR KPIs and check HR dashboard examples that could help your business track data.
5. Restaurant Customer Satisfaction Dashboard
The Customer Satisfaction Dashboard provides insights into customer feedback and satisfaction levels.
Purpose: Measures customer satisfaction, identifies areas for improvement, and enhances the overall customer experience.
Key KPIs and Metrics
- Customer Satisfaction Ratings: Average customer satisfaction scores
- Net Promoter Score (NPS): Percentage of promoters – Percentage of detractors
- Customer Feedback Analysis: Analysis of customer comments and reviews
- Repeat Customer Rate: Percentage of customers who have made multiple purchases
- Complaint Resolution Time: Average time taken to resolve customer complaints
Tools For Dashboard Creation
Here are some popular tools that can be used to create restaurant dashboards:
- Ajelix BI: A cloud-based BI platform designed for restaurants, offering pre-built dashboards and analytics specifically tailored to the industry.
- Tableau: A powerful and flexible BI tool that can be used to create custom dashboards for restaurants.
- Power BI: Microsoft’s cloud-based BI service that offers a wide range of features and integrations.
- Qlik Sense: A self-service BI platform that allows users to create interactive dashboards and explore data easily.
Reporting gives you a headache?
Upload your data and create professional reports with agentic AI

Start free
Try free and upgrade whenever
Conclusions
In conclusion, using effective dashboards is no longer a luxury, but a necessity for modern restaurants. From the detailed insights provided by a restaurant sales dashboard, enabling analysis of average restaurant sales per day and the generation of comprehensive restaurant sales reports, to the operational control offered by a restaurant management dashboard, the benefits are undeniable.
Implementing a KPI dashboard allows for precise monitoring of vital restaurant performance metrics, including crucial kpi hospitality and kpis for food industry indicators, ensuring efficient operations.
Whether it’s tracking bar KPI, kpi for barista, or kpi for food delivery, these tools allow for data-driven decisions. Streamlining restaurant inventory management with a dynamic dashboard, replacing static restaurant inventory spreadsheet methods, helps minimize waste and optimize stock, especially crucial for cafe inventory and inventory management coffee shop.
The restaurant labor dashboard empowers managers to effectively track restaurant labor, improving efficiency and controlling costs. By utilizing readily available dashboard template options, you can create a customized system that provides a clear, real-time view of your restaurant’s performance, ultimately leading to increased profitability and customer satisfaction.
Explore other dashboards


Ready to create your dashboard?