15 KPI For Quality Assurance: Calculate Quality KPIs
Quality KPIs are key performance indicators for quality management used to assess a company’s performance in delivering quality products or services. Essentially, they track how well a company meets its own quality standards.
By monitoring KPIs, companies can identify areas for improvement and track their progress over time. These metrics are critical in regulated industries.
Ensuring quality is a cornerstone of any successful business. But how do you measure it? This article dives into Quality Assurance KPIs (Key Performance Indicators), providing you with the tools to calculate these metrics and gain valuable insights into your quality control processes.
Change the way you work with agentic AI
One-click dashboards,KPI tracking, and AI-powered insights—for work that actually gets done.

What are quality KPIs?
Quality KPIs are measurable markers that track how well a company meets its quality standards for products or services. They gauge how “good” your product or service is.
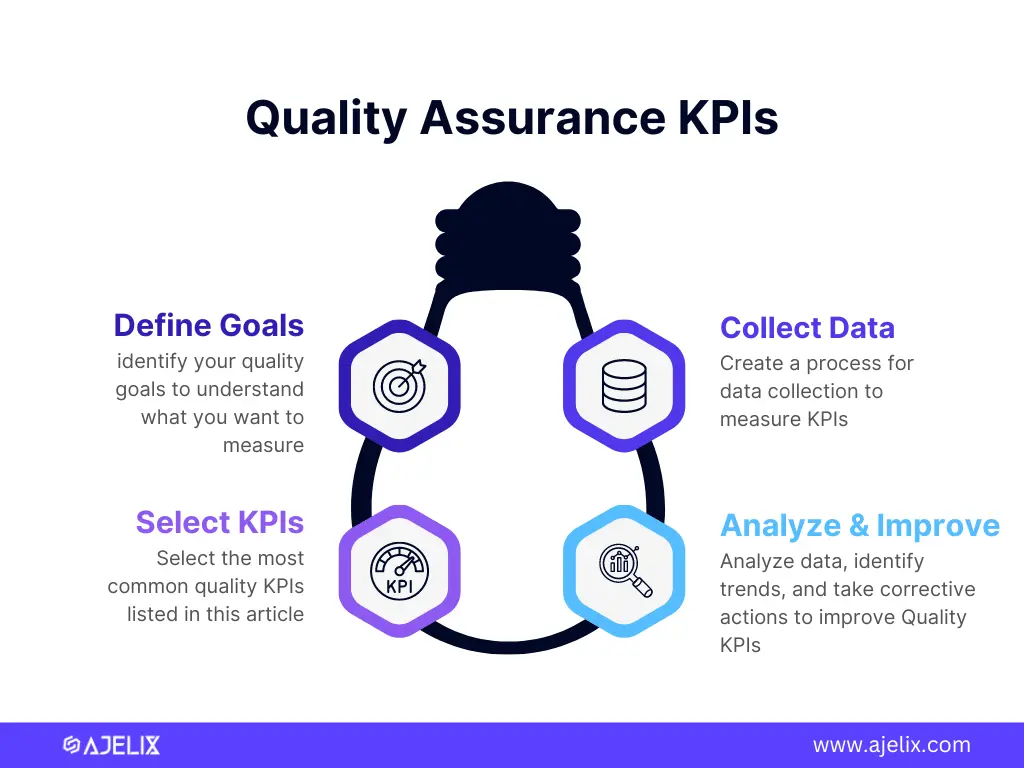
To implement quality management you should create a quality KPI tracking process:
- Define goals – what do you want to measure? what problems do you have?
- Select KPIs – if you know the problems you have, you can easily pick quality KPIs
- Collect data – introduce the process of how quality data is collected and stored for calculation
- Analyze & improve – track data, identify problems and improve the process
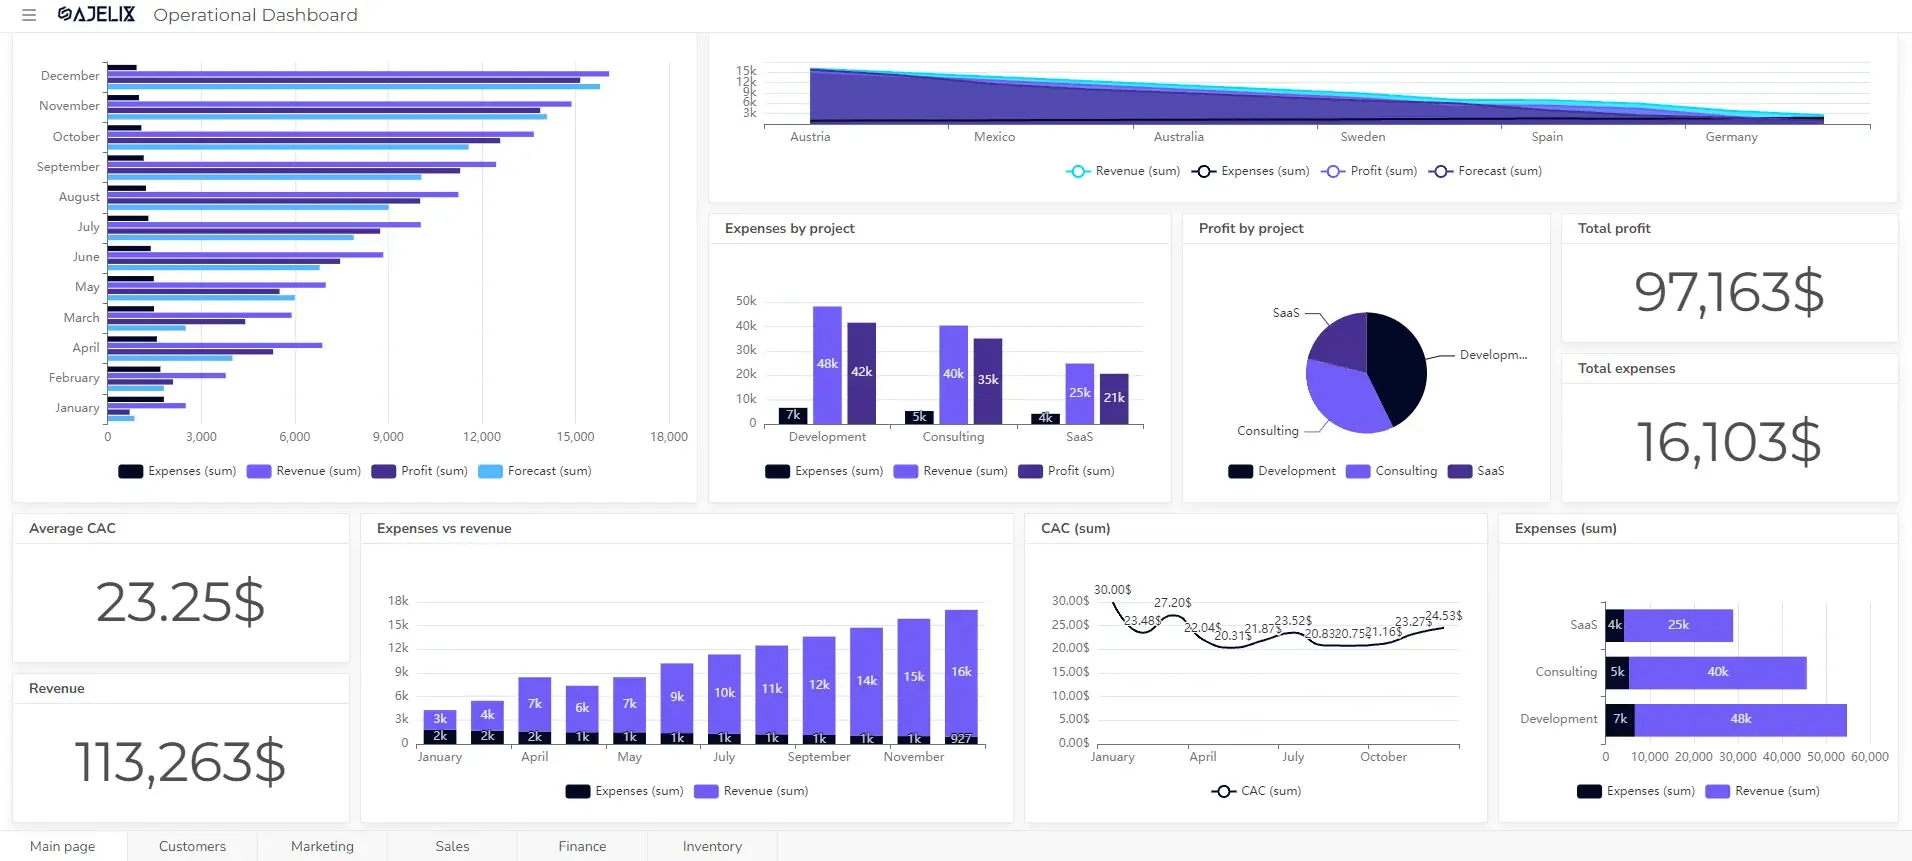
Did you know you can automate the KPI calculation process and get live updates for your data? Set up your quality KPI dashboard on Ajelix BI.
List With 15 Quality KPIs
- Customer Satisfaction Score (CSAT)
- Net Promoter Score (NPS)
- Customer Retention Rate
- Customer Complaint Rate
- First-Time Quality (FTQ)
- Defect Rate
- Rework Rate
- Cycle Time
- Cost of Poor Quality
- Return on Quality
- On-Time Delivery Rate
- Inventory Accuracy
- Employee Training Completion Rate
- Employee Error Rate
- Employee Satisfaction
1. Customer-Centric Quality KPIs
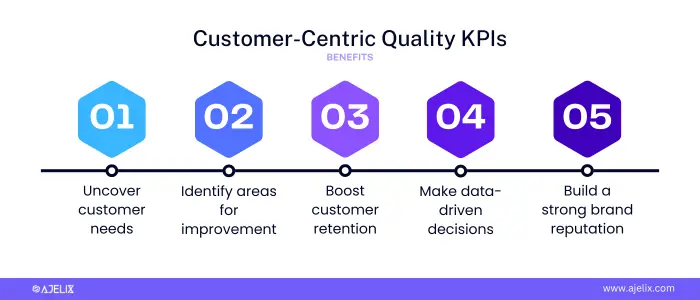
The main goal of tracking customer-centric quality KPIs is to ensure your products or services are meeting and exceeding customer expectations. By focusing on customer satisfaction and loyalty, you build a strong foundation for sustainable business growth. This is especially vital for e-commerce businesses.
By tracking and analyzing customer-centric metrics, you can:
- Uncover customer needs and expectations: get a clear picture of what delights (or frustrates) your customers.
- Identify areas for improvement: pinpoint weaknesses in your products or services.
- Boost customer retention: track churn rates, to identify at-risk customers and take action to win them back. Connect your data with a digital dashboard and get real-time data updates.
- Make data-driven decisions: prioritize quality improvements that truly matter to your customers.
- Build a strong brand reputation: get positive word-of-mouth marketing and a reputation for quality.
1.1. Customer Satisfaction Score (CSAT)
Measures customer happiness with a product or service, often through surveys after interactions. A high CSAT indicates customers are pleased with what you offer.
CSAT = (Number of Satisfied Customers / Total Number of Responses) x 100
- Number of Satisfied Customers: This represents the total number of customers who responded with a high satisfaction rating on your survey. Typically, a 4 or 5 on a 5-point scale (or similar positive ratings on a different scale) are considered satisfied. Check HR KPIs and learn how to measure employee satisfaction.
- Total Number of Responses: This is the total number of customers who participated in your CSAT survey and submitted a response.
Example: Let’s say you send a CSAT survey to 100 customers and receive 70 responses. Out of those 70 responses, 50 customers indicated they were satisfied with your service.
CSAT Calculation: CSAT = (50 Satisfied Customers / 70 Total Responses) x 100 = 71.4%
There’s no universally perfect CSAT score, as it can vary depending on your industry and customer base. However, a good CSAT score generally falls within the 75% to 85% range.
1.2. Net Promoter Score (NPS)
Indicates customer loyalty and likelihood to recommend your business to others. NPS is measured on a scale of 1-10, with higher scores reflecting greater advocacy.
NPS = % of Promoters – % of Detractors
- % of Promoters: percentage of customers who respond with a 9 or 10 on a 0-10 scale when asked “How likely are you to recommend our company to a friend or colleague?” Promoters are considered loyal enthusiasts who are likely to recommend your business to others.
- % of Detractors: percentage of customers who respond with a 0-6 on the same 0-10 scale. Detractors are unhappy customers who may spread negative word-of-mouth.
Example: Let’s say you survey 100 customers and receive responses as follows:
- Promoters (9 or 10): 45 customers
- Passives (7 or 8): 40 customers
- Detractors (0-6): 15 customers
NPS Calculation:
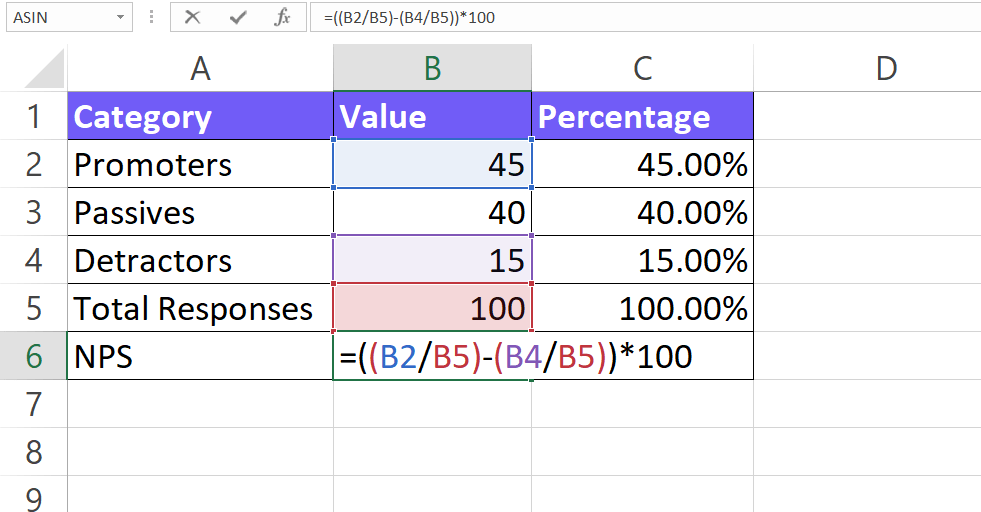
- NPS = (% of Promoters) – (% of Detractors)
- NPS = (45 Promoters / 100 Total Responses) x 100 – (15 Detractors / 100 Total Responses) x 100
- NPS = 45% – 15%
- NPS = 30
Download NPS Excel Template with formula 👇
What’s a Good NPS Score?
NPS scores can range from -100 (all detractors) to 100 (all promoters). Here’s a general interpretation of NPS scores:
| NPS Score Range | Interpretation | Actionable Insights |
|---|---|---|
| -100 to 0 | Detractor Majority | Urgent need to improve customer experience. |
| 0 to 30 | Low Score | Room for improvement in customer satisfaction and loyalty. |
| 30 to 70 | Average Score | Balanced mix of promoters and detractors. |
| 70 to 100 | High Score | Strong customer base with high loyalty. |
1.3. Customer Retention Rate
Tracks how many customers continue to do business with you over a specific period. A high retention rate signifies customer satisfaction and loyalty.
CRR = ((Number of Customers at End of Period) – (Number of New Customers Acquired)) / (Number of Customers at Beginning of Period) x 100
- Number of Customers at End of Period (E): This represents the total number of customers you have after the chosen timeframe.
- Number of New Customers Acquired (N): This represents the total number of new customers you gained during the timeframe.
- Number of Customers at Beginning of Period (S): This represents the total number of customers you had at the start of the timeframe.
Example: Let’s say you begin a month with 100 customers (S), acquire 20 new customers (N) during that month, and conclude the month with 110 customers (E).
CRR Calculation:
- CRR = ((Number of Customers at End of Period (E)) – (Number of New Customers Acquired (N))) / (Number of Customers at Beginning of Period (S)) x 100
- CRR = ((110 customers – 20 new customers) / 100 customers) x 100
- CRR = (90 customers / 100 customers) x 100
- CRR = 90%
A good CRR depends on your specific industry, business model, and customer lifecycle. Below 80% indicates a significant amount of customer churn and suggests a need to improve your customer retention strategies. To track these metrics you can set up an SQL dashboard for real-time data updates. 80% – 90% is considered an average score, suggesting moderate customer churn. Above 90% is considered a high score, signifying strong customer retention.
1.4. Customer Complaint Rate
Measures the frequency of customer dissatisfaction, often tracked through complaints received. A low complaint rate suggests customers are encountering a few issues.
Customer Complaint Rate = (Number of Complaints Received / Total Number of Transactions or Customers) x 100
- Number of Complaints Received: This represents the total number of complaints your business receives within a specific timeframe (e.g., month, quarter, year).
- Total Number of Transactions or Customers: This depends on the context you’re measuring. If looking at complaints per transaction, use the total number of transactions completed during the timeframe.
Example: Let’s say you receive 20 customer complaints in a month and complete 1000 transactions during that same month.
Customer Complaint Rate Calculation (per transaction):
- Customer Complaint Rate = (Number of Complaints Received / Total Number of Transactions) x 100
- Customer Complaint Rate = (20 complaints / 1000 transactions) x 100
- Customer Complaint Rate = 2%
There’s no magic number, but a high rate (above 5%) suggests a need to address customer concerns. A moderate rate (2-5%) warrants attention, while a low rate (below 2%) is positive but shouldn’t lead to complacency. The key is to track trends and address all complaints to show you value customer feedback.
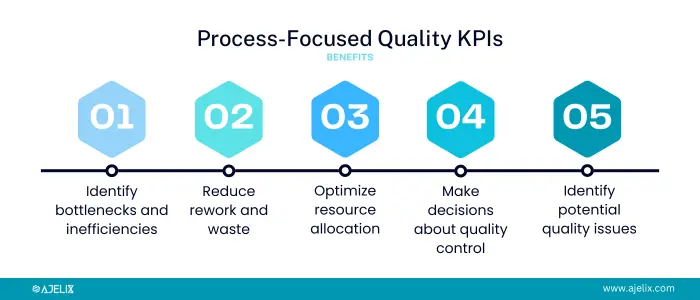
2. Process-Focused Quality KPIs
The main goal of tracking process quality KPIs is to optimize your internal processes to consistently deliver high-quality products or services. By identifying and addressing inefficiencies and quality defects, you can achieve operational excellence and enhance customer satisfaction.
benefits of tracking process quality KPIs:
- Identify bottlenecks and inefficiencies: find out what slows things down or creates errors.
- Reduce rework and waste: catch issues early and prevent costly rework or wasted materials.
- Optimize resource allocation: allocate resources based on data-driven insights into process demands.
- Make informed decisions about quality control investments: track the impact of quality control measures.
- Proactively identify potential quality issues: spot trends that could lead to defects.
- Continuously improve process efficiency and effectiveness: use data to identify areas for streamlining processes and achieving optimal performance.
2.1. First-Time Quality (FTQ)
Measures the percentage of products or services completed correctly the first time around. A high FTQ indicates efficient processes and reduces rework.
FTQ = (Number of Units Completed Correctly on First Try / Total Number of Units Produced) x 100
- Number of Units Completed Correctly on First Try: This represents the total number of products or services that meet all quality standards after the initial production or service delivery.
- Total Number of Units Produced: This represents the total number of products or services produced during a specific timeframe (e.g., day, week, month).
Example: Let’s say a production line produces 100 widgets in a day, and 90 of them meet all quality standards without any rework required.
FTQ Calculation:
- FTQ = (Number of Units Completed Correctly on First Try / Total Number of Units Produced) x 100
- FTQ = (90 widgets / 100 widgets) x 100
- FTQ = 90%
A score below 80% indicates a large number of defects and suggests a need to improve your production processes or quality control measures. 80% – 90% is considered an average score, suggesting room for improvement. Above 90% is considered a high score, signifying a well-functioning production process with minimal defects.
2.2. Defect Rate
Tracks the number of products or services that don’t meet quality standards. A low defect rate signifies a strong production process.
Defect Rate = (Number of Defective Units / Total Number of Units Produced) x 100
- Number of Defective Units: This represents the total number of products or services that fail to meet quality standards and require rework or are scrapped entirely.
- Total Number of Units Produced: This represents the total number of products or services produced during a specific timeframe (e.g., day, week, month).
Example: Let’s say a bakery produces 100 cakes in a day, and 5 of them have defects (e.g., burnt, uneven frosting) and cannot be sold.
Defect Rate Calculation:
- Defect Rate = (Number of Defective Units / Total Number of Units Produced) x 100
- Defect Rate = (5 defective cakes / 100 cakes) x 100
- Defect Rate = 5%
Striving for a low defect rate is ideal, but the “good” benchmark depends on your industry and product complexity. A high rate (above 5%) indicates needing to address quality issues. A moderate rate (2-5%) warrants attention, while a low rate (below 2%) is positive.
To better measure planned vs executed you can use a budgeted vs actual dashboard, which provides a clear visual representation of your project’s progress and spending.
2.3. Rework Rate
Measures the percentage of products or services requiring correction due to errors or defects. A low rework rate indicates efficient processes.
Rework Rate = (Number of Units Reworked / Total Number of Units Produced) x 100
- Number of Units Reworked: the total number of products or services that need to be corrected or repaired because they don’t meet quality standards.
- Total Number of Units Produced: the total number of products or services produced during a specific timeframe (e.g., day, week, month).
Example: Let’s say a clothing factory produces 100 shirts in a day, and 10 of them have defects (e.g., wrong size, stitching errors) and require rework.
Rework Rate Calculation:
- Rework Rate = (Number of Units Reworked / Total Number of Units Produced) x 100
- Rework Rate = (10 shirts reworked / 100 shirts produced) x 100
- Rework Rate = 10%
A high rate (above 10%) suggests quality issues. Moderate rework (5-10%) is manageable, but aim for low (below 5%) by continuously improving processes to reduce wasted time and resources.
2.4. Cycle Time
Tracks the average time it takes to complete a specific process or task. A shorter cycle time suggests efficiency and faster delivery.
Cycle Time = Total Lead Time / Number of Units Completed
- Total Lead Time: the total elapsed time between when a unit enters the process (or a task begins) and when it is completed and ready for the next step or delivery to the customer.
- Number of Units Completed: the total number of units (products, services, tasks) that have been completed within the chosen timeframe.
Example: Let’s say a company takes orders for custom furniture. The total lead time to build and deliver a custom desk is 20 days. If they complete 5 desks within a month (approximately 20 working days), the cycle time would be:
Cycle Time Calculation:
- Cycle Time = Total Lead Time / Number of Units Completed
- Cycle Time = 20 days / 5 desks
- Cycle Time = 4 days per desk
The ideal cycle time depends on process complexity. A long time (compared to industry standards) suggests inefficiencies that can lead to unhappy customers. A moderate time (average) might have room for improvement. A short time (faster than industry standards) is great, but ensure quality isn’t sacrificed for speed.
Track your cycle time over time and benchmark against your industry to identify areas for improvement. Real-time business intelligence tools can help you track this data.
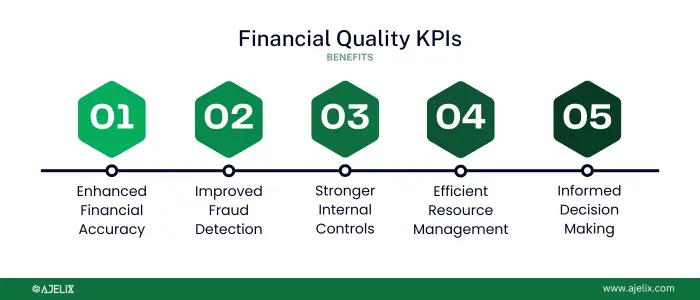
3. Financial Quality KPIs
The main goal of tracking Financial Quality Assurance KPIs is to ensure the integrity and reliability of your financial data and processes. This fosters trust in your financial reporting, safeguards your assets, and allows for data-driven financial decision-making for long-term financial health.
Here are the benefits of tracking financial quality KPIs:
- Enhanced Financial Accuracy: identify and address issues that could lead to inaccurate financial reporting.
- Improved Fraud Detection: detect potential fraud attempts early on.
- Stronger Internal Controls: Monitoring compliance with financial regulations and internal control procedures safeguards your financial processes and reduces the risk of errors or misconduct.
- Efficient Resource Management: Identifying wasteful spending or inefficiencies in financial processes allows for targeted cost-saving measures.
- Informed Decision Making: provides insights to support informed financial decisions.
3.1. Cost of Poor Quality (COPQ)
Tracks the financial cost associated with defects, rework, and customer issues. A low COPQ indicates strong quality control measures.
COPQ = Internal Failure Costs + External Failure Costs
Internal Failure Costs: These are costs associated with defects identified before the product or service reaches the customer. This can include:
- Scrap: Materials or products wasted due to defects.
- Rework: Costs of labor and materials to fix defects.
- Inspection: Costs associated with inspecting products or services for quality control.
External Failure Costs: These are costs associated with defects identified after the product or service reaches the customer. This can include:
- Warranty claims: Costs of repairing or replacing defective products under warranty.
- Returns: Costs associated with processing customer returns due to defects.
- Customer dissatisfaction: Lost sales or customer loyalty due to poor quality.
A lower COPQ is ideal, but the “good” benchmark depends on your industry. A high COPQ (over 20% of sales) signifies major quality issues. A moderate COPQ (10-20% of sales) suggests improvement areas. A low COPQ (below 10% of sales) is positive, but continuous improvement is still important. Explore other financial metrics to track.
3.2. Return on Quality (ROQ)
Measures the financial benefit of investing in quality initiatives. A high ROQ indicates a positive return on investment in quality control.
There isn’t a universally accepted formula for Return on Quality (ROQ) due to the challenge of quantifying some of the benefits. However, here’s most common approach and what a good score might indicate:
ROQ (%) = [(Cost of Poor Quality (Before) – Cost of Poor Quality (After)) / Cost of Quality Initiatives] x 100
- Cost of Poor Quality (Before): defects incurred before implementing quality improvement initiatives (includes internal and external failure costs).
- Cost of Poor Quality (After): defects incurred after implementing quality improvement initiatives.
- Cost of Quality Initiatives: The total cost of resources invested in quality improvement programs (e.g., training, new equipment).
Example: Let’s say a company spends $20,000 per month on quality initiatives and their COPQ drops from $50,000 to $30,000 per month after implementing these initiatives.
ROQ Calculation:
- Cost Savings = $50,000 (Before) – $30,000 (After) = $20,000
- ROQ = ($20,000 Cost Savings / $20,000 Quality Initiatives) x 100
- ROQ = 100%
In this example, the company sees a 100% return on their investment in quality initiatives based on cost savings alone. However, this doesn’t account for potential benefits like increased sales or customer satisfaction. You can create a profit and loss dashboard to help you track progess.
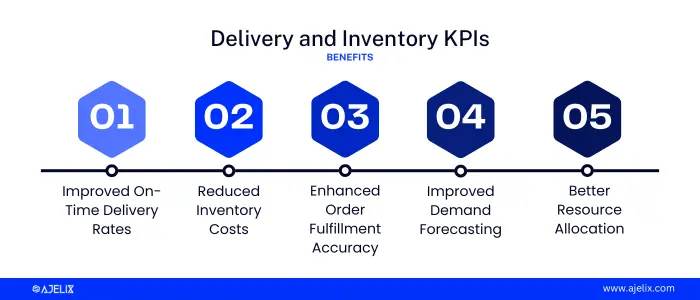
4. Delivery and Inventory KPIs
The main goal of tracking Delivery and Inventory KPIs is to optimize your supply chain for efficient order fulfillment, inventory management, and on-time deliveries. This translates to reduced costs, improved customer satisfaction, and a competitive advantage in the marketplace. Efficient delivery and inventory processes play a pivotal role in customer satisfaction and operational success. For e-commerce businesses looking to enhance these KPIs, leveraging professional eCommerce order fulfillment services can make a substantial difference. From precise order processing to timely shipping, specialized fulfillment solutions streamline each step from click to delivery, helping companies maintain high on-time delivery rates, accurate inventory records, and positive customer experiences.
- Improved On-Time Delivery Rates: identify bottlenecks and inefficiencies within your delivery process to get faster, more reliable deliveries and happier customers.
- Reduced Inventory Costs: optimize your inventory management to minimize storage costs and the risk of stockouts or overstocking to free up capital.
- Enhanced Order Fulfillment Accuracy: ensure orders are fulfilled correctly and completely to minimize the need for returns and corrections, reducing costs and improving customer satisfaction.
- Improved Demand Forecasting: get more accurate demand forecasting to maintain optimal inventory levels and meet customer needs without unnecessary stockpiling.
- Better Resource Allocation: allocate resources effectively for order fulfillment and inventory management to ensure you have the right people and resources in place to meet customer demand efficiently.
4.1. On-Time Delivery Rate
Tracks the percentage of orders delivered to customers by the promised date. A high on-time delivery rate reflects reliability and customer satisfaction.
OTD Rate = (Number of On-Time Deliveries / Total Number of Deliveries) x 100
Variables Explained:
- Number of On-Time Deliveries: the total number of orders or deliveries that reach the customer by the promised date and time.
- Total Number of Deliveries: the total number of orders or deliveries shipped within a specific timeframe (e.g., day, week, month).
Example: Let’s say an online retailer ships 100 orders in a week. Out of those, 92 orders arrive at the customer’s location on time or before the promised delivery date.
OTD Rate Calculation:
- OTD Rate = (Number of On-Time Deliveries / Total Number of Deliveries) x 100
- OTD Rate = (92 on-time deliveries / 100 total deliveries) x 100
- OTD Rate = 92%
Aim for a high On-Time Delivery Rate (OTD Rate). While the “good” rate depends on your industry, below 85% suggests needing to address delivery issues. 85-90% is average, but there’s room for improvement. Above 90% is excellent, but keep monitoring to maintain efficiency.
4.2. Inventory Accuracy
Measures the accuracy of your inventory records compared to actual stock levels. High inventory accuracy ensures you have what you need to fulfill orders.
Inventory Accuracy Rate = (Number of Units Physically Counted / Number of Units in Records) x 100
- Number of Units Physically Counted: This represents the actual number of units of each item you have in stock after a physical inventory count.
- Number of Units in Records: This represents the number of units of each item listed in your inventory management system.
Example: Let’s say a bookstore conducts a physical inventory count and finds they have 150 copies of a specific novel on their shelves. According to their inventory records, they should have 145 copies of that novel.
Inventory Accuracy Rate Calculation:
- Inventory Accuracy Rate = (Number of Units Physically Counted / Number of Units in Records) x 100
- Inventory Accuracy Rate = (150 physically counted / 145 in records) x 100
- Inventory Accuracy Rate = 103.45% (rounded to two decimal places)
Important Note: An accuracy rate above 100% typically indicates an error in counting or recording. In this example, there might be extra copies not reflected in the records, or a counting mistake might have occurred.
Below 95% indicates significant discrepancies that need addressing. 95-98% is average, but there’s room for improvement. Above 98% is excellent, but keep working for accuracy.
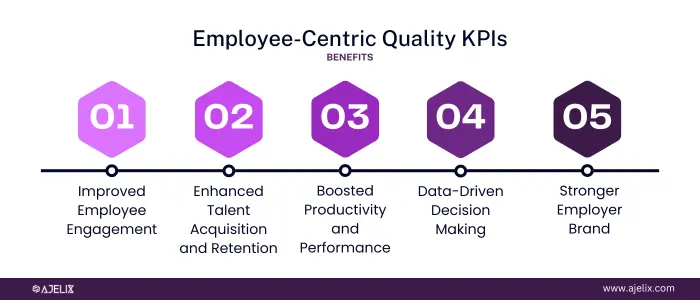
5. Employee-Centric KPIs
The main goal of tracking employee centric quality KPIs is to create a positive and productive work environment that fosters employee engagement, development, and satisfaction. This translates to a more skilled, motivated workforce contributing to the overall success of the organization.
- Improved Employee Engagement: identify areas for improvement in your work environment and culture, leading to a more engaged workforce.
- Enhanced Talent Acquisition and Retention: assess the effectiveness of your recruiting strategies and identify areas to attract and retain top talent.
- Boosted Productivity and Performance: ensure employees have the necessary skills and knowledge to perform their jobs effectively, leading to increased productivity.
- Data-driven decision-making: get information about employee development programs, compensation and benefits packages, and overall workplace culture initiatives.
- Stronger Employer Brand: cultivate a positive employer brand that attracts and retains top talent.
5.1. Employee Training Completion Rate
Tracks the percentage of employees who have completed required quality training programs. A high completion rate ensures employees know to perform tasks effectively. Explore other HR KPIs in our guide.
Employee Training Completion Rate = (Number of Employees Who Completed Training / Total Number of Employees Who Underwent Training) x 100
- Number of Employees Who Completed Training: This represents the total number of employees who successfully finished a specific training program.
- Total Number of Employees Who Underwent Training: This represents the total number of employees who were enrolled in or assigned a specific training program.
Example: Let’s say a company enrolls 100 employees in a new customer service training program. Out of those, 85 employees complete the entire training program.
Employee Training Completion Rate Calculation:
- Employee Training Completion Rate = (Number of Employees Who Completed Training / Total Number of Employees Who Underwent Training) x 100
- Employee Training Completion Rate = (85 employees completed / 100 employees enrolled) x 100
- Employee Training Completion Rate = 85%
Aim for a high Employee Training Completion Rate. Below 70% suggests issues with engagement or the program itself. 70-85% is average, but there’s room for improvement. Above 85% is excellent.
5.2. Employee Error Rate
Measures the frequency of errors made by employees. A low error rate suggests effective training and quality processes.
Employee Error Rate = (Number of Errors / Total Number of Work Units) x 100
- Number of Errors: the total number of mistakes, defects, or rework identified in employee work within a specific timeframe (e.g., day, week, month).
- Total Number of Work Units: the total number of tasks, products, or services completed by employees within the same timeframe.
Example: Let’s say a data entry team processes 1,000 customer orders in a week. During quality control checks, 25 errors are identified, such as incorrect addresses or missing information.
Employee Error Rate Calculation:
- Employee Error Rate = (Number of Errors / Total Number of Work Units) x 100
- Employee Error Rate = (25 errors / 1,000 orders) x 100
- Employee Error Rate = 2.5%
Minimize employee errors as much as possible. A high rate (above 5%) suggests needing to address training, processes, or even well-being. A moderate rate (2-5%) warrants attention but may not be critical. A low rate (below 2%) is great, but keep monitoring and improving to limit mistakes.
5.3. Employee Satisfaction
Tracks employee happiness and morale, often measured through surveys. Satisfied employees are more likely to be engaged and produce high-quality work.
Employee Satisfaction Rate = (Number of Satisfied Employees / Total Number of Employees) x 100
- Number of Satisfied Employees: This represents the total number of employees who respond positively to a satisfaction survey or indicate satisfaction through another measurement tool.
- Total Number of Employees: This represents the total number of employees working for the company at the time the satisfaction data is collected.
Example: Let’s say a company with 200 employees conducts an employee satisfaction survey. Out of those, 170 employees report feeling satisfied with their work environment, compensation, and career development opportunities.
Employee Satisfaction Rate Calculation:
- Employee Satisfaction Rate = (Number of Satisfied Employees / Total Number of Employees) x 100
- Employee Satisfaction Rate = (170 satisfied employees / 200 total employees) x 100
- Employee Satisfaction Rate = 85%
Below 70% suggests a need to address serious moral issues. 70-85% is average, but there’s room for improvement. Above 85% is excellent, but keep working to create a positive work environment.
Remember, the “best” quality KPIs for your business will depend on your specific industry, goals, and priorities.
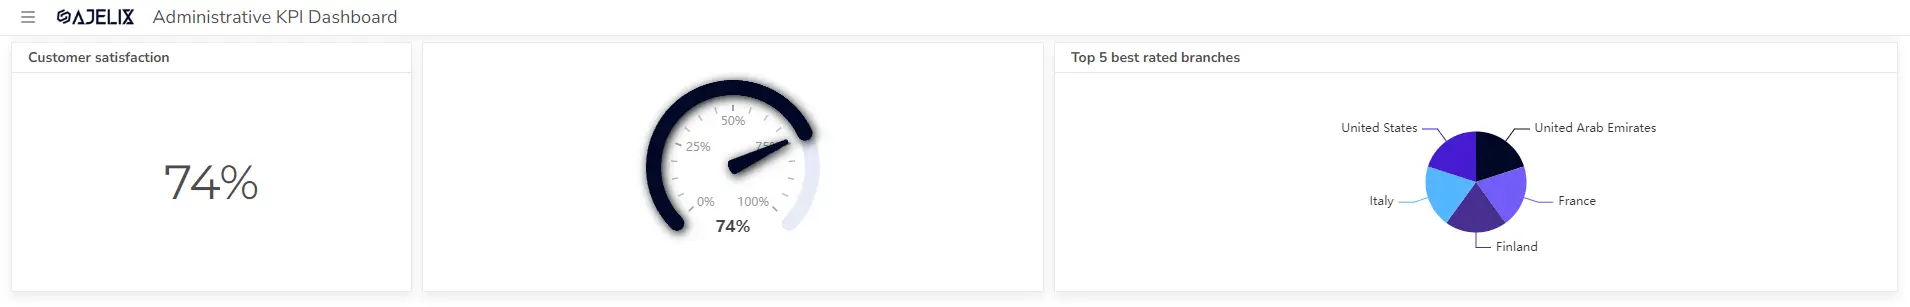
How To Create a Quality KPI Dashboard?
Time needed: 5 hours
This guide explores building a KPI dashboard with Ajelix BI’s freemium plan. While specific steps might differ by tool, the general process remains consistent.
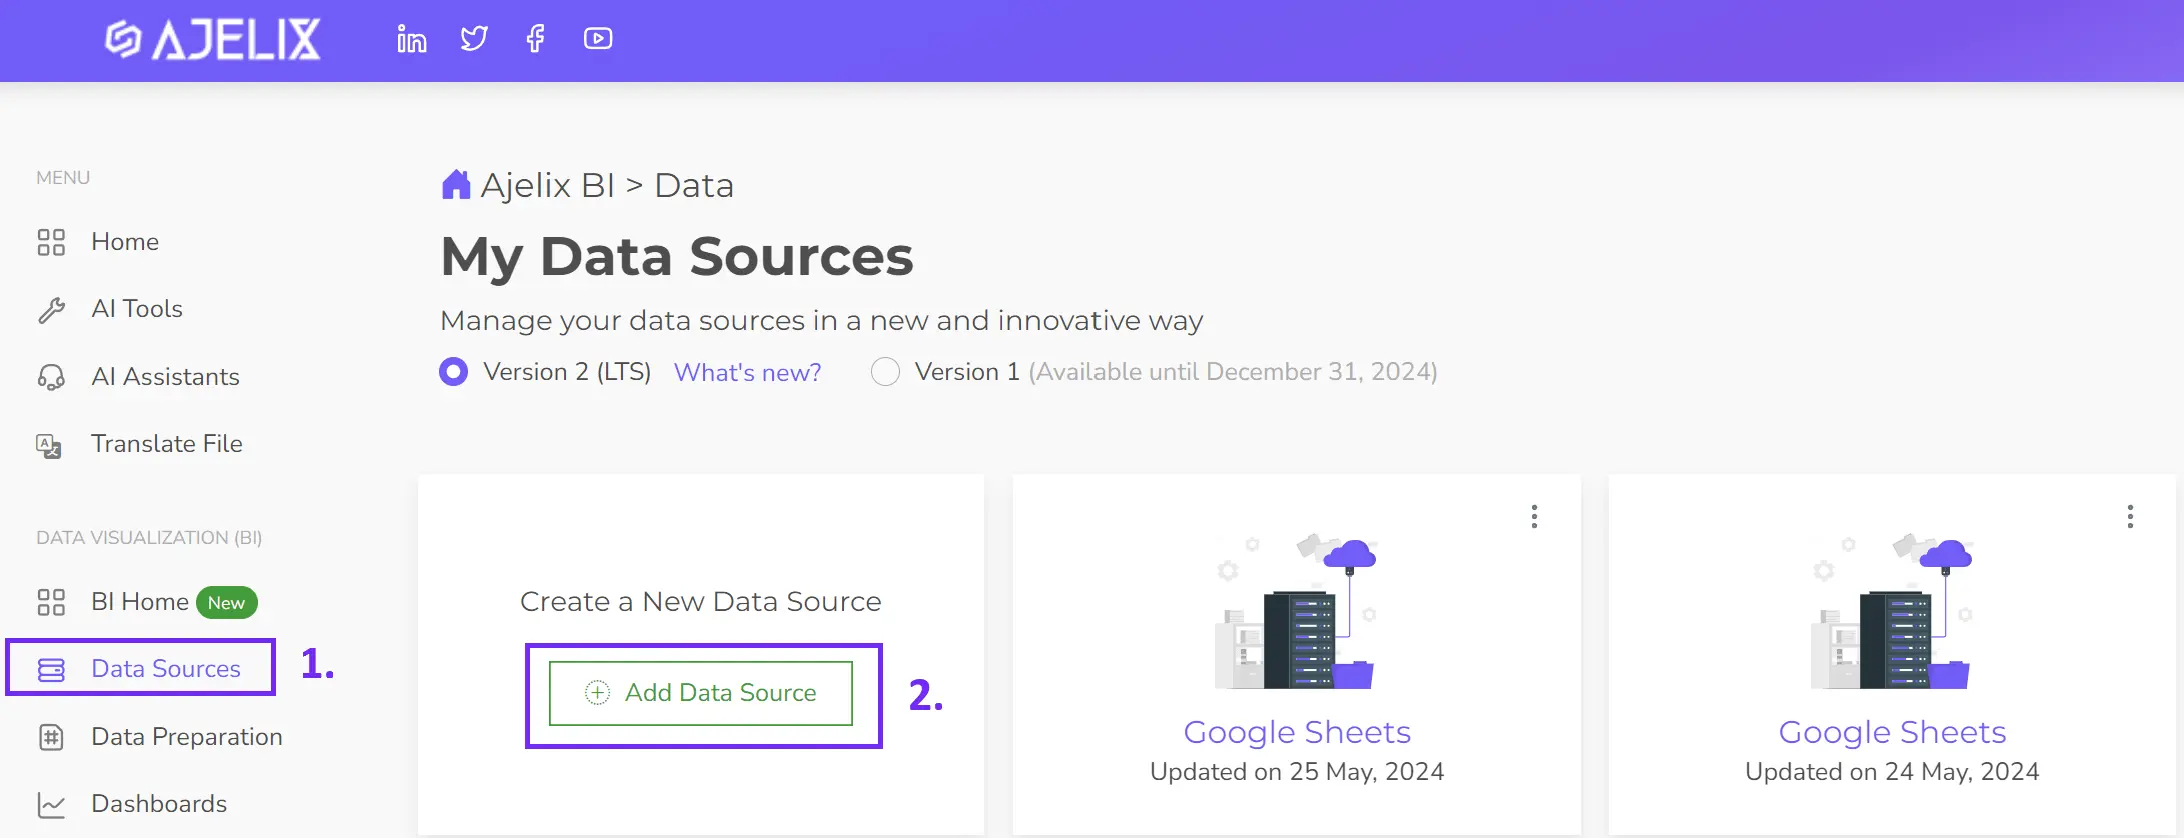
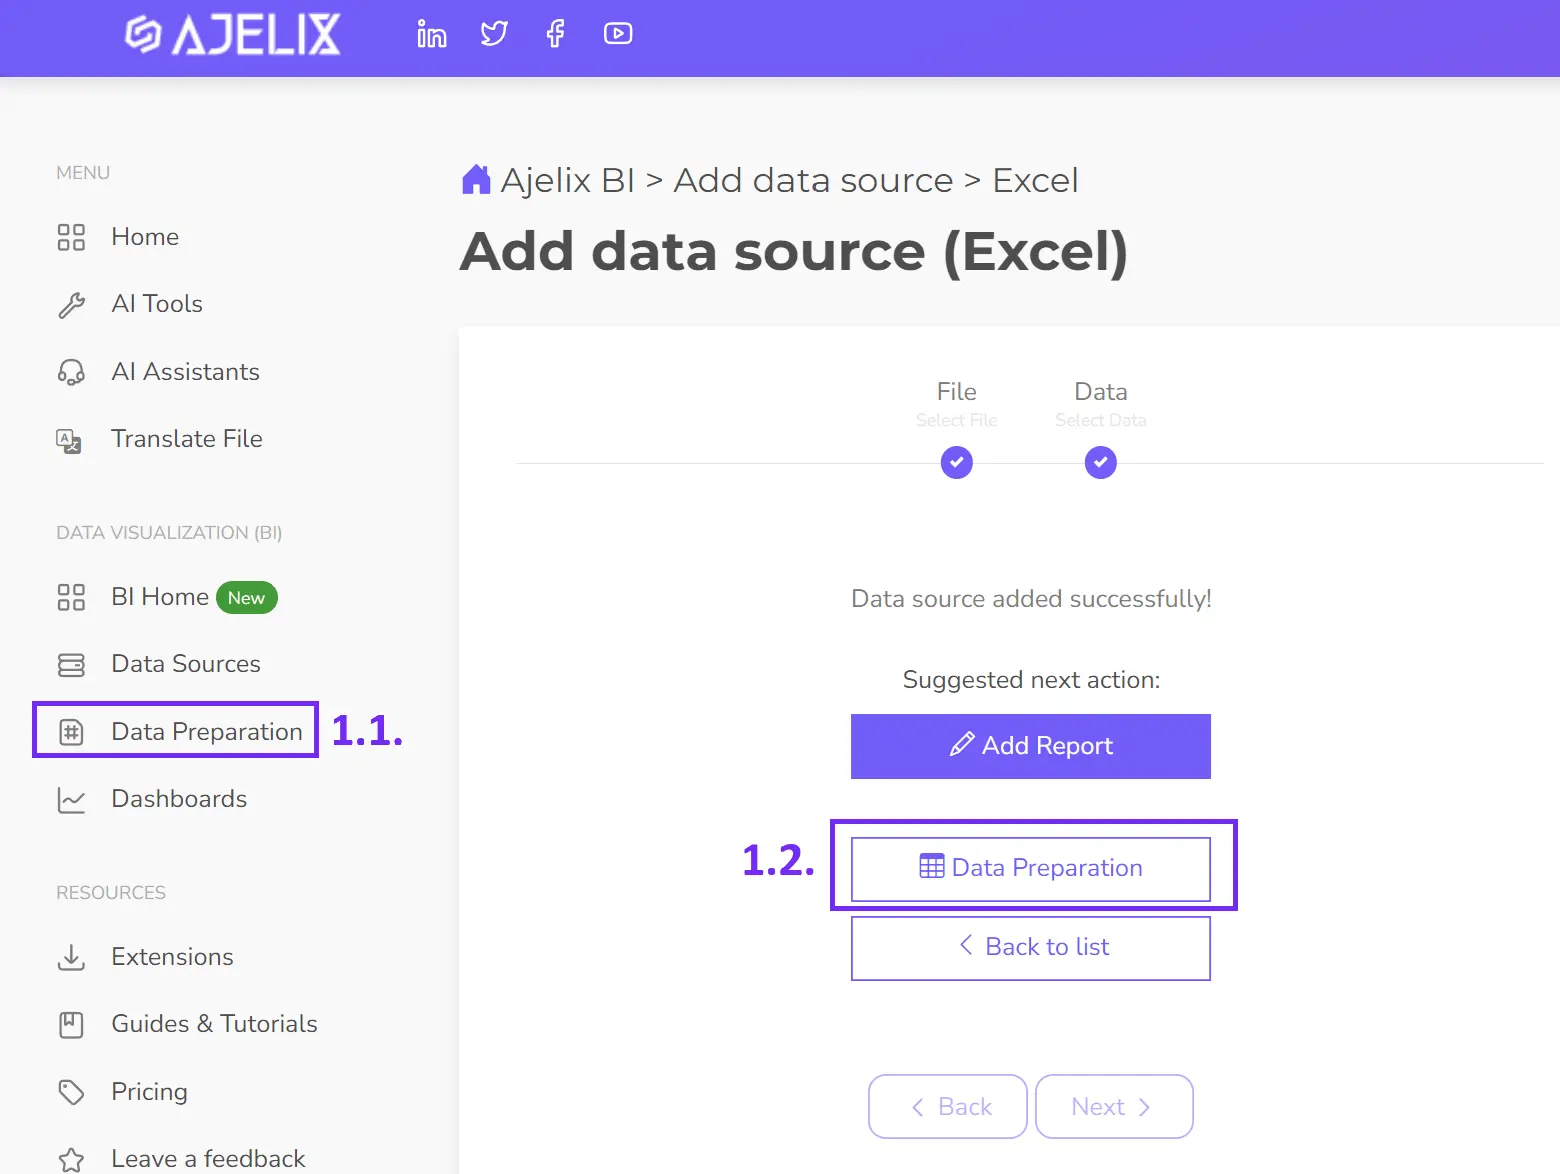
- Connect your data source
Follow the instructions in your BI tool to connect to your data source. Here you can simply upload your Excel, CSV file or connect with Google Sheets or SQL database.
- Clean and transform your data (optional)
Ajelix BI allows you to clean or transform your data (e.g., converting formats, filtering). This ensures accuracy and consistency. It’s not a mandatory step but recommended for deeper analytics.
- Create calculated fields (optional)
This article covered over 15 key quality KPIs you can calculate and measure with Ajelix BI. If you don’t have this data calculated in your data source you can create custom calculations using Ajelix BI’s data modeling capabilities.
In the picture below you can see the steps you should take to calculate these metrics:
1. Select the data source
2. Add measure
3. Select the measure filed
4. Type the KPI formula in formula bar
5. Click “Apply”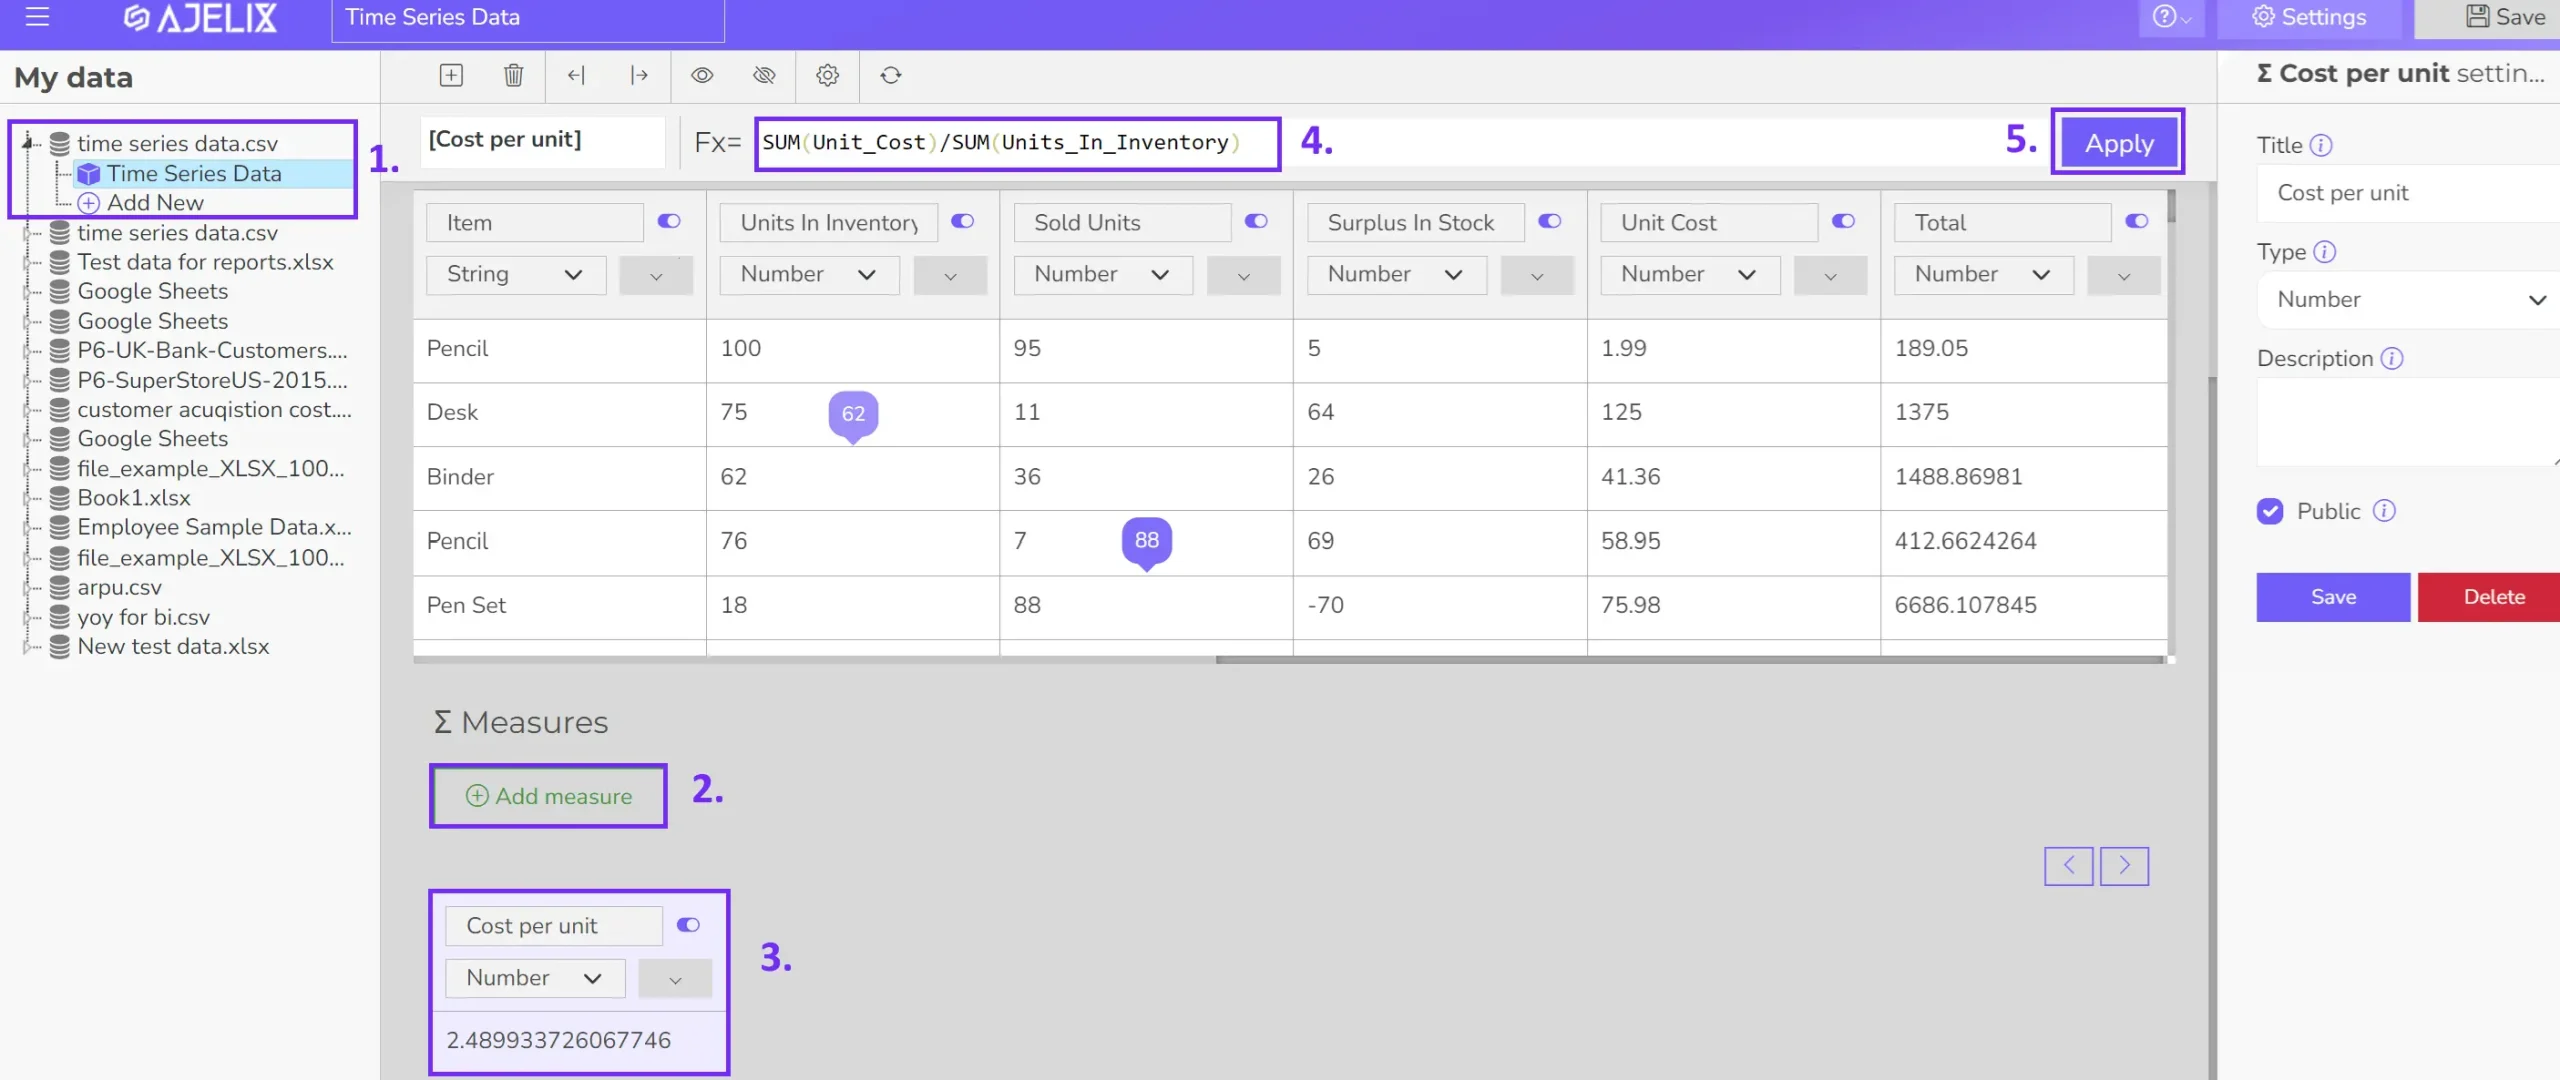
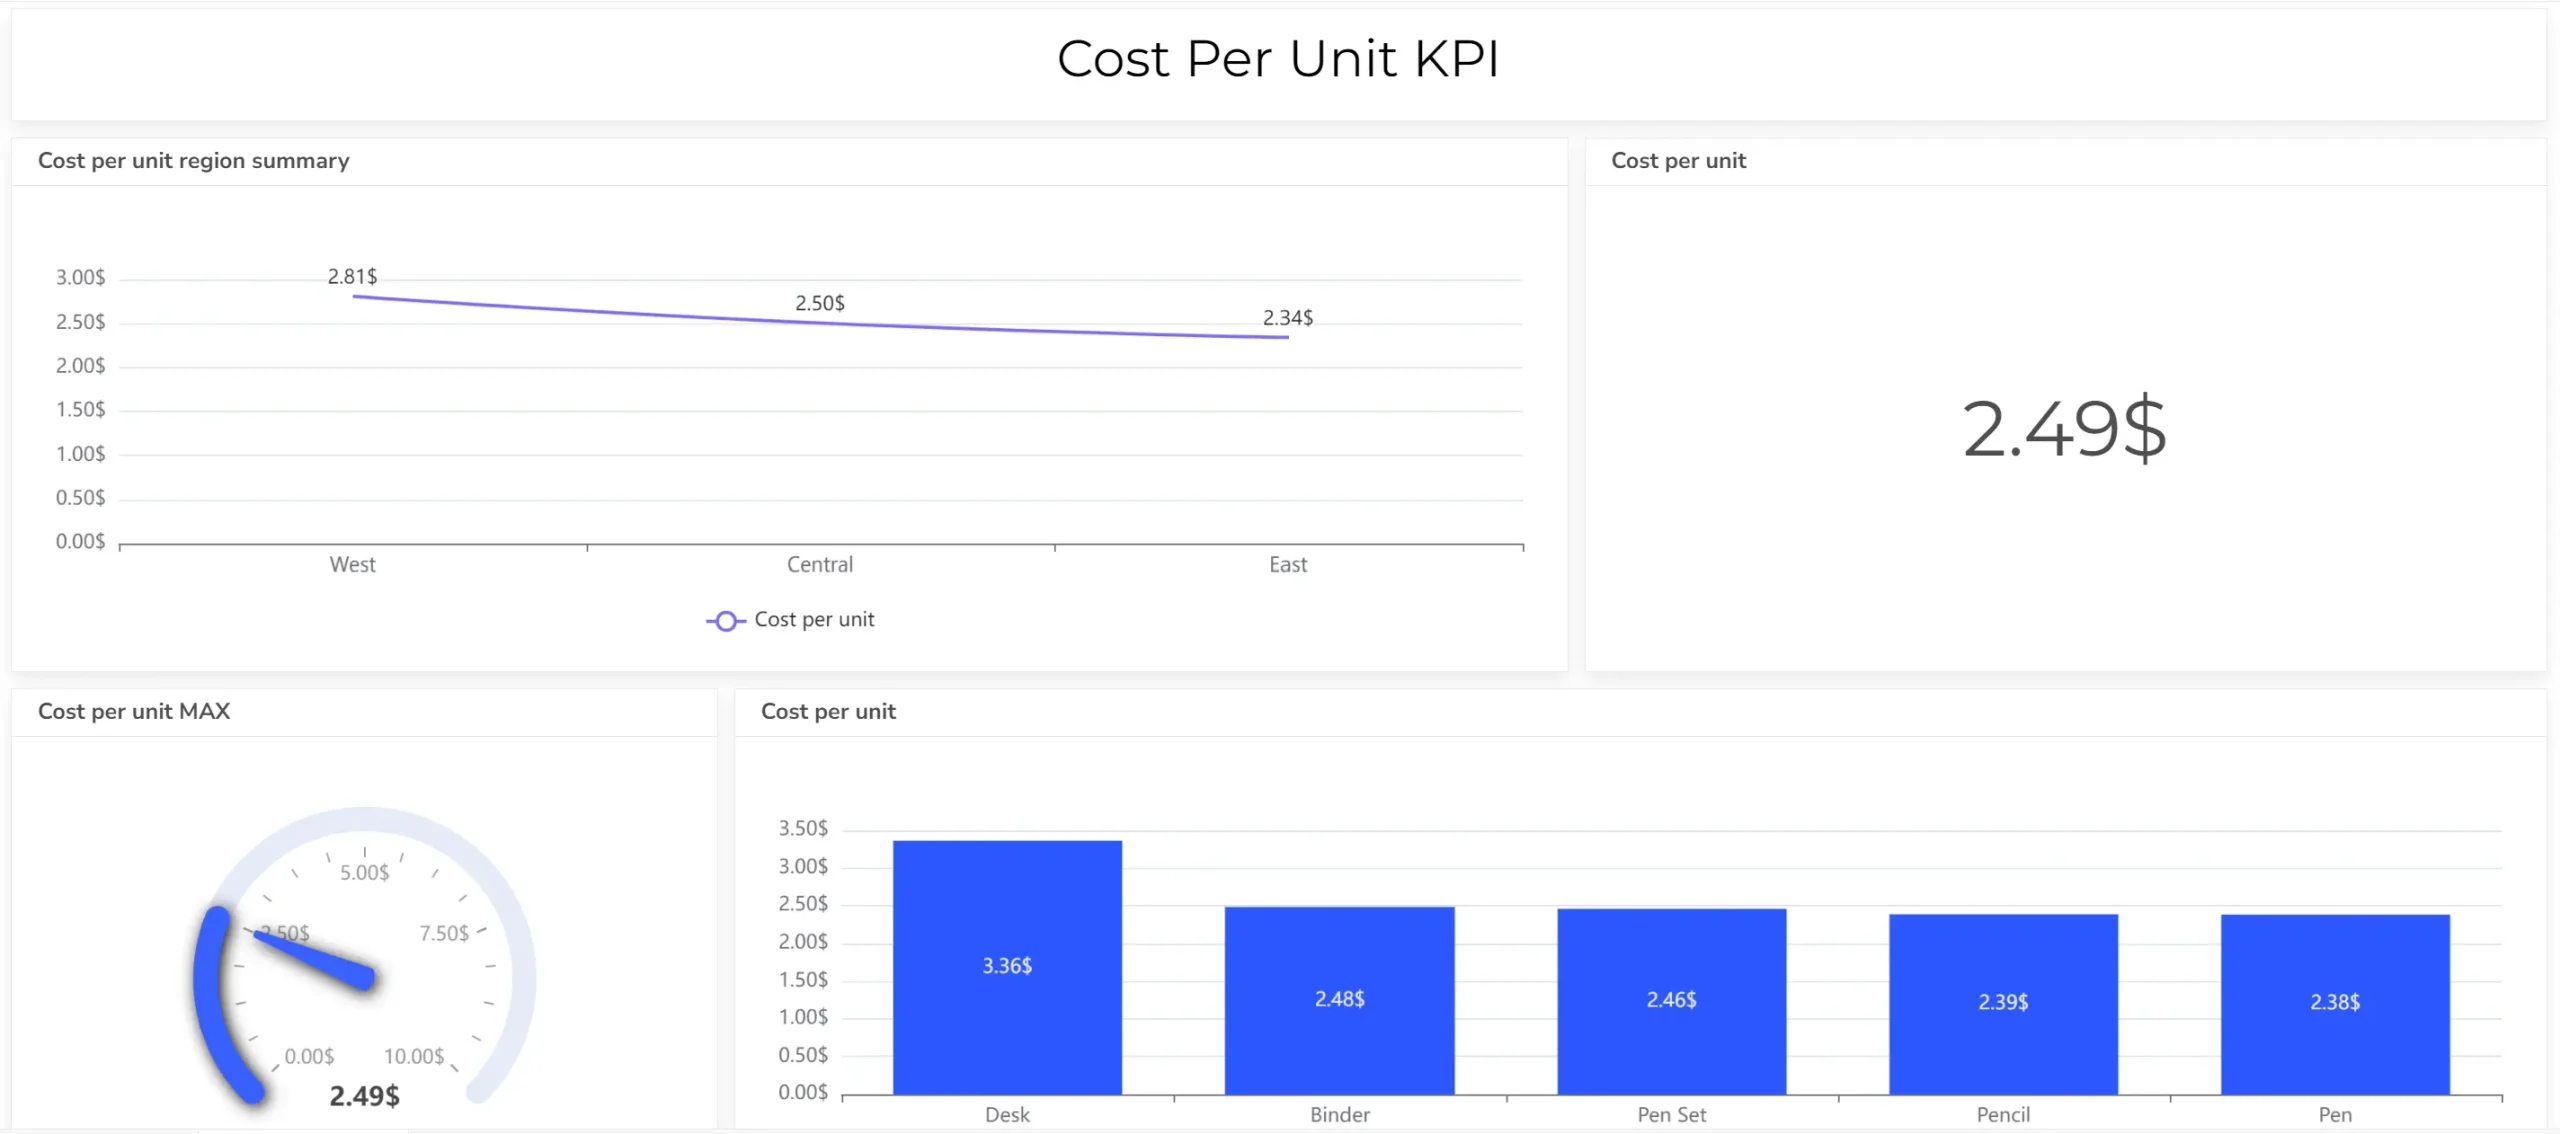
- Build your visualizations
Select the most suitable visual format (card, gauge chart, line graph) for each KPI. Ajelix BI allows you to easily drag and drop data fields or leverage its AI-powered dashboard generator to automatically create data visualizations for your KPIs. This streamlines the process and ensures your KPIs are presented effectively.
- Customize your dashboard
Add titles, and descriptions, and format the layout for clarity and visual appeal.
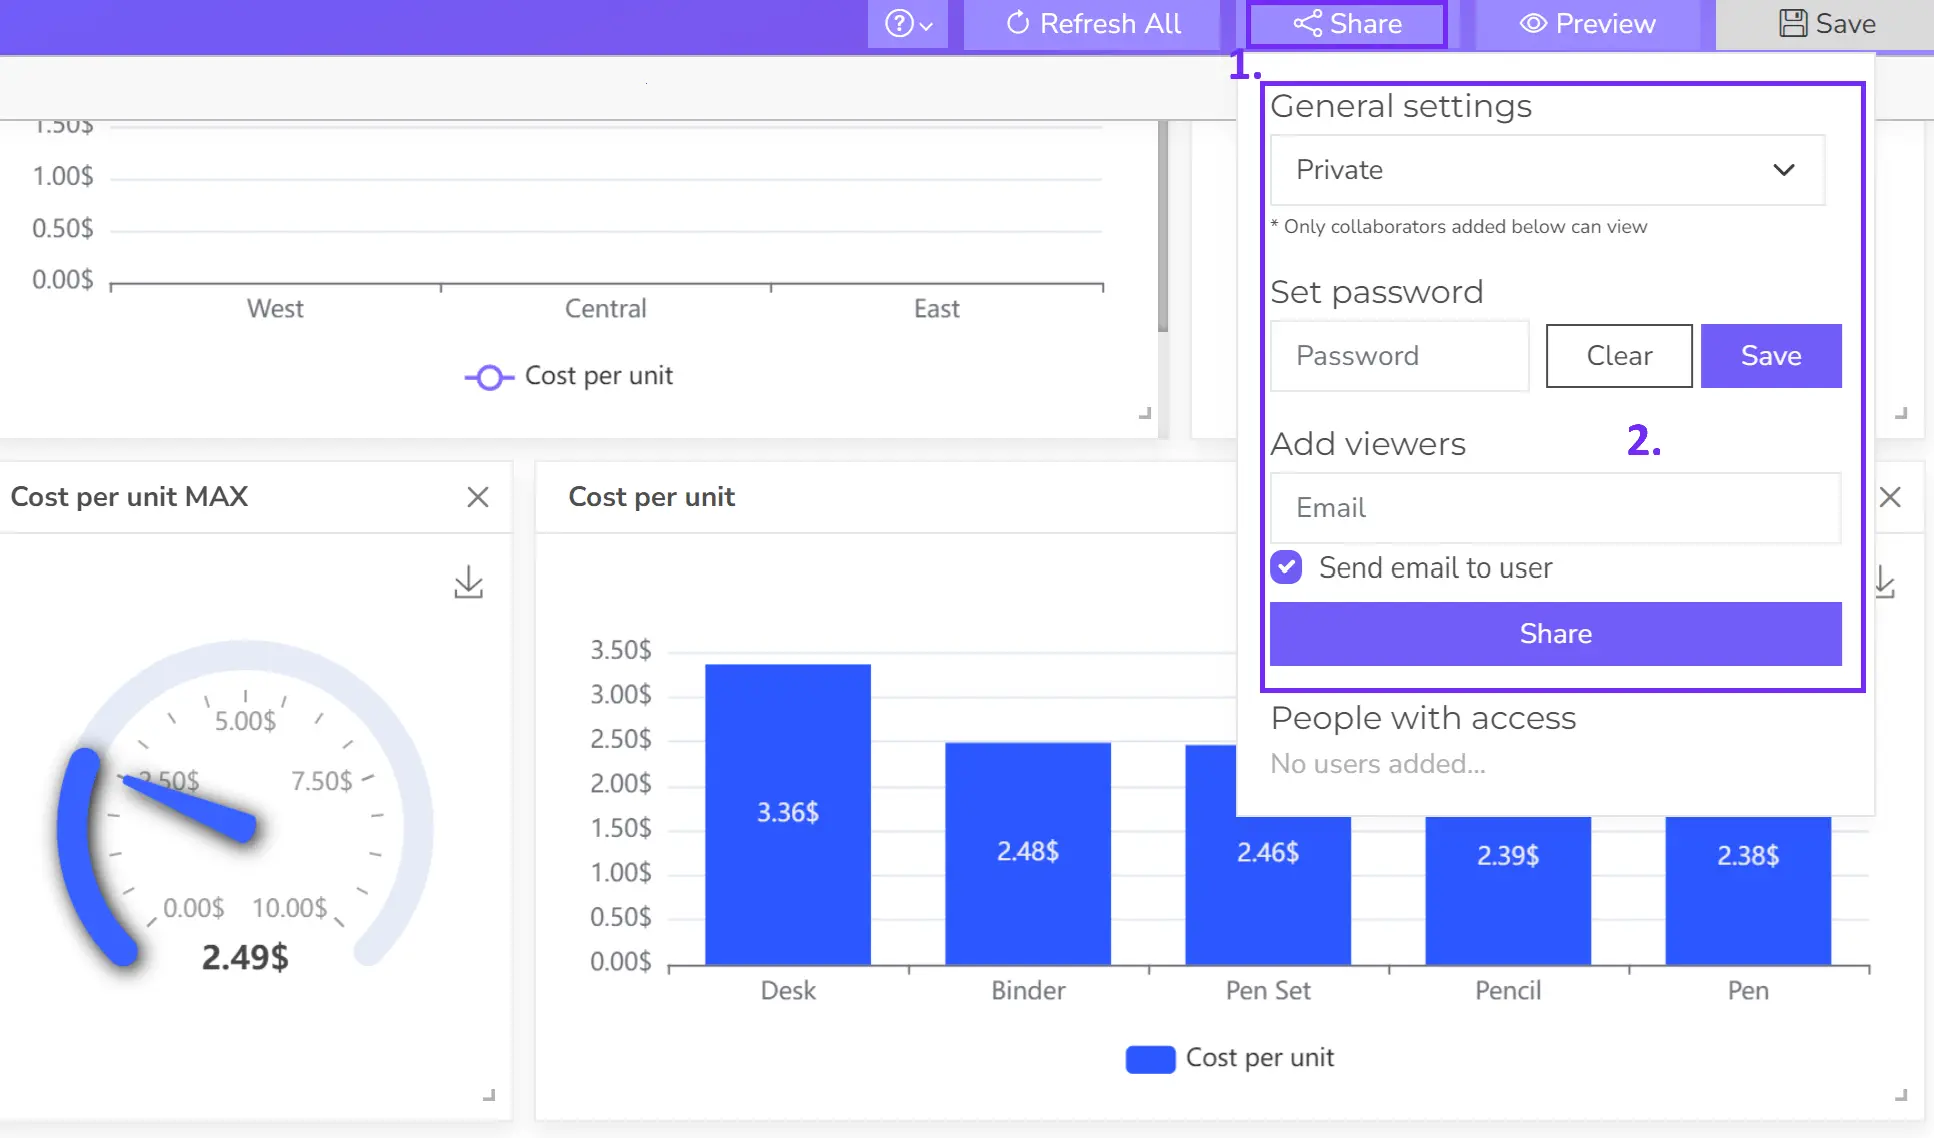
- Share your dashboard
Once you have the report, publish your dashboard and share it with relevant users for real-time insights.
Reporting gives you a headache?
Upload your data and create professional reports with agentic AI

Start free
Try free and upgrade whenever
FAQ
For highly critical processes or situations with rapidly changing quality issues, daily or weekly monitoring might be necessary. Most core QA metrics benefit from monthly tracking, which allows you to analyze trends and identify areas for improvement over time. Quarterly or biannual reporting is suitable for broader assessments of your QA strategy and for presenting findings to stakeholders.
QA KPI calculations can be done with various tools depending on your needs. Spreadsheets are an option for basic calculations, but more complex scenarios might benefit from QA management software, business intelligence tools, or even custom programming for maximum flexibility.
Accurate QA KPI data is crucial. To achieve this, ensure reliable data sources for each metric, standardize collection methods across teams, implement data validation checks, regularly review data for inconsistencies, and investigate any outliers.
From data to report in one minute or less with Ajelix BI