It’s time to create reports. Please keep in mind that to create reports you first need to upload datasets which we covered in the previous guide. Now let’s take a look on how to successful create your first report with Ajelix.
There are 2 ways how to start report creation:
1. Create a report from datasets page where you just uploaded dataset. You will see button Create Report.
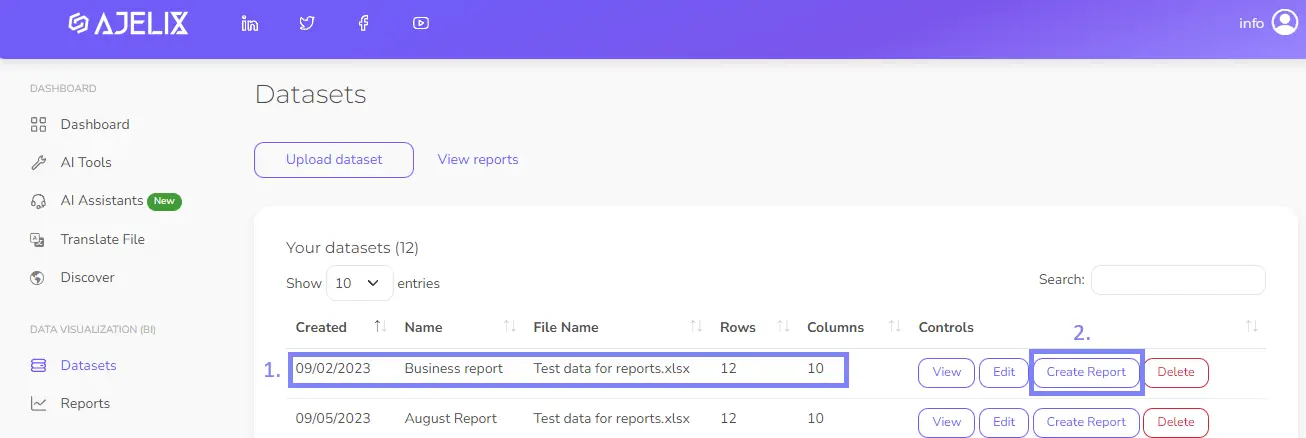
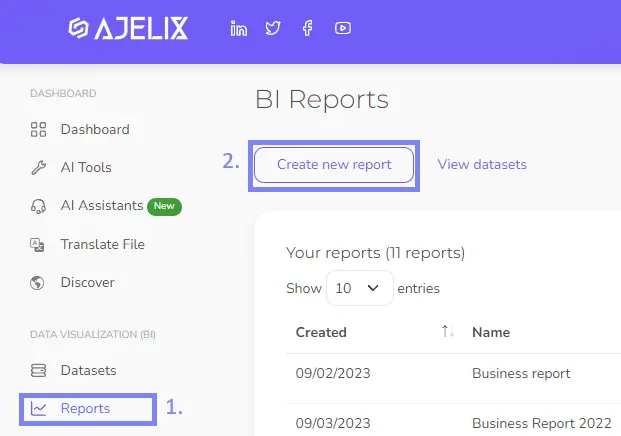
2. The other way to create a report is to go to Report section on the left pane. Once you’re there simply click Create new report.
No matter which option you choose you’ll end up on the same page.
Set up new report
Now you should be on the page Add new report where you’ll see 3 step process that you must complete to create a report. These steps are vital because you’ll:
- Give name to your report
- Connect dataset from which you’ll build the report
- Choose layout from our templates
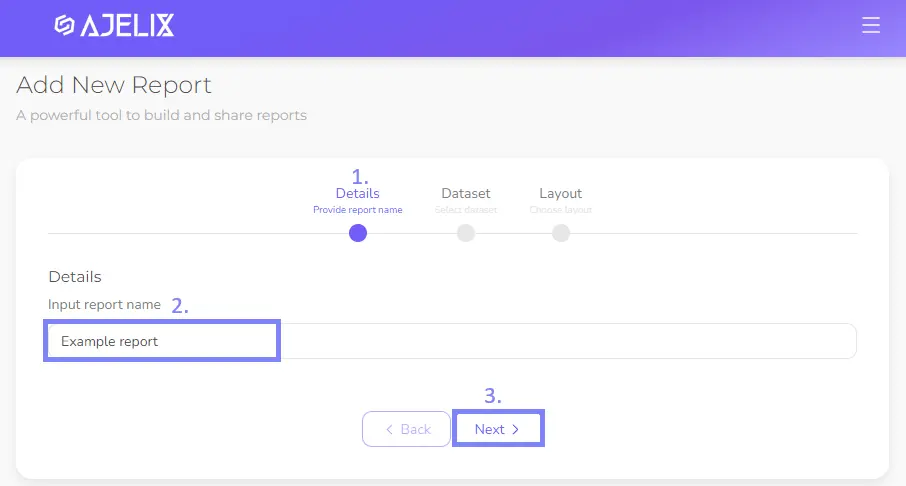
Step 1: Give name to your report
This step is pretty straight-forward simply give name to your report.
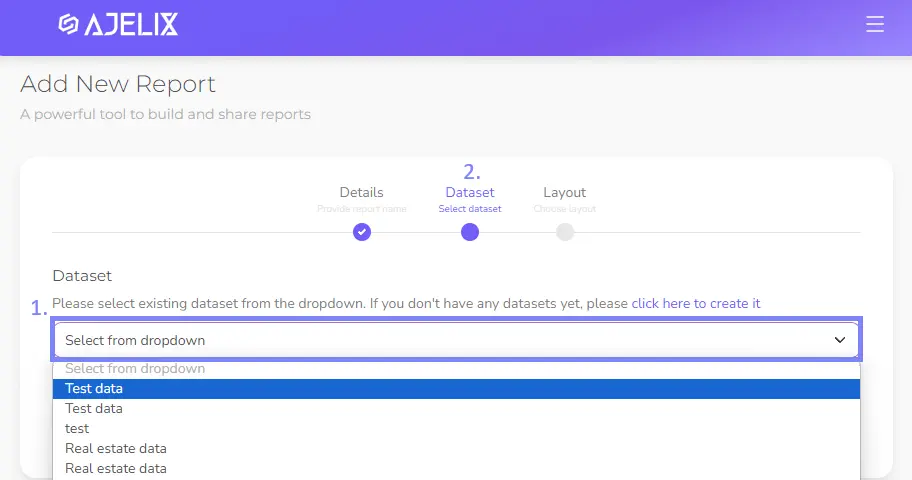
Step 2: Choose dataset to visualize
Next step is vital as it connects the report to your Excel or CSV file that you uploaded during the previous guide. Choose the file that you want to visualize. No worries you can later update the existing file by uploading new file with more information and report will be updated with fresh data.
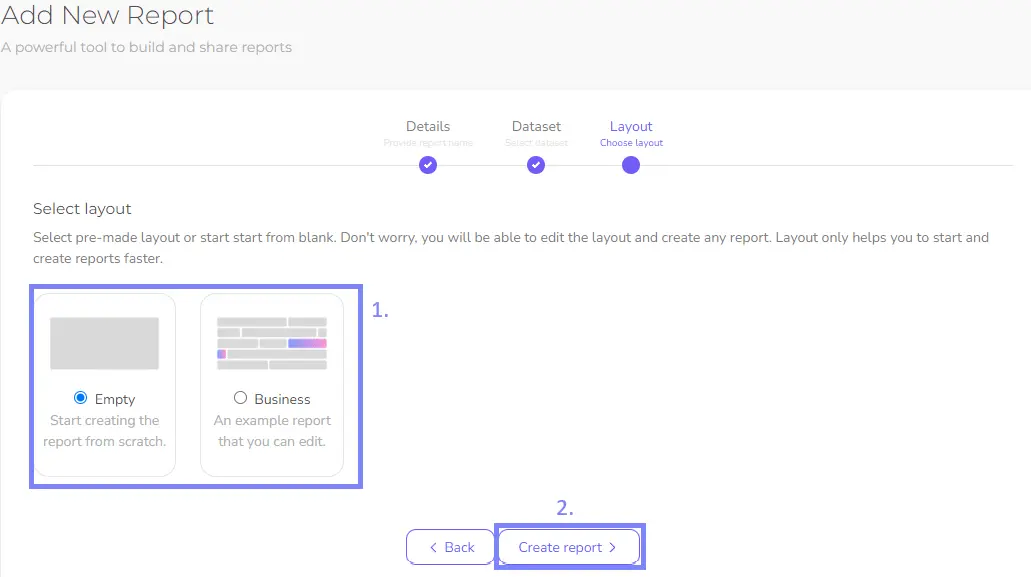
Step 3: Pick the template for your report
In this step you can pick the template or simply start from scratch. As of now we have only one template but we’ll add more layout for your convenience. Simply pick the template and click Create report.
What is a template? It’s a predefined layout with charts and matching colors so you can simply update the data in these charts and report will be ready for sharing.
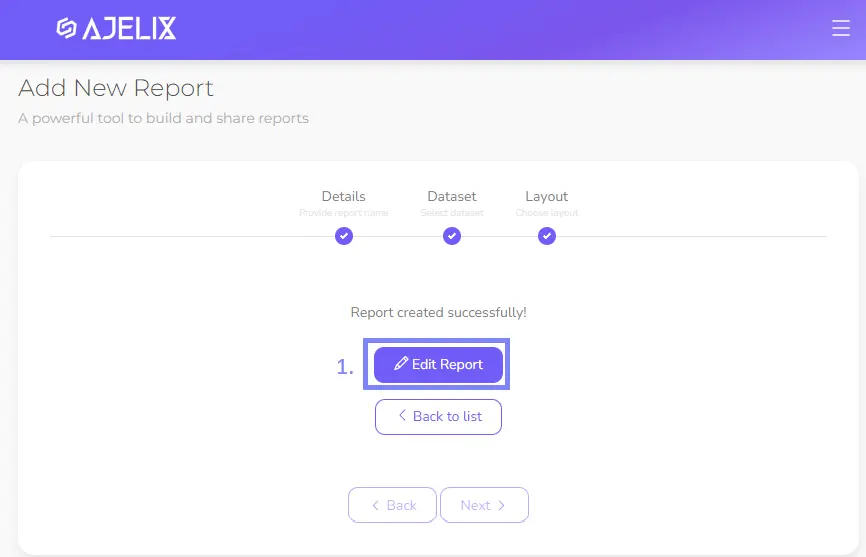
You should have last dialog box with button Edit Report. Click on it and editing can start! To learn more about editing settings and possibilities access next guide customize your first report.
Read next blog about custom number formatting
Didn’t find the answer to your question? Contact us via: support@ajelix.com