This guide will summarize all the steps you need to take to create a successful report on Ajelix BI. From formatting your file to sharing your report, this guide is a summary from the previous guides. During this guide we will cover:
- How to format your files before date upload?
- How to upload data for report creation?
- How to create a report on Ajelix BI?
- Build your first report with Ajelix
- How to share a report with others?
The steps are in sequential order meaning you have to take the previous steps to get to the next step. For example, to create a report you need to upload data, etc.
Here’s step-by-step video guide outlining everything that we’ve covered in this article:

1. How to format your files before date upload?
In order to create reports with Ajelix BI first you need to upload data files. Currently, it’s possible to upload Excel and CSV file formats into our system.
Format your Excel file
Here are a few things to keep in mind when using Excel as a data source.
- The data visualization tool will take data only from the first sheet. Be aware that if you upload a file with several sheets system will process data from Sheet1 and the rest will be ignored.
- All data should start from cell A1. If your data table starts from cell C2 or other cells make sure to move it A1.
- Your Excel file can have an unlimited count of rows and columns.
- Make sure your file consists of only one data table in a sheet. Avoid column or row blanks.
- Format cells as “Date” to create a time series chart that summarizes big date data.
- Remove unnecessary formatting (except for the date format).
- Remove currency formatting if you want to visualize data as numbers. The system won’t be able to recognize currency as a number.
- Remove any other custom format that you have set for the data. As it could cause an error and you won’t be able to upload your file.
- Format your headers correctly:
- start with a letter (never start your headings with numbers, e.g. “21Data”),
- make sure your headers are formatted as plain text, avoid date formats or any other custom formatting,
- consisting of letters, numbers, and underscore (
_) symbols only. Don’t include symbols such as %,$,&,|, etc.
Format your Google Sheets file
Google sheets files are subject to the same formatting conditions as Excel.
Format your CSV file
CSV file import is pretty easy and it doesn’t have as many restrictions as Excel.
- Similar to Excel your data should start at cell A1 and you should avoid adding blank columns or rows unless you want to see that in charts.
- Format dates with “Date” formatting to do that follow the instructions above.
You can view the full article on how to format your files here.
2. How to upload data & create a report?
The next step is to upload data on Ajelix platform. To do that, follow the steps:
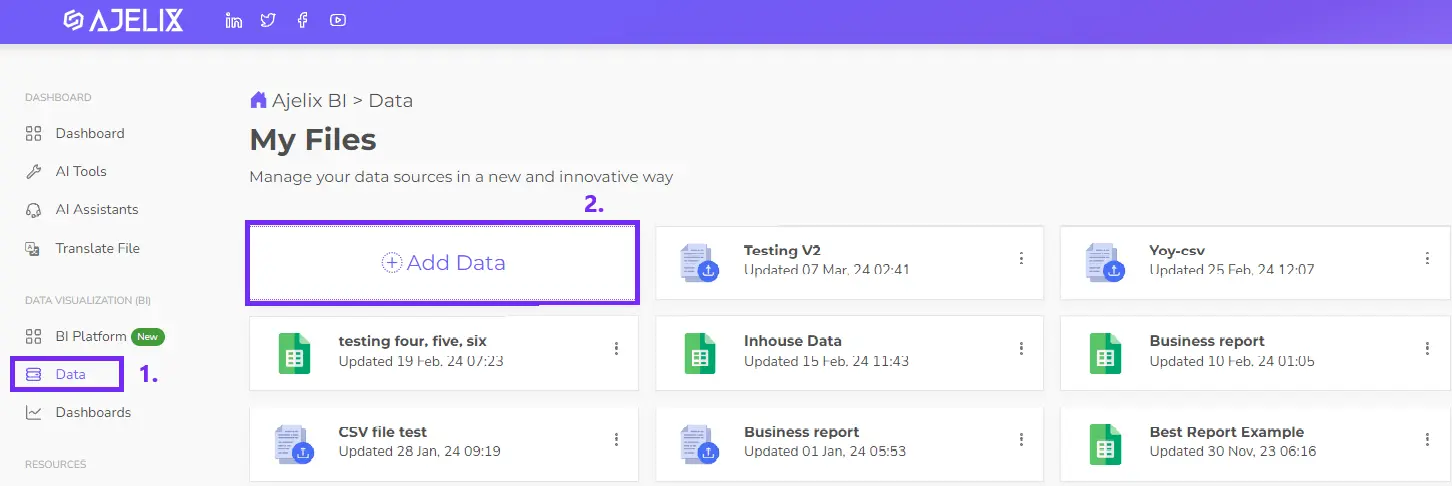
1. Go to Ajelix Data
2. Click on Upload Dataset
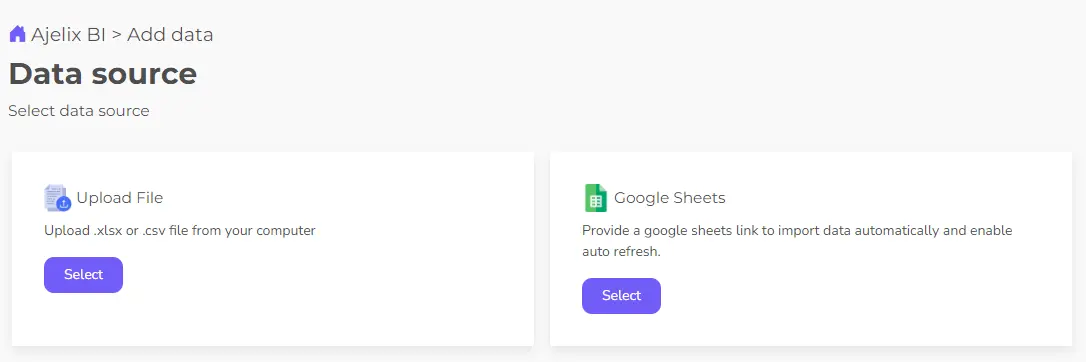
3. Choose the correct data file type from the available list
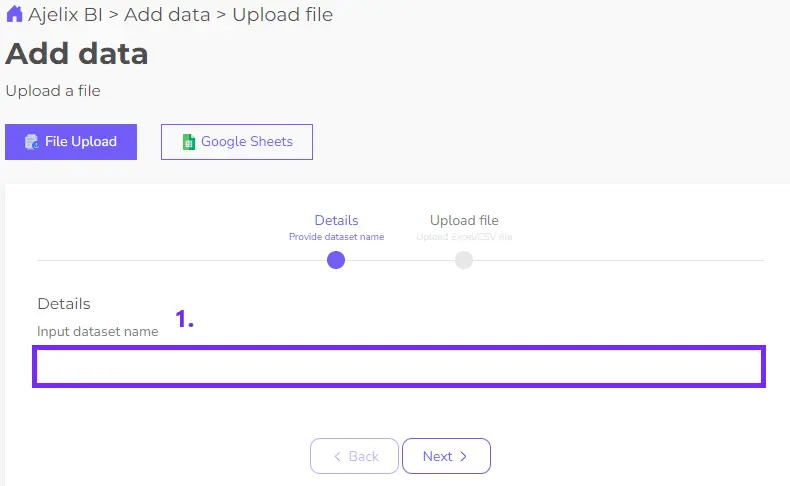
4. Now you should have settings page where you can name dataset. Once it’s done, press next.
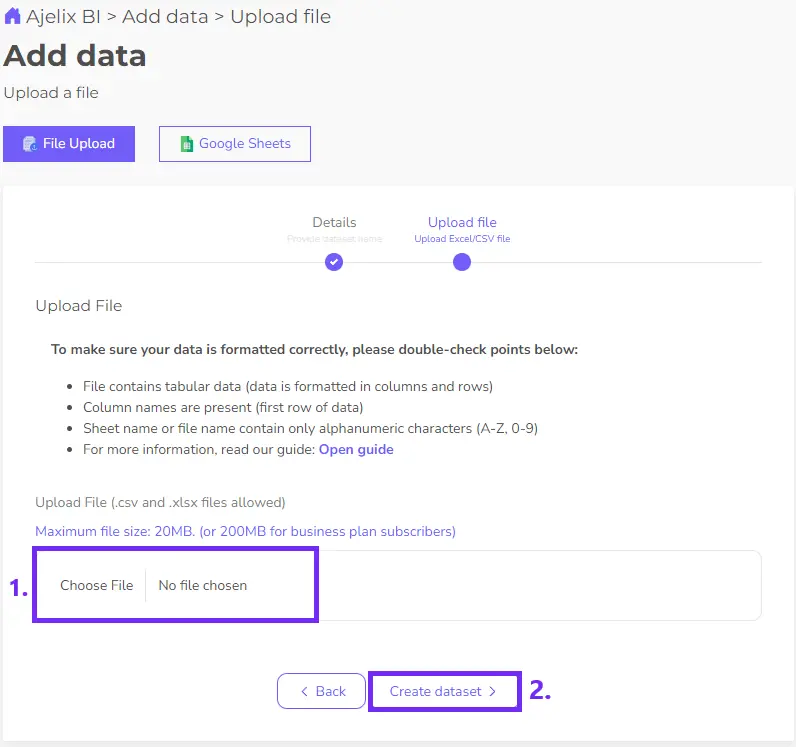
5. Upload Excel or CSV file. Once you have done both of these things, press Create dataset.
6. Once you press Create dataset you should get to the next setup that let’s you add a report
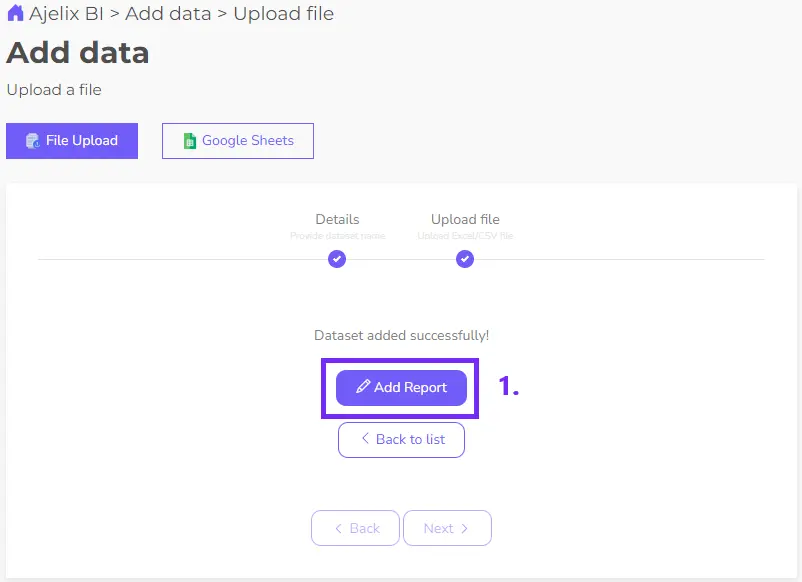
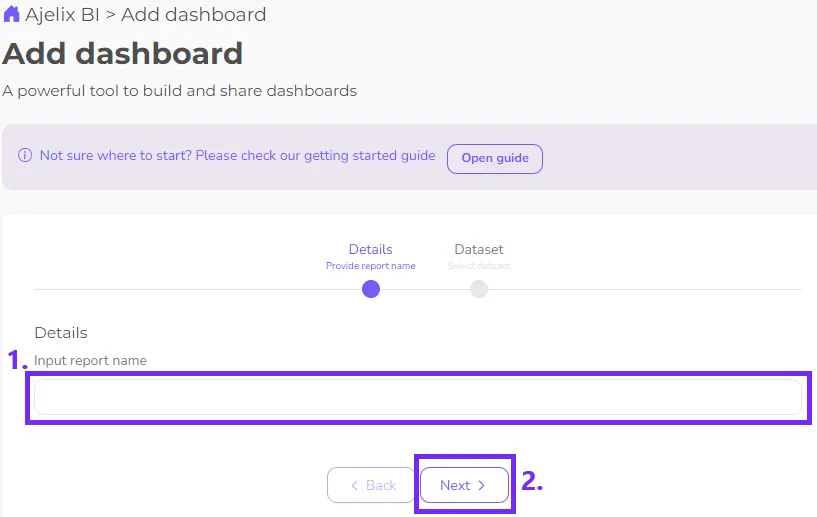
7. In the next step give name to your dashboard or report, for example, Financial Data or Operational Dashboard.
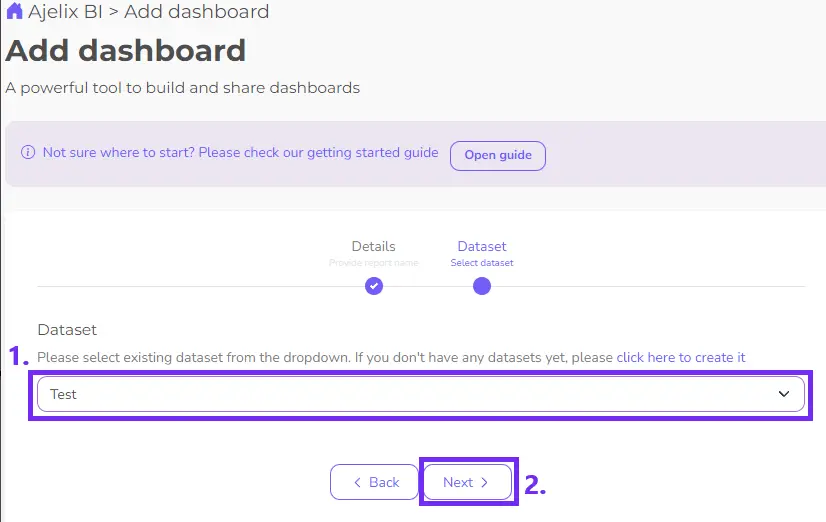
8. Once you name the dashboard you will be able to pick the data file from the dropdown.
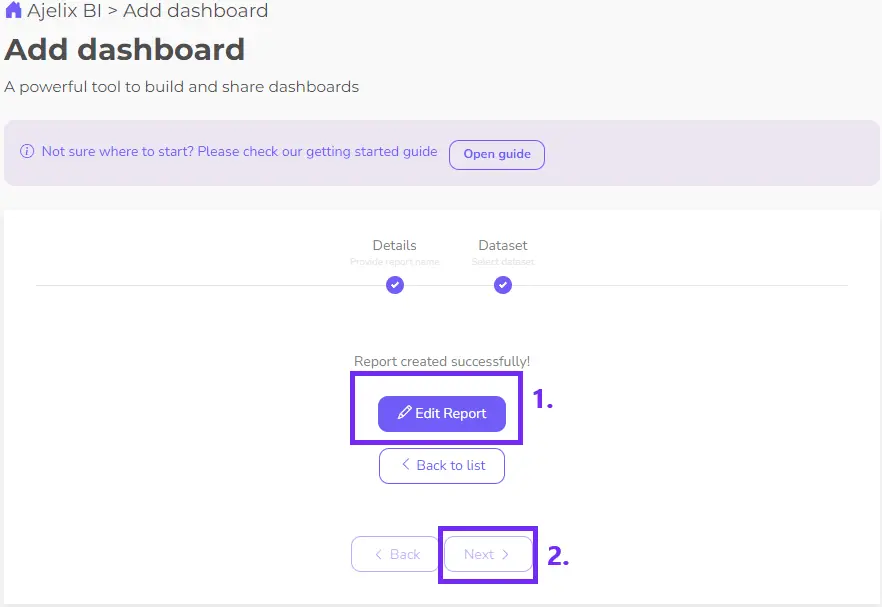
9. Now you’re all set up! You should have a next window that let’s you edit the report.
You can also follow the steps described in guide how to upload datasets on Ajelix.
3. Build your first report with Ajelix
We will walk you through the elements, set up and how to create your first report. Make sure you’ve done the previous steps listed in this article.
Once you have completed the set up that we covered in the previous guides you should have a blank editor, like this 👇
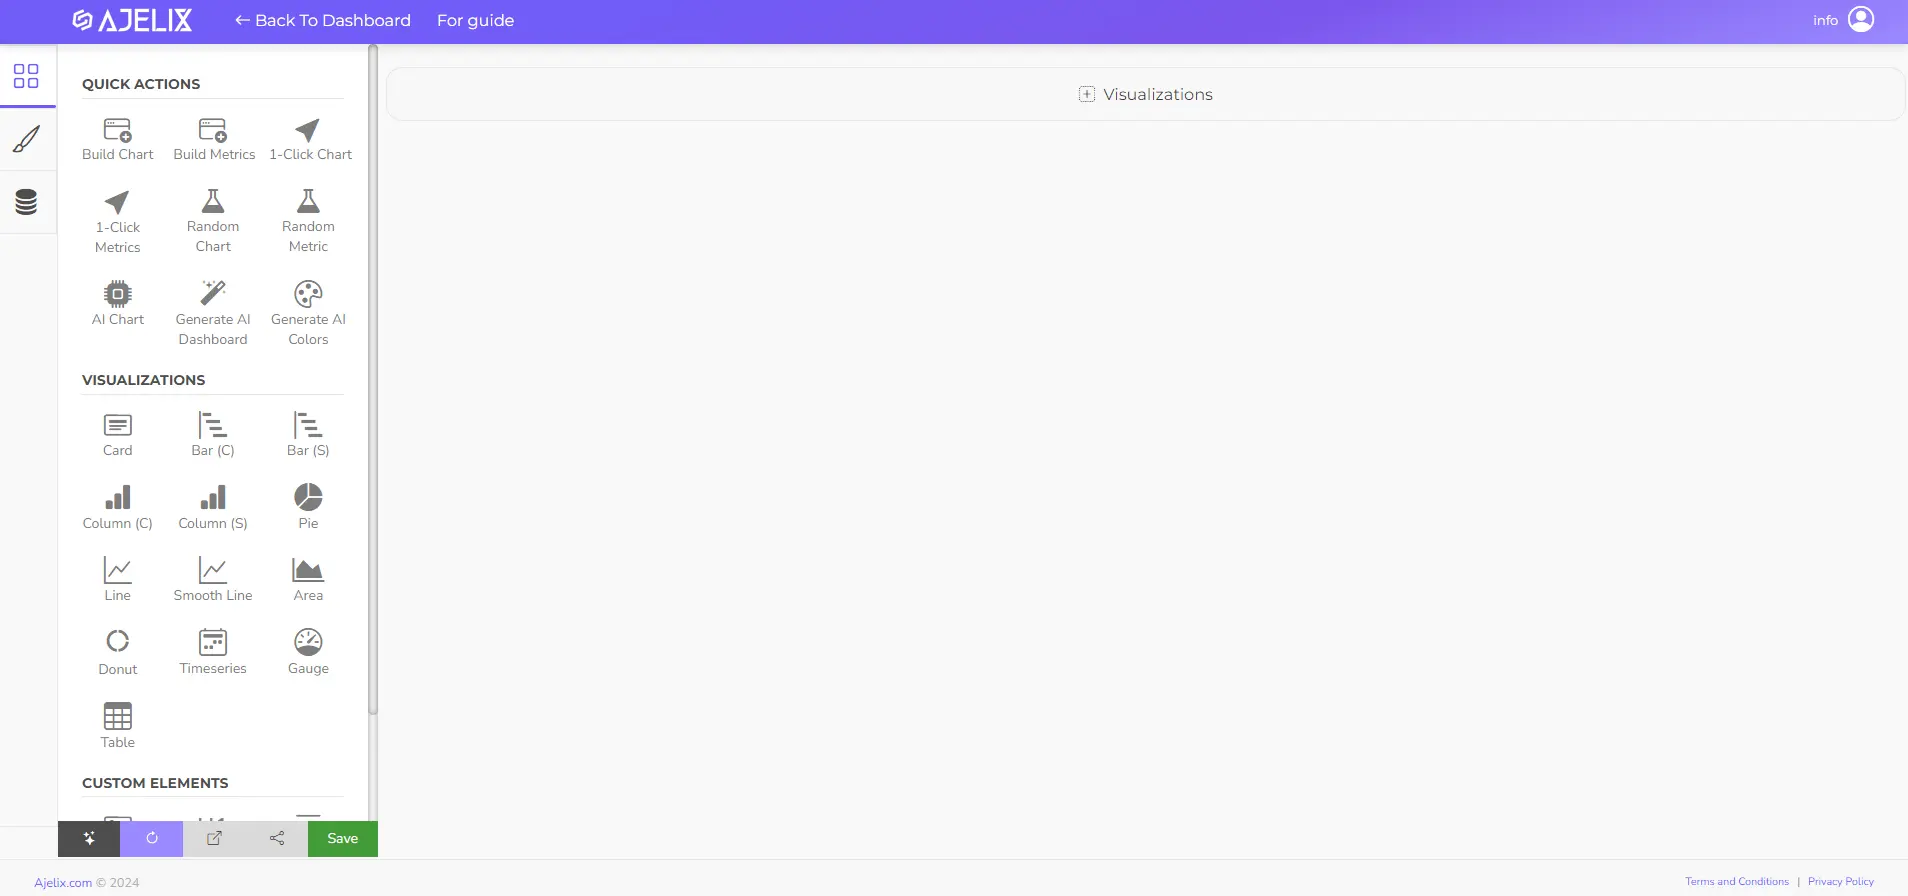
To understand the functions for each element read the article about available ajelix elements.
Step 1: Understanding editing
Simply pick the first element you want to see in your report. Once you click on any element it will appear on your report and you will see editor.
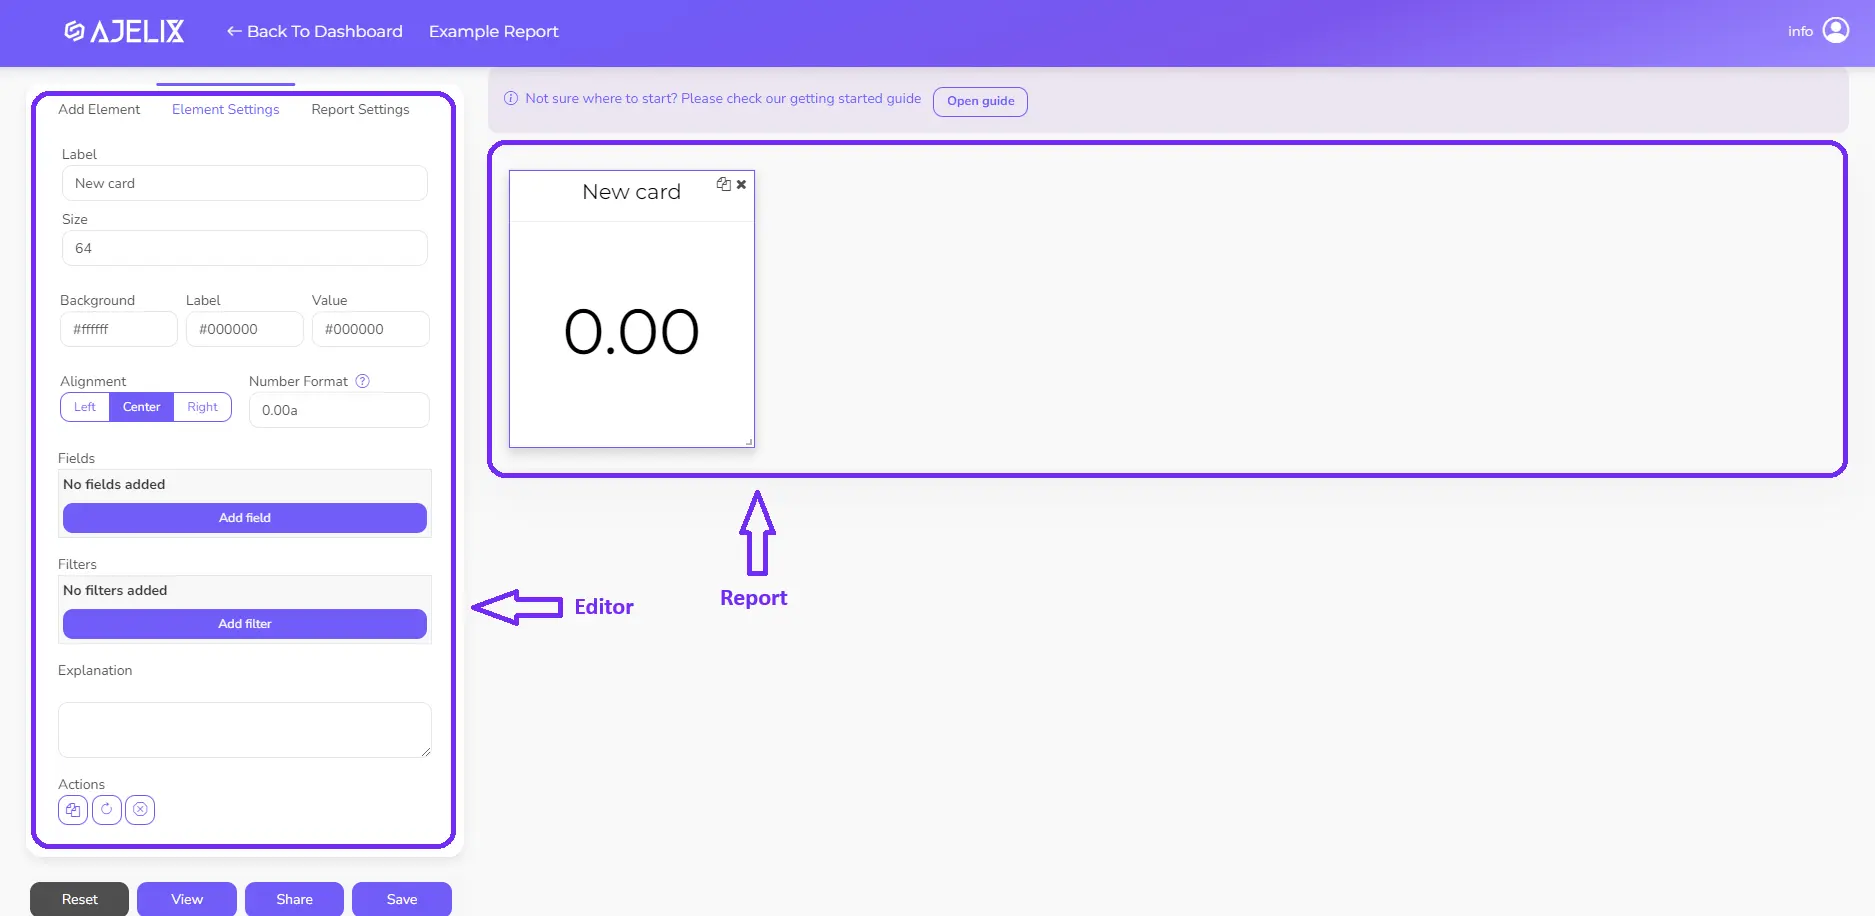
On the left side you can see editor and on the right you see report preview. In report preview you can drag and drop the elements to rearrange them. By clicking on each element in report preview you will open the element settings. Each element has it’s own element settings where you can:
- Rename elements
- Change color, size, alignment
- Choose columns from you dataset
- Do calculations with your data
- Add, remove filters
- Add explanations or comments. This is the part where you can add small descriptions and when sharing the report other people can see your thoughts.
- Arrange data descending or ascending order.
- Explain charts with AI to reveal correlations and different trends in your data.
Step 2: Set up element settings
2.1. Customize the appearance of your element
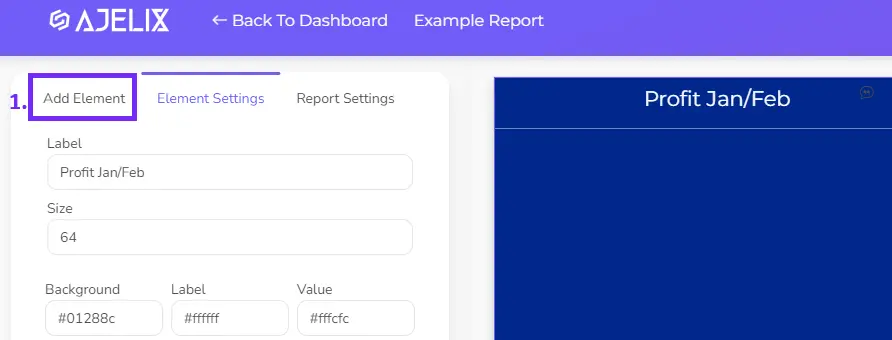
Now let’s set up the first element settings. We picked the card element that we will start editing, look at the picture below to help you track the editing.
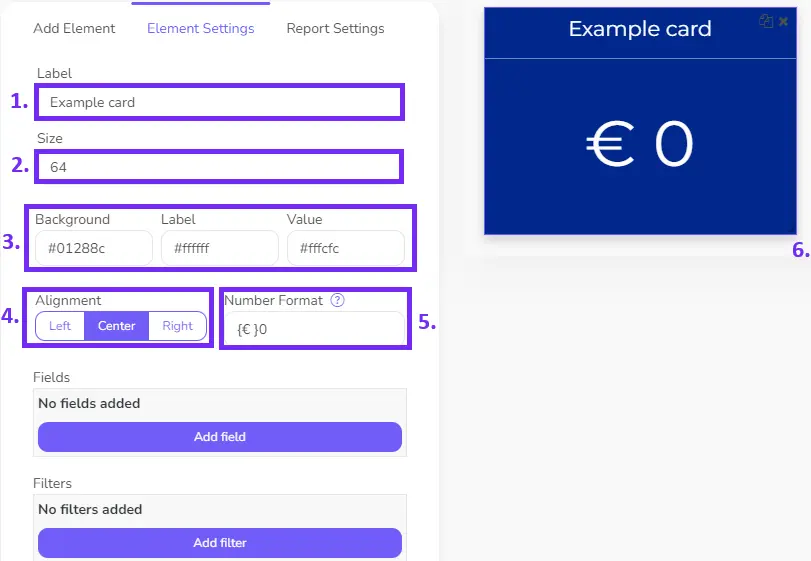
1. The first step let’s you rename your element
2. Change the size of the number
3. Set up element background color, title color or number color
4. Pick the right, center or right alignment for your card numbers
5. Format the number so it would display the correct formatting. For example, euro, dollar, decimal, thousands or any other formatting. Click on the questions mark to open the table with custom formatting or visit this article. Simply copy the format column to see the desired output in the card.
6. You can resize the element by dragging the right corner in any direction you want.
2.2. Set up the calculations for your element
Once you’ve done the customization part, it’s time to set up calculations for the card.
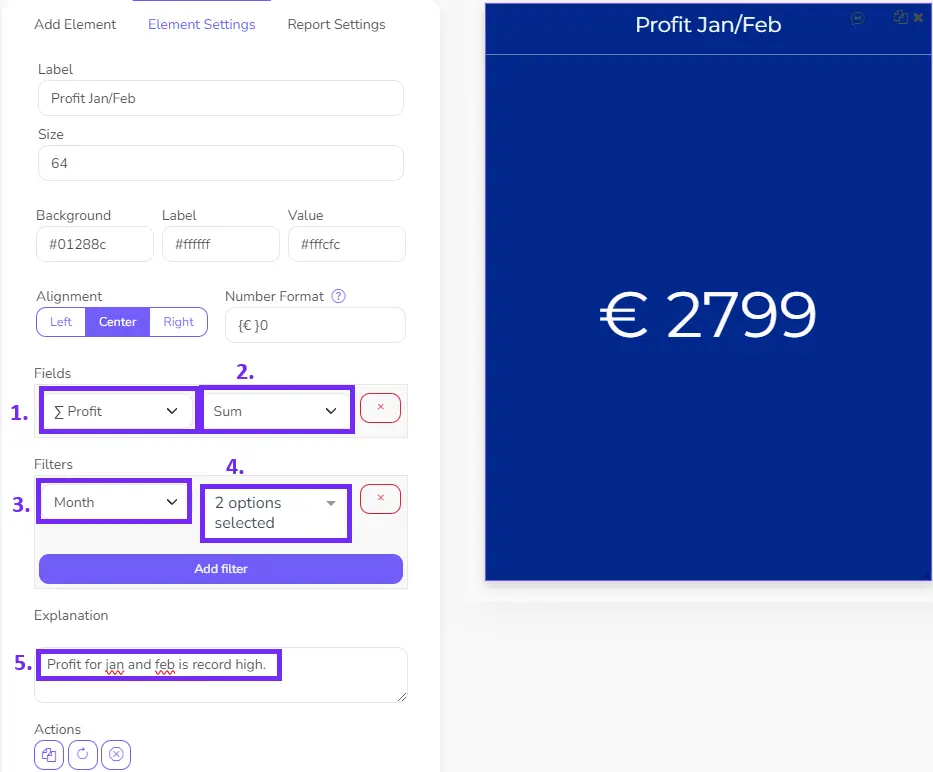
Here’s how to set up the element with your data file:
1. In this field you will see all columns from your data file. Simply, pick the column that you want to calculate.
2. This is the calculation field, where you can choose the calculation for the column that you picked. There are several options available:
- Sum
- Count
- Average
- Max
- Min
- Distinct Count
- Median
- Mode
- Standard Deviation
- Variance
Just pick one of the calculations and the element will automatically update the value for you.
3.,4. The next field is filter where you can apply filters so that the card would calculate value based on the filters you apply. In our example, we applied filters to calculate profit only for January and February. You can add several filters for more specific result.
5. Now you can add comments or explanations for your colleagues or any report users that will view the report.
Click Save and add the next element. If you can’t save the report it means that you have a freemium plan that let’s you create reports without the ability to save them. If you enjoy our tool consider subscribing for a monthly or yearly plan (this way you will save 30%) to unlock the premium features.
Step 3: Add another element
Once you’re done with the first element you can click on Add element in the editor and pick the next element.
Choose from the element list and edit the next element.
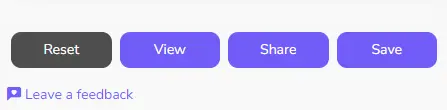
Step 4: Save, Preview, Share
Once you’re report is ready you can save it, preview it to see how it looks in a full width by pressing on the View button at the bottom of editor. You can also share the report with link to others or give editing option by adding other users with email.
You can follow these steps on separate article on how to build the first report.
4. How to share a report with others?
Once you’ve created a report Ajelix BI offers functionality to share it with others. There are different ways how you can access sharing settings. If you’ve upgraded to Ajelix business plan you have unlocked different sharing options:
- You can share a report using link: anyone with a link will be able to view the report
- Add viewers via email: the report will show up on their dashboard
- Add editors using email: they will see the report in their profile
Access the sharing settings
There are several ways how you can share the report, this section will walk you through all the available options.
Option 1: Report sharing through editor
You can share the report while in editing mode. This is a straight-forward process how you can access sharing settings. You will see the Share button under the editor on the left side.
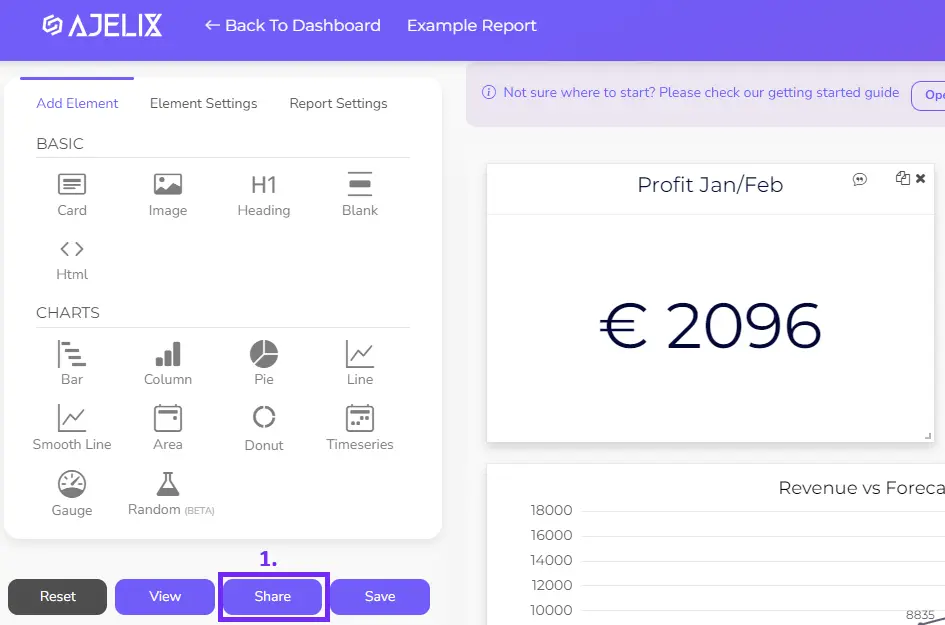
Once you’ve clicked on the share button you will be forwarded to sharing settings.
Option 2: Report sharing through Report section
Another way to access sharing settings is through Report section, where you can see all the reports you’ve created. Each report will have a Share button that will take you to sharing settings.
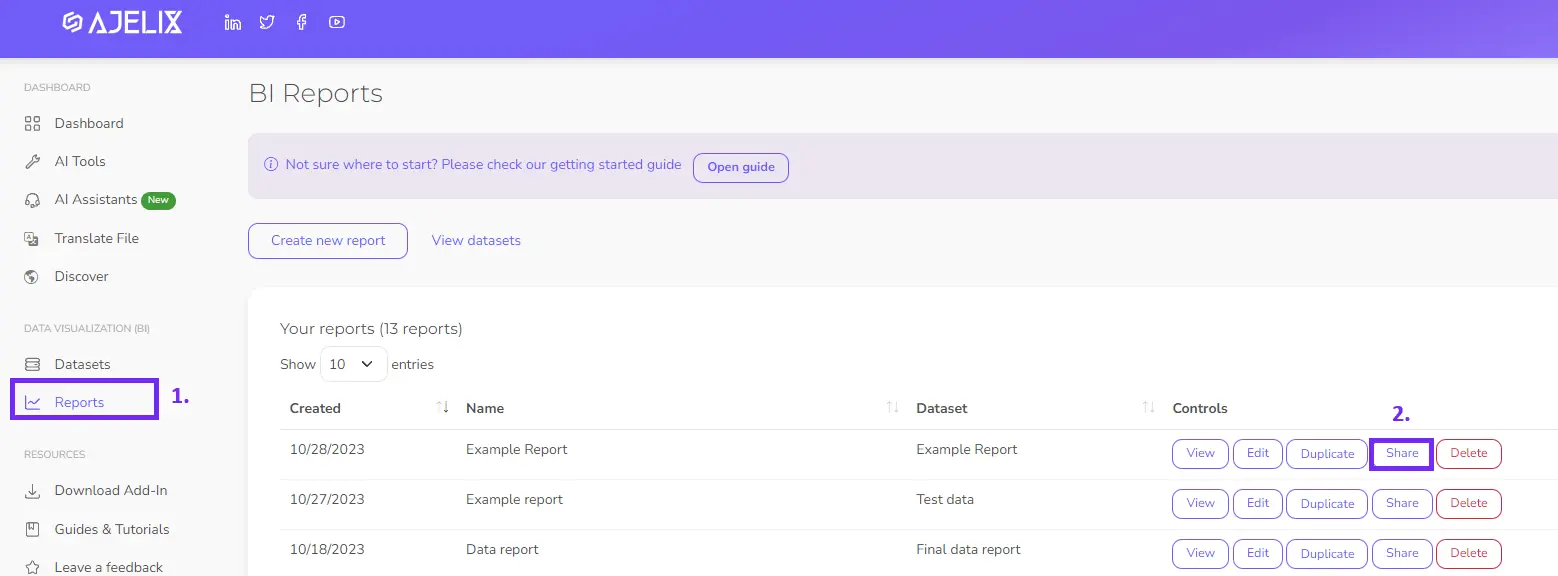
Once you click on the Share button, again, you’ll be forwarded to sharing settings page.
Set up sharing settings
Once you have accessed sharing settings, let’s walk you through the steps on how to set up sharing settings correctly.
1. Anyone with a link sharing
The most popular feature is sharing report via link. Enabling this option will allow anyone who has a link see the report.
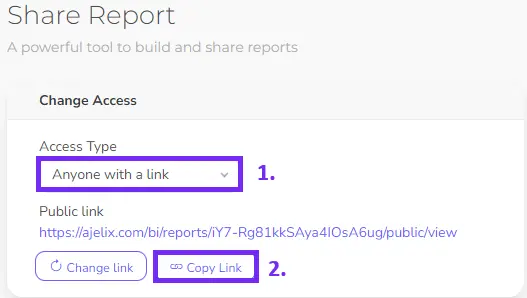
Any report has a default settings – the report is private. To share the report, simply click on the dropdown and pick Anyone with a link. Now you have a sharable link, that you can even change after some time.
2. Share a report with email
If you don’t want to share the report via link as it might be too risky you can add viewers with emails. Before viewing report they will be asked to log in. They can simply create the free account with the same email address and access the report. They don’t have to be subscribers.

To share the report with specific users, insert email, pick the role and click Share. Once you share it you will see added users list that you can edit anytime. However, the email that you added will see the shared report on his BI dashboard.
3. Add editors via email
All editors have to have a registered business plan. Once you add editors to your report they will be asked to subscribe in order to make corrections. We have a good news, if you want to add more than 2 users to Ajelix BI contact us to get a bulk discount.

The sharing process is straight-forward, once you add the email select the Editor role instead of a Viewer.
Didn’t find the answer to your question? Contact us via: support@ajelix.com