24 IT KPIs & Metrics For IT Department With Examples

IT KPIs are quantifiable metrics that help IT departments assess their performance and align with overall business objectives. They provide a clear and objective way to measure how effectively IT is supporting the organization.
IT departments are under constant pressure to deliver efficient, reliable, and innovative services that drive business growth. To measure and optimize performance, IT leaders need a clear set of metrics.
This article presents 24 critical IT KPIs and metrics that can help you gauge the health of your IT operations, demonstrate the value of your team, and identify areas for improvement.
Change the way you work with agentic AI
One-click dashboards,KPI tracking, and AI-powered insights—for work that actually gets done.

24 Most Important IT KPIs
- Ticket Resolution Time
- First Call Resolution (FCR) Rate
- Customer Satisfaction
- Mean Time to Repair
- Mean Time Between Failures
- Network Uptime
- Server Uptime
- Application Availability
- Backup Success Rate
- Storage Utilization
- Projects Delivered on Time
- Project Return on Investment
- Resource Utilization
- IT Budget Variance
- IT Cost per User
- IT Return on Investment
- Number of Security Incidents
- Time to Detect and Respond to Security Incidents
- Percentage of Systems Patched
- IT Automation Rate
- Cloud Adoption Rate
- Number of New IT Initiatives
- Employee Satisfaction
- Employee Turnover Rate
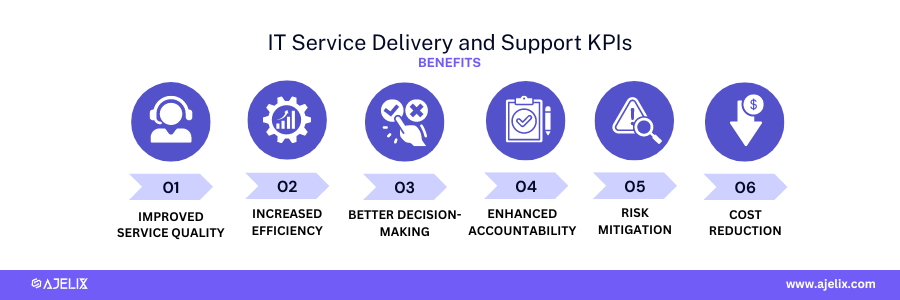
IT Service Delivery and Support KPIs
The primary goal of IT Service Delivery and Support KPIs is to measure and improve the efficiency, effectiveness, and quality of IT services provided to an organization.
Benefits of IT Service Delivery and Support KPIs:
- Improved service quality: identify and address service gaps, leading to higher levels of user satisfaction.
- Increased efficiency: identify areas where processes can be streamlined to reduce costs and improve turnaround times.
- Better decision-making: informed decision-making about resource allocation, service prioritization, and investment in new technologies.
- Enhanced accountability: Establish performance expectations and hold IT teams accountable for delivering on service level agreements (SLAs).
- Risk mitigation: proactively identify potential issues and take steps to prevent service disruptions.
- Cost reduction: significant cost savings through improved efficiency and reduced incident resolution times.
1. Ticket Resolution Time
- Description: Average time taken to resolve a user-reported issue.
- Formula: Total time spent on tickets / Number of tickets
- Example: If 100 tickets were resolved in a month, with a total time of 200 hours, the ticket resolution time is 2 hours per ticket.
- Good score: Depends on the service level agreement (SLA), but typically under 2 hours for high-priority issues and under 24 hours for low-priority issues.
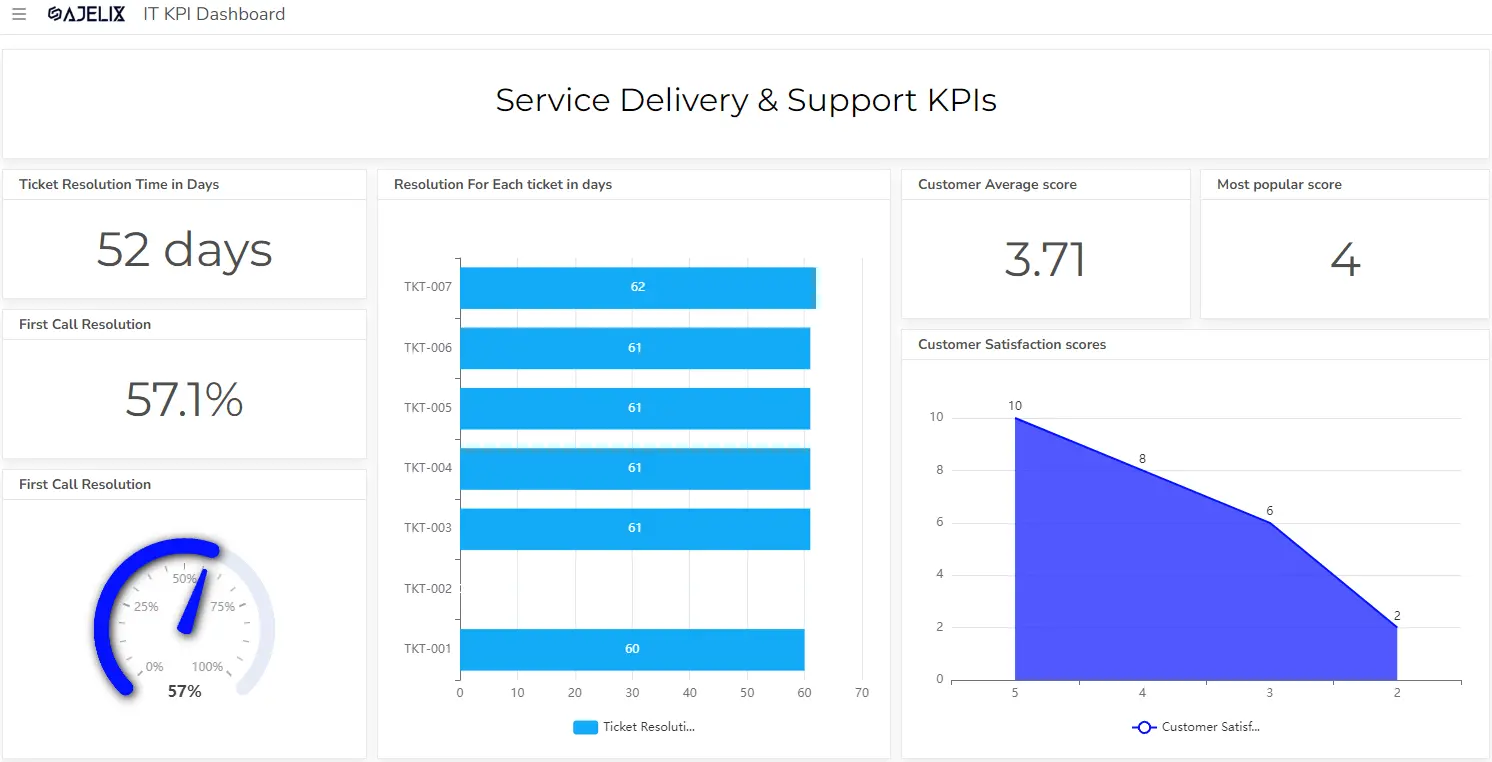
2. First Call Resolution (FCR) Rate
- Description: Percentage of issues resolved on the first contact.
- Formula: (Number of tickets resolved on first call / Total number of tickets) * 100
- Example: If 80 out of 100 tickets were resolved on the first call, the FCR rate is 80%.
- Good score: Above 70% is generally considered good.
3. Customer Satisfaction
- Description: Measures user satisfaction with IT services.
- Formula: Calculated based on survey results or feedback.
- Example: A satisfaction score of 4 out of 5 on a survey.
- Good score: Above 4 out of 5 on a 5-point scale or a Net Promoter Score (NPS) above 0.
4. Mean Time to Repair (MTTR)
- Description: Average time taken to restore a system or service after a failure.
- Formula: Total downtime / Number of failures
- Example: If there were 5 failures in a month, with a total downtime of 10 hours, the MTTR is 2 hours.
- Good score: Depends on the criticality of the system, but generally under 1 hour for critical systems.
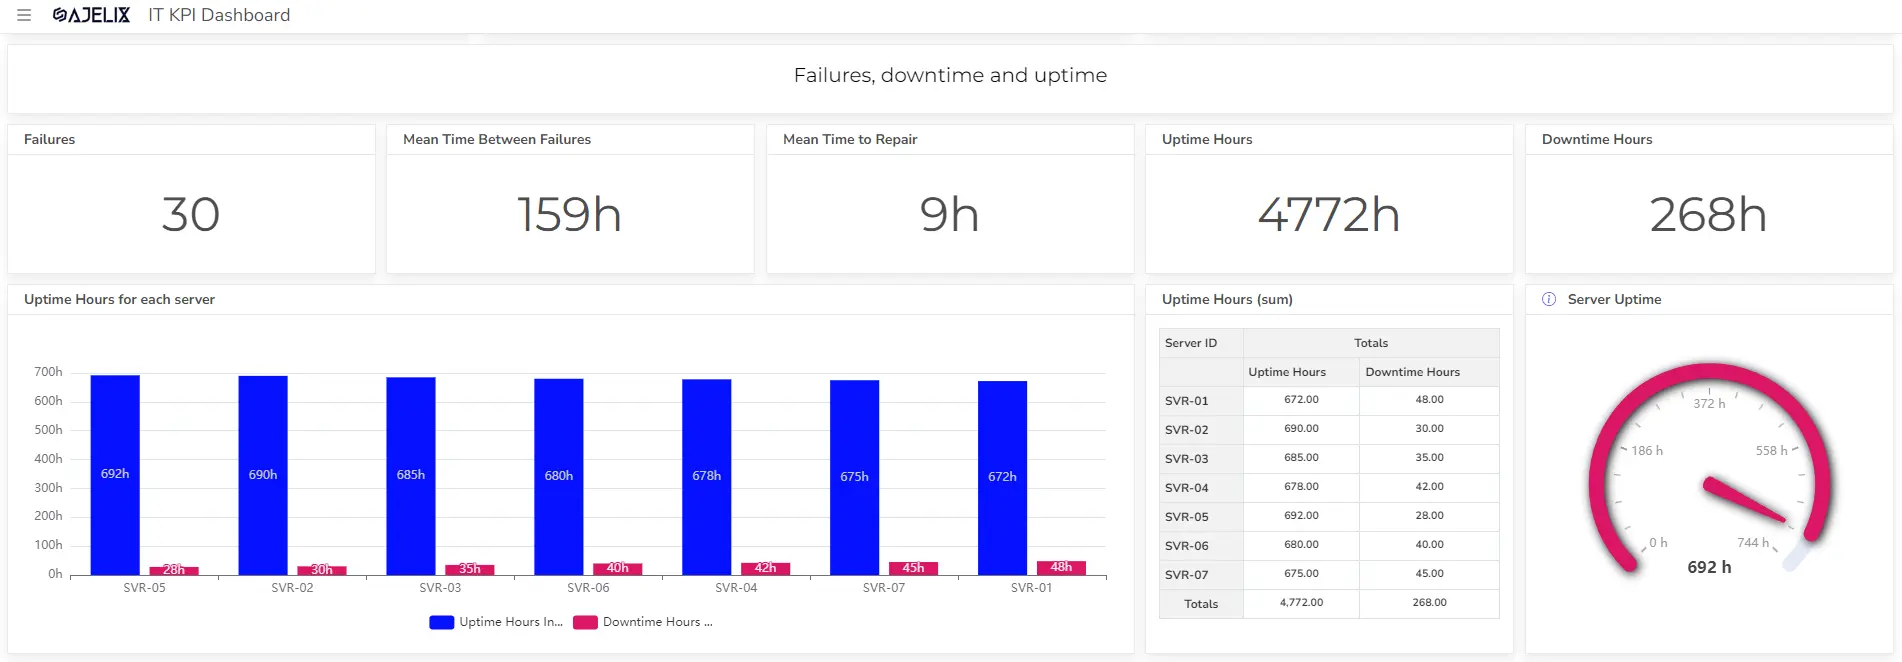
5. Mean Time Between Failures (MTBF)
- Description: Average time between system failures.
- Formula: Total uptime / Number of failures
- Example: If there were 5 failures in a year, with a total uptime of 8760 hours, the MTBF is 1752 hours.
- Good score: Higher MTBF indicates greater reliability.
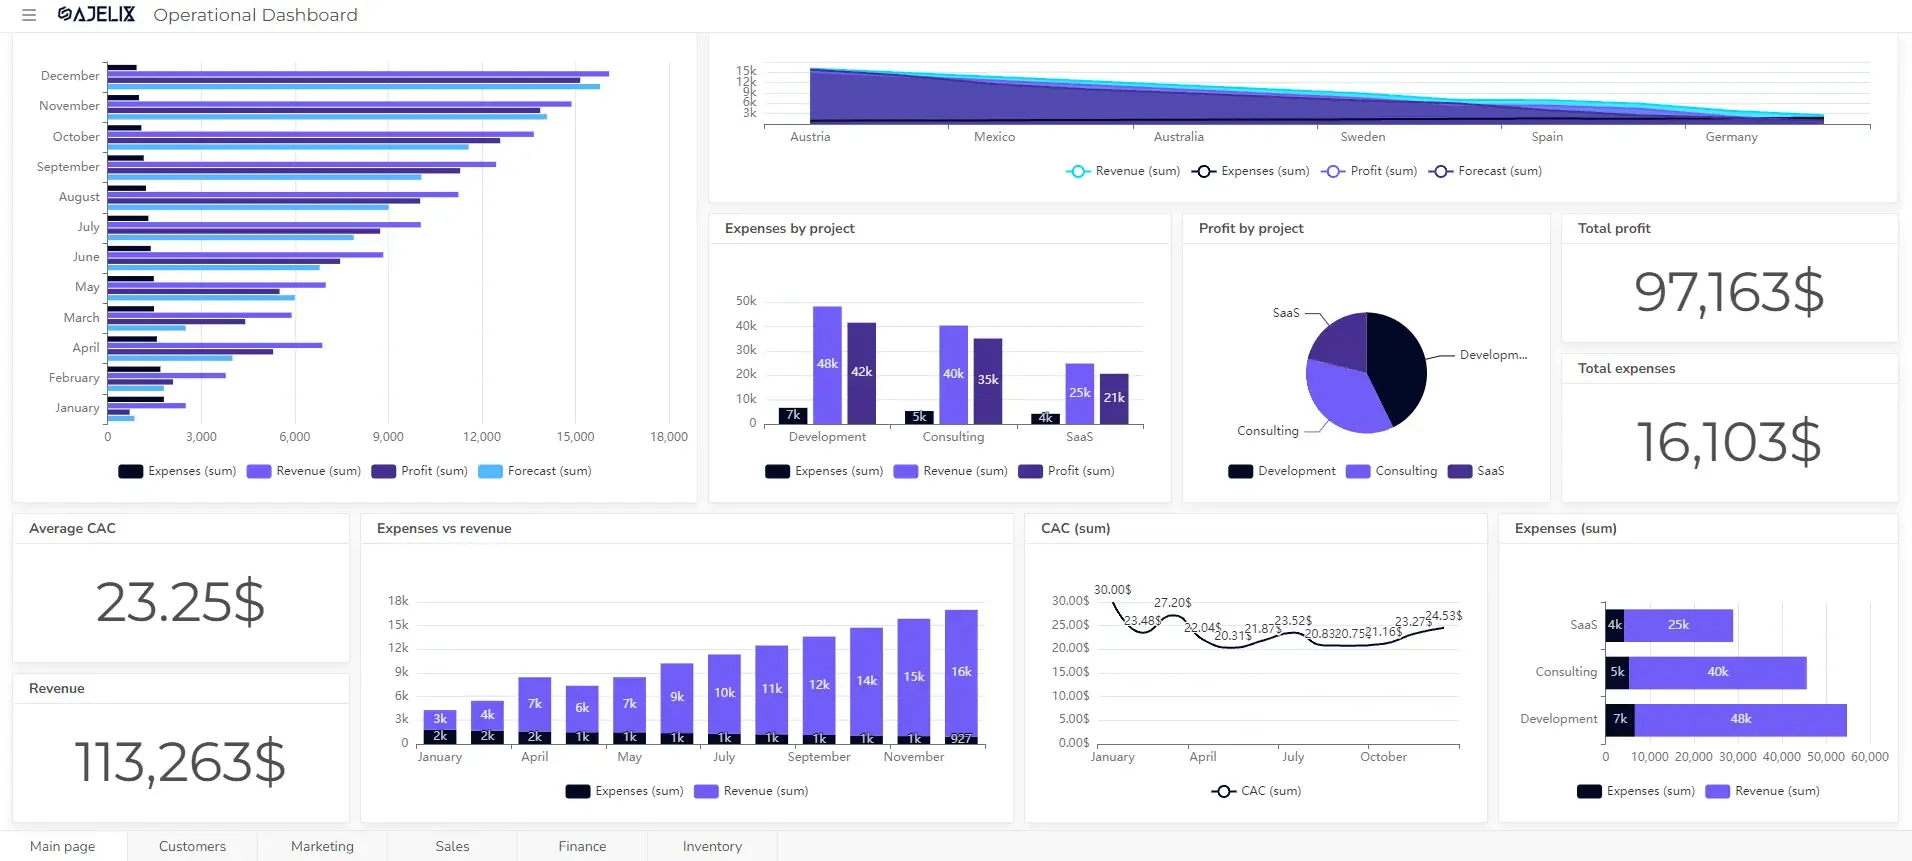
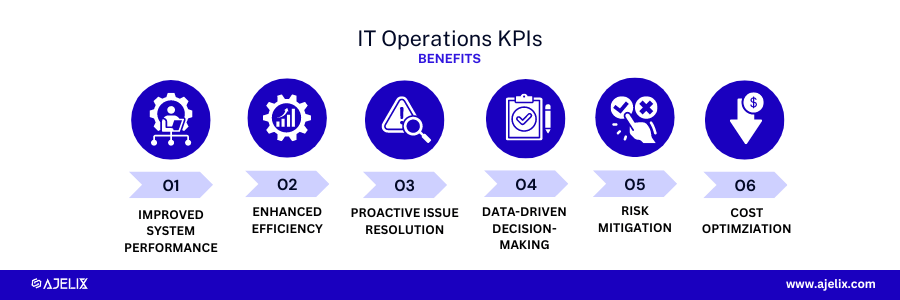
IT Operations KPIs
The primary goal of IT Operations KPIs is to measure the efficiency, reliability, and performance of IT infrastructure and processes. There’s also a guide on how to create operational dashboard.
Benefits of IT Operations KPIs:
- Improved system performance: identify and address performance bottlenecks, leading to increased system reliability and availability.
- Enhanced efficiency: measure the productivity of IT operations staff and identify opportunities to streamline processes, reduce costs, and improve resource utilization.
- Proactive issue resolution: identify potential problems early on and take corrective action before they escalate into major issues.
- Data-driven decision-making: enables informed decisions about investments, capacity planning, and resource allocation.
- Risk mitigation: identify potential risks and vulnerabilities, allowing for proactive measures to protect the IT environment.
- Cost optimization: identify areas where costs can be reduced without compromising service quality.
6. Network Uptime
- Description: Percentage of time the network is operational.
- Formula: (Total uptime / Total time) * 100
- Example: If the network was up for 99% of the time, the uptime is 99%.
- Good score: Above 99.9% for critical networks.
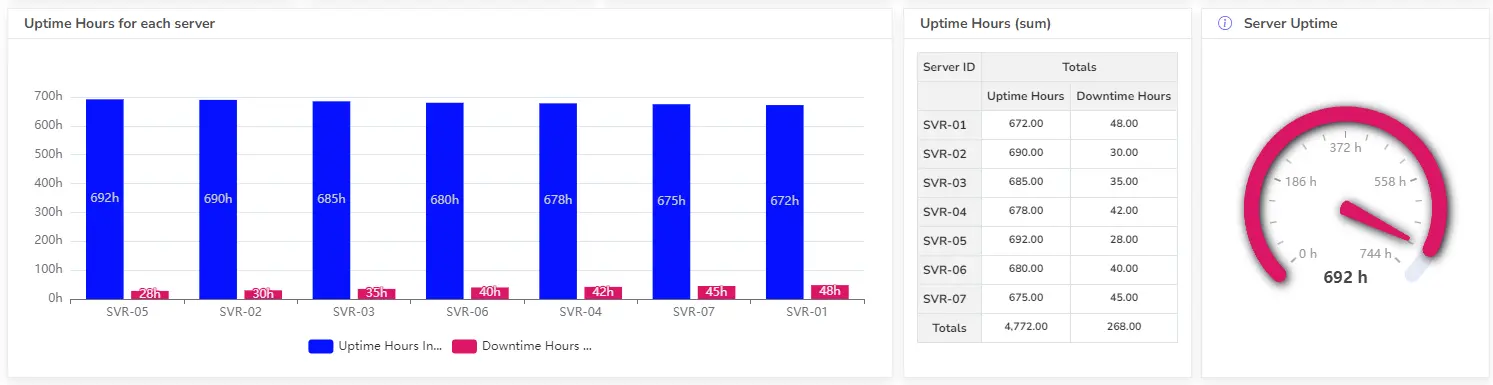
7. Server Uptime
- Description: Percentage of time servers are operational.
- Formula: (Total uptime / Total time) * 100
- Example: If a server was up for 99.5% of the time, the uptime is 99.5%.
- Good score: Depends on the server’s criticality, but generally above 99%.
8. Application Availability
- Description: Percentage of time applications are accessible.
- Formula: (Total uptime / Total time) * 100
- Example: If an application was available for 99.8% of the time, the availability is 99.8%.
- Good score: Depends on the application’s criticality, but generally above 99%.
9. Backup Success Rate
- Description: Percentage of successful backup operations.
- Formula: (Number of successful backups / Total number of backups) * 100
- Example: If 95 out of 100 backups were successful, the backup success rate is 95%.
- Good score: Above 98% is generally considered good.
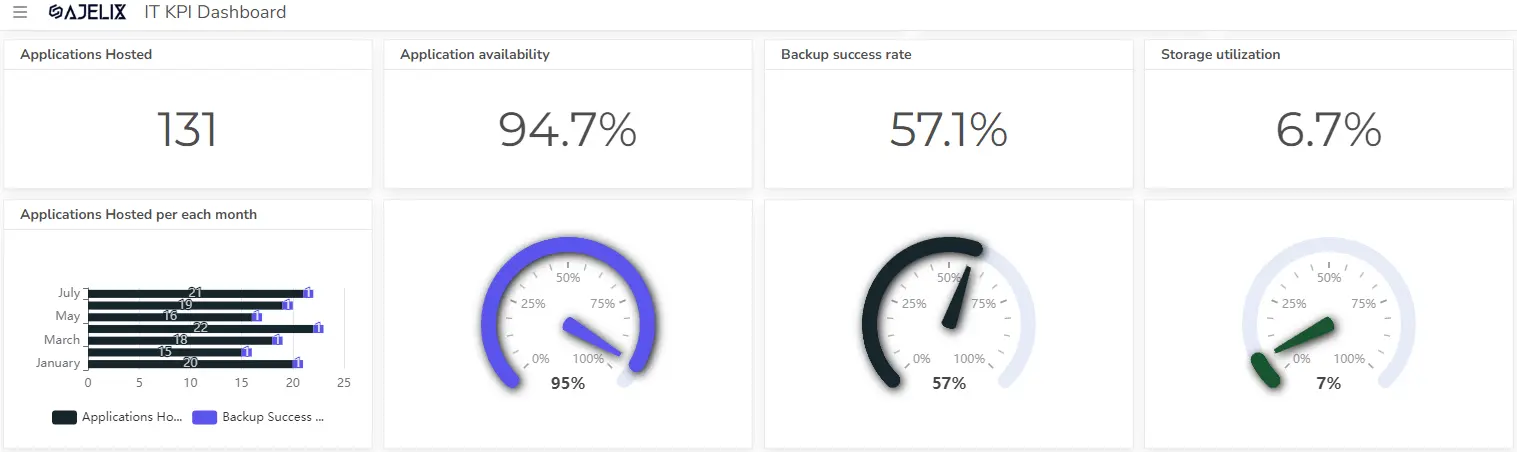
10. Storage Utilization
- Description: Efficiency of storage space usage.
- Formula: (Used storage space / Total storage space) * 100
- Example: If 70% of the total storage space is used, the storage utilization is 70%.
- Good score: Between 70% and 85% is often considered optimal, avoiding both underutilization and overutilization.
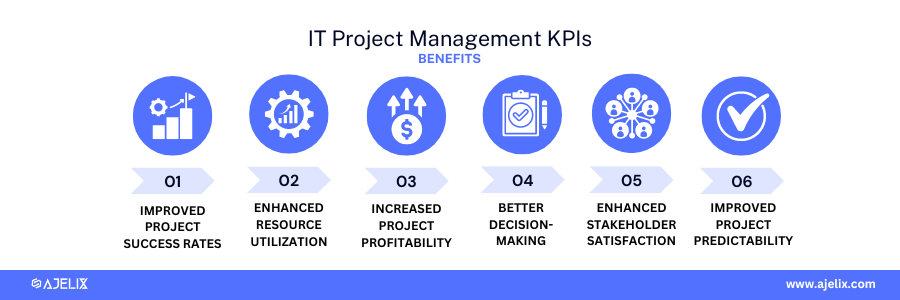
IT Project Management KPIs
The primary goal of IT project management KPIs is to measure the efficiency, effectiveness, and overall success of IT projects.
Benefits of IT Project Management KPIs:
- Improved project success rates: identify potential risks and issues early on, allowing for proactive measures to keep projects on track.
- Enhanced resource utilization: optimize resource allocation, ensuring that the right people are assigned to the right tasks at the right time.
- Increased project profitability: improve project profitability and return on investment (ROI).
- Better decision-making: make informed decision-making about project scope, budget, and timeline adjustments.
- Enhanced stakeholder satisfaction: demonstrate the value of IT projects to the organization.
- Improved project predictability: improve project forecasting and planning.
11. Projects Delivered on Time, on Budget, on Scope
- Description: Percentage of projects completed within the defined parameters.
- Formula: (Number of projects delivered on time, budget, and scope / Total number of projects) * 100
- Example: If 8 out of 10 projects met all criteria, the on-time, on-budget, on-scope delivery rate is 80%.
- Good score: Above 70% is generally considered good.
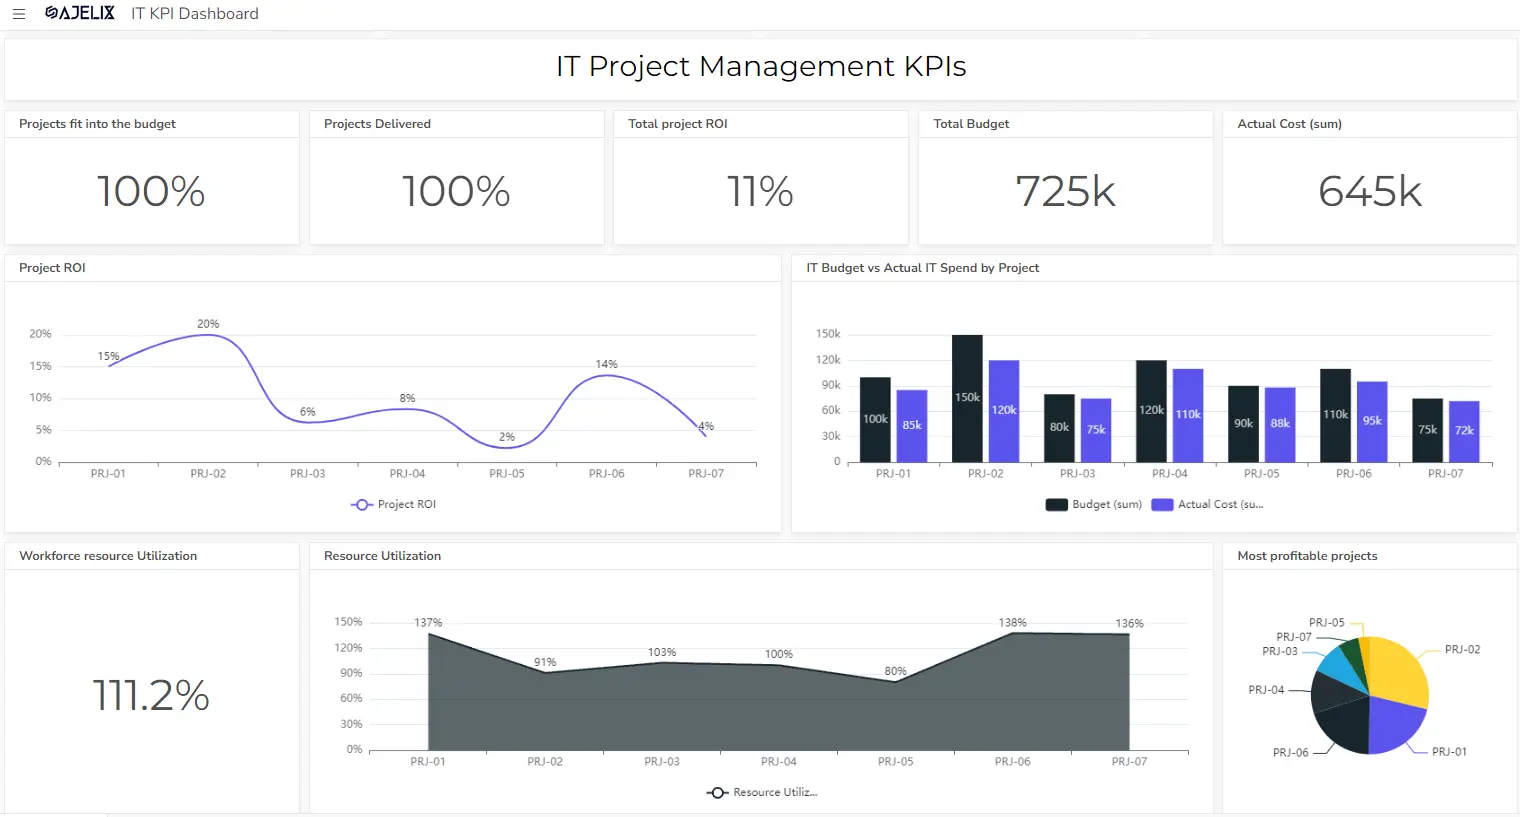
12. Project Return on Investment (ROI)
- Description: Financial benefits of completed projects.
- Formula: (Project benefits – Project costs) / Project costs
- Example: If a project generated $150,000 in benefits and cost $100,000, the ROI is 50%.
- Good score: Depends on industry standards and organizational goals.
13. Resource Utilization
- Description: Efficiency of IT staff allocation.
- Formula: (Total hours billed / Total hours available) * 100
- Example: If employees billed 800 hours out of 1000 available hours, the resource utilization is 80%.
- Good score: Between 75% and 85% is often considered optimal.
There’s also a guide on HR KPIs for further exploration.
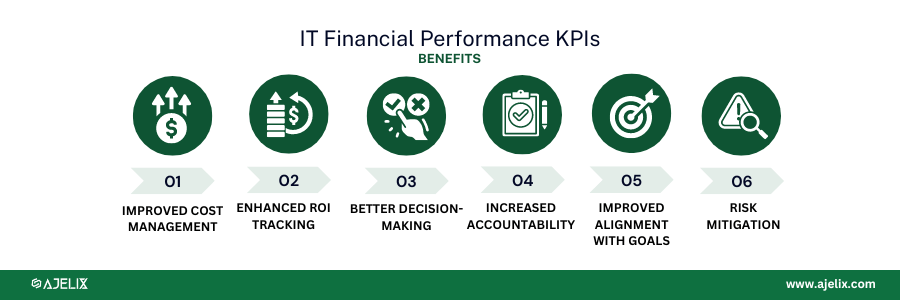
Financial Performance KPIs
The primary goal of IT financial performance KPIs is to measure the financial impact and efficiency of IT investments and operations.
Benefits of IT Financial Performance KPIs
- Improved cost management: identify areas for cost reduction and optimize resource allocation.
- Enhanced ROI measurement: demonstrate the value of IT projects and initiatives to the business.
- Better decision-making: make informed decisions about IT spending, resource allocation, and technology investments.
- Increased accountability: establish performance expectations and hold IT accountable for delivering on financial targets.
- Improved alignment with business objectives: demonstrate its contribution to the organization’s success.
- Risk mitigation: identify potential financial risks and allow for proactive measures to protect IT investments.
14. IT Budget Variance
- Description: Difference between planned and actual IT spending.
- Formula: (Actual IT spending – Planned IT spending) / Planned IT spending * 100
- Example: If the planned IT budget was $1 million and the actual spending was $1.1 million, the budget variance is 10%.
- Good score: A low positive or negative variance is desirable. A negative variance indicates underspending, while a positive variance indicates overspending.
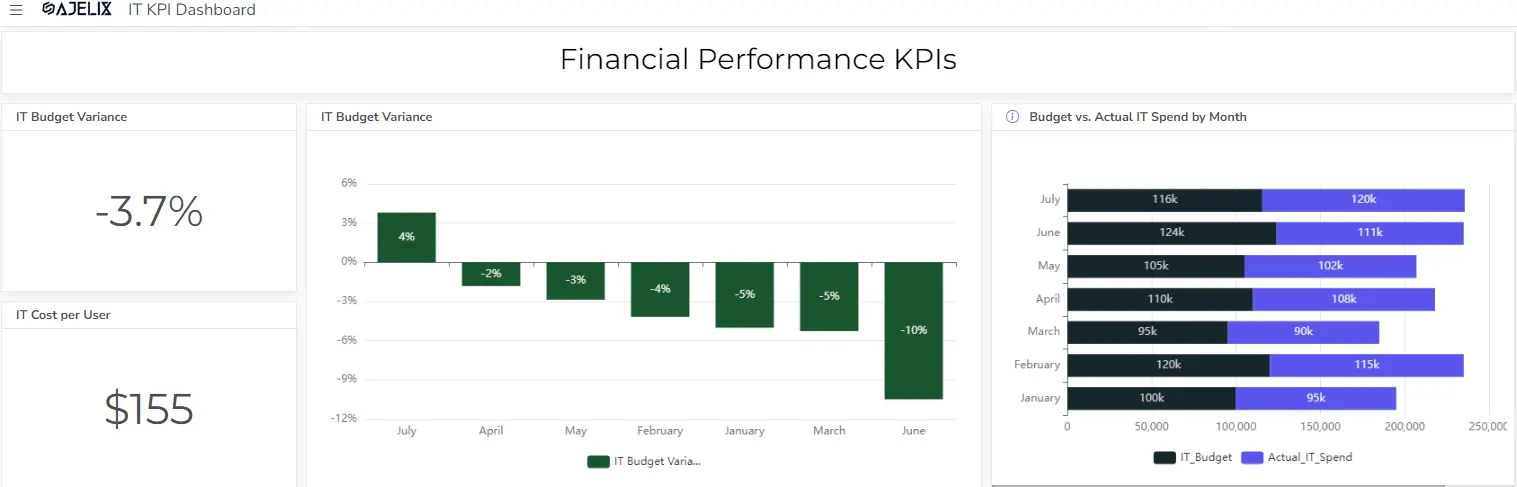
15. IT Cost per User
- Description: Cost of IT services per employee.
- Formula: Total IT costs / Number of users
- Example: If total IT costs are $2 million and there are 1000 users, the IT cost per user is $2000.
- Good score: Lower IT cost per user is generally better, but it depends on the industry and the level of IT services provided.
16. IT Return on Investment (ROI)
- Description: Overall financial impact of IT investments.
- Formula: (Total benefits from IT investments – Total IT costs) / Total IT costs
- Example: If total benefits from IT investments are $500,000 and total IT costs are $300,000, the IT ROI is 66.67%.
- Good score: Depends on industry benchmarks and organizational goals.
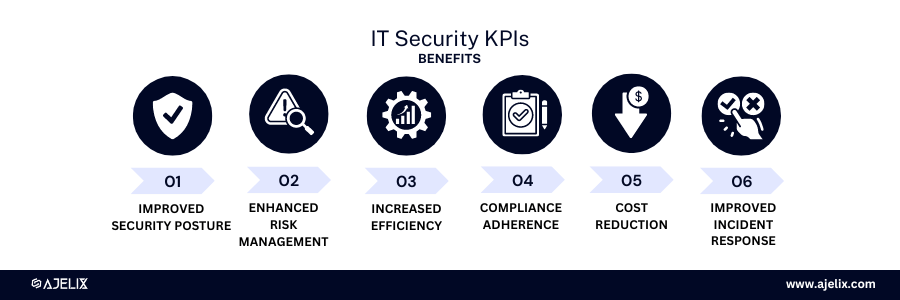
IT Security KPIs
The primary goal of Security KPIs is to measure the effectiveness of an organization’s security posture and identify areas for improvement.
Benefits of IT Security KPIs:
- Improved security posture: identify vulnerabilities and weaknesses in their security defenses.
- Enhanced risk management: assess the overall security risk profile and prioritize mitigation efforts.
- Increased efficiency: optimize security operations by identifying areas where resources can be allocated more effectively.
- Compliance adherence: demonstrate compliance with industry regulations and standards.
- Cost reduction: address security vulnerabilities, and reduce the cost of security incidents.
- Improved incident response: measure the effectiveness of incident response processes and identify areas for improvement.
17. Number of Security Incidents
- Description: Quantity of security breaches.
- Formula: Total number of security incidents
- Example: If there were 15 security incidents in a year, the number of security incidents is 15.
- Good score: The lower the number, the better.
18. Time to Detect and Respond to Security Incidents
- Description: Speed of response to threats.
- Formula: Average time to detect and respond to security incidents
- Example: If the average time to detect and respond to a security incident is 2 hours, the time to detect and respond is 2 hours.
- Good score: Shorter detection and response times are better.
19. Percentage of Systems Patched
- Description: Compliance with security updates.
- Formula: (Number of patched systems / Total number of systems) * 100
- Example: If 95% of systems are patched, the percentage of patched systems is 95%.
- Good score: Above 95% is generally considered good.
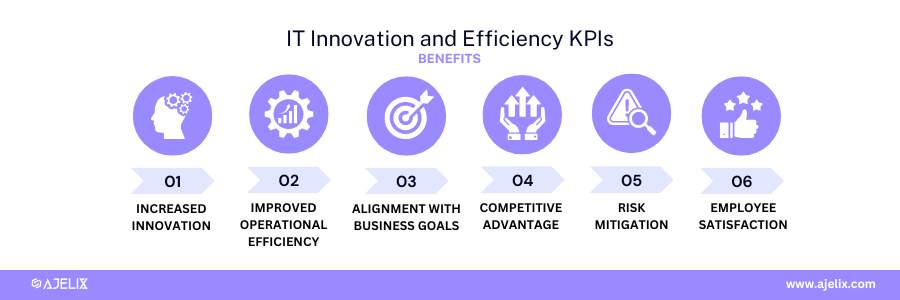
Innovation and Efficiency KPIs
The primary goal of IT Innovation and Efficiency KPIs is to measure the ability of IT to drive innovation and improve operational efficiency.
Benefits of IT Innovation and Efficiency KPIs
- Increased innovation: identify successful innovation initiatives and replicate them across the organization.
- Improved operational efficiency: identify and eliminate waste, reduce costs, and improve overall IT performance.
- Stronger alignment with business objectives: demonstrate the impact of IT on business growth and efficiency, IT can gain increased support and funding.
- Competitive advantage: IT innovation can lead to new products, services, and business models, giving the organization a competitive edge.
- Risk mitigation: reduce the risk of errors, downtime, and security breaches.
- Employee satisfaction: improve job satisfaction and retention among IT staff.
20. IT Automation Rate
- Description: Percentage of IT processes automated.
- Formula: (Number of automated processes / Total number of processes) * 100
- Example: If 30 out of 50 processes are automated, the IT automation rate is 60%.
- Good score: Higher automation rates indicate greater efficiency.
21. Cloud Adoption Rate
- Description: Progress towards cloud-based services.
- Formula: (Number of cloud-based applications / Total number of applications) * 100
- Example: If 25 out of 100 applications are cloud-based, the cloud adoption rate is 25%.
- Good score: Depends on the organization’s cloud strategy, but generally higher rates indicate progress.
22. Number of New IT Initiatives
- Description: Focus on innovation and improvement.
- Formula: Total number of new IT initiatives
- Example: If there were 10 new IT initiatives in a year, the number of new IT initiatives is 10.
- Good score: Depends on the organization’s size and strategic goals.
23. Employee Satisfaction
- Description: Measures IT team morale and engagement.
- Formula: Calculated based on employee surveys or feedback.
- Example: A satisfaction score of 4 out of 5 on a 5-point scale.
- Good score: Above 4 out of 5 on a 5-point scale.
24. Employee Turnover Rate
- Description: Measures the rate at which employees leave a company.
- Formula: (Number of employees who left / Average number of employees) * 100
- You can also calculate metrics using an employee turnover rate calculator.
- Example: If 10 employees leave a company with an average of 100 employees, the turnover rate is 10%.
- Good score: Lower turnover rates indicate higher employee satisfaction and retention.
How To Create An IT KPI Dashboard?
Time needed: 5 hours
Create a data-driven insurance strategy. Learn how to build a high-impact KPI digital dashboard with our step-by-step guide. P.S. You can use Ajelix BI free version to create this dashboard.
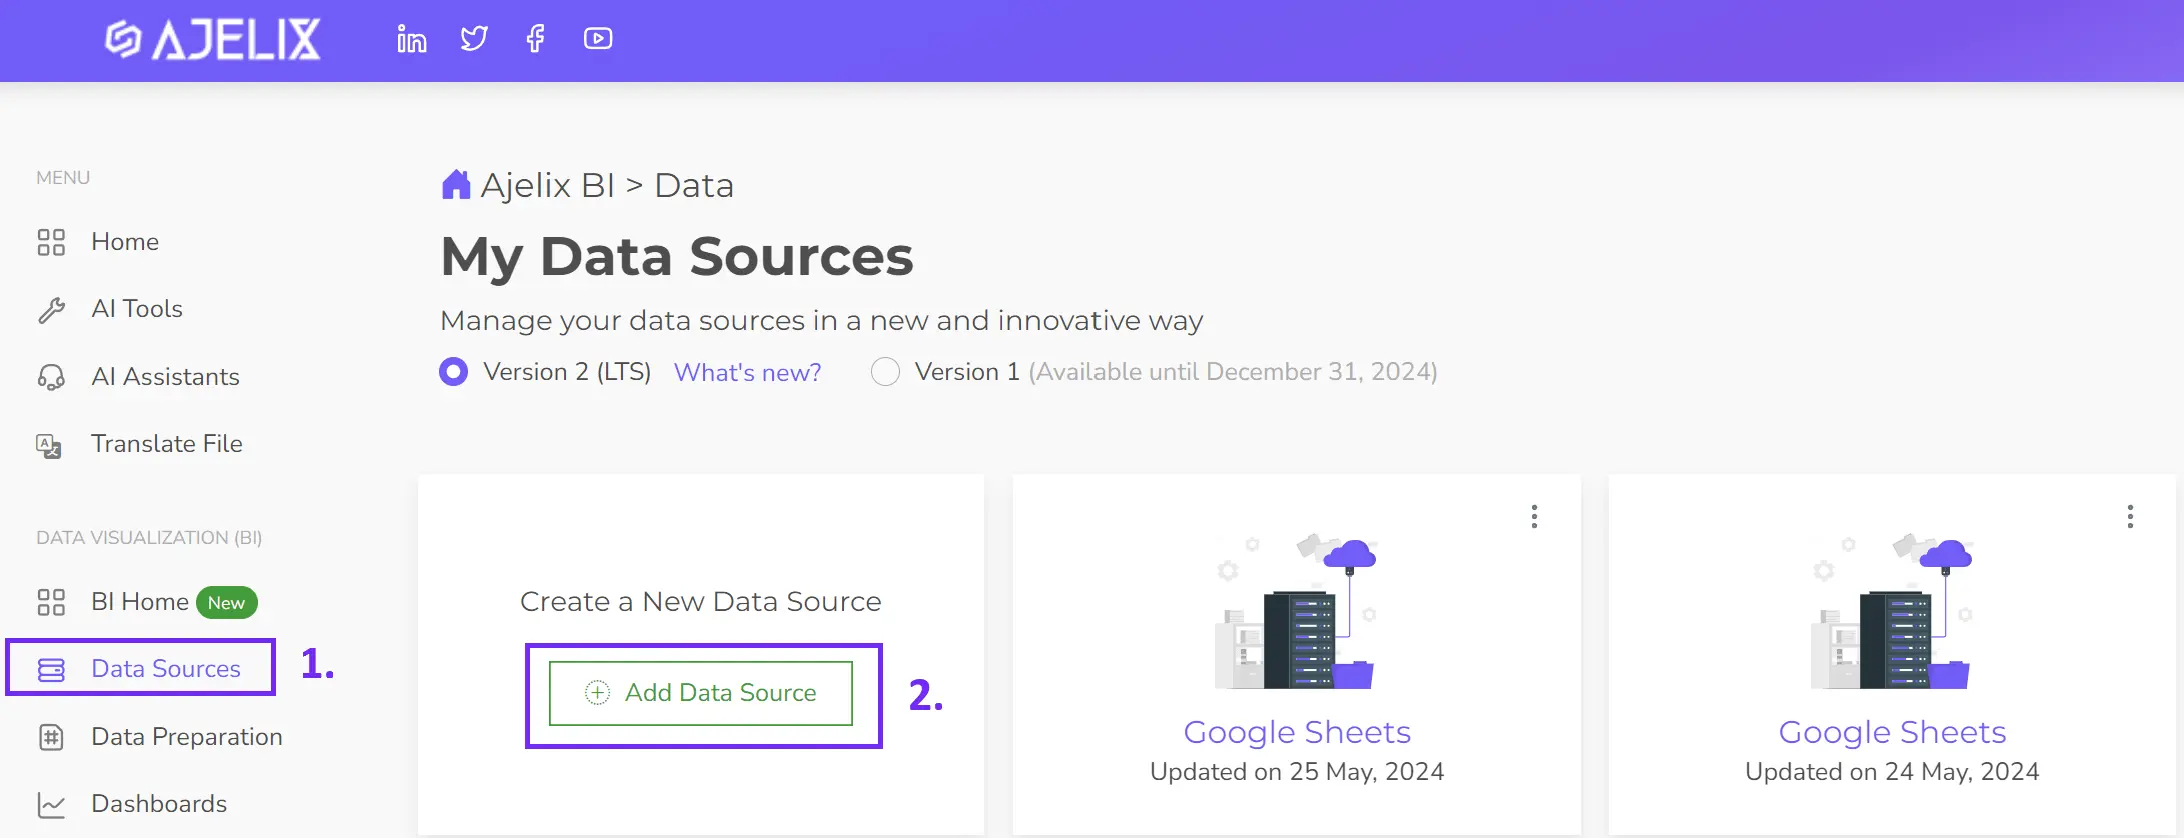
- Connect your data source
Start building your dashboard by connecting your data. Easily import Excel, CSV, Google Sheets, or SQL with Ajelix BI.
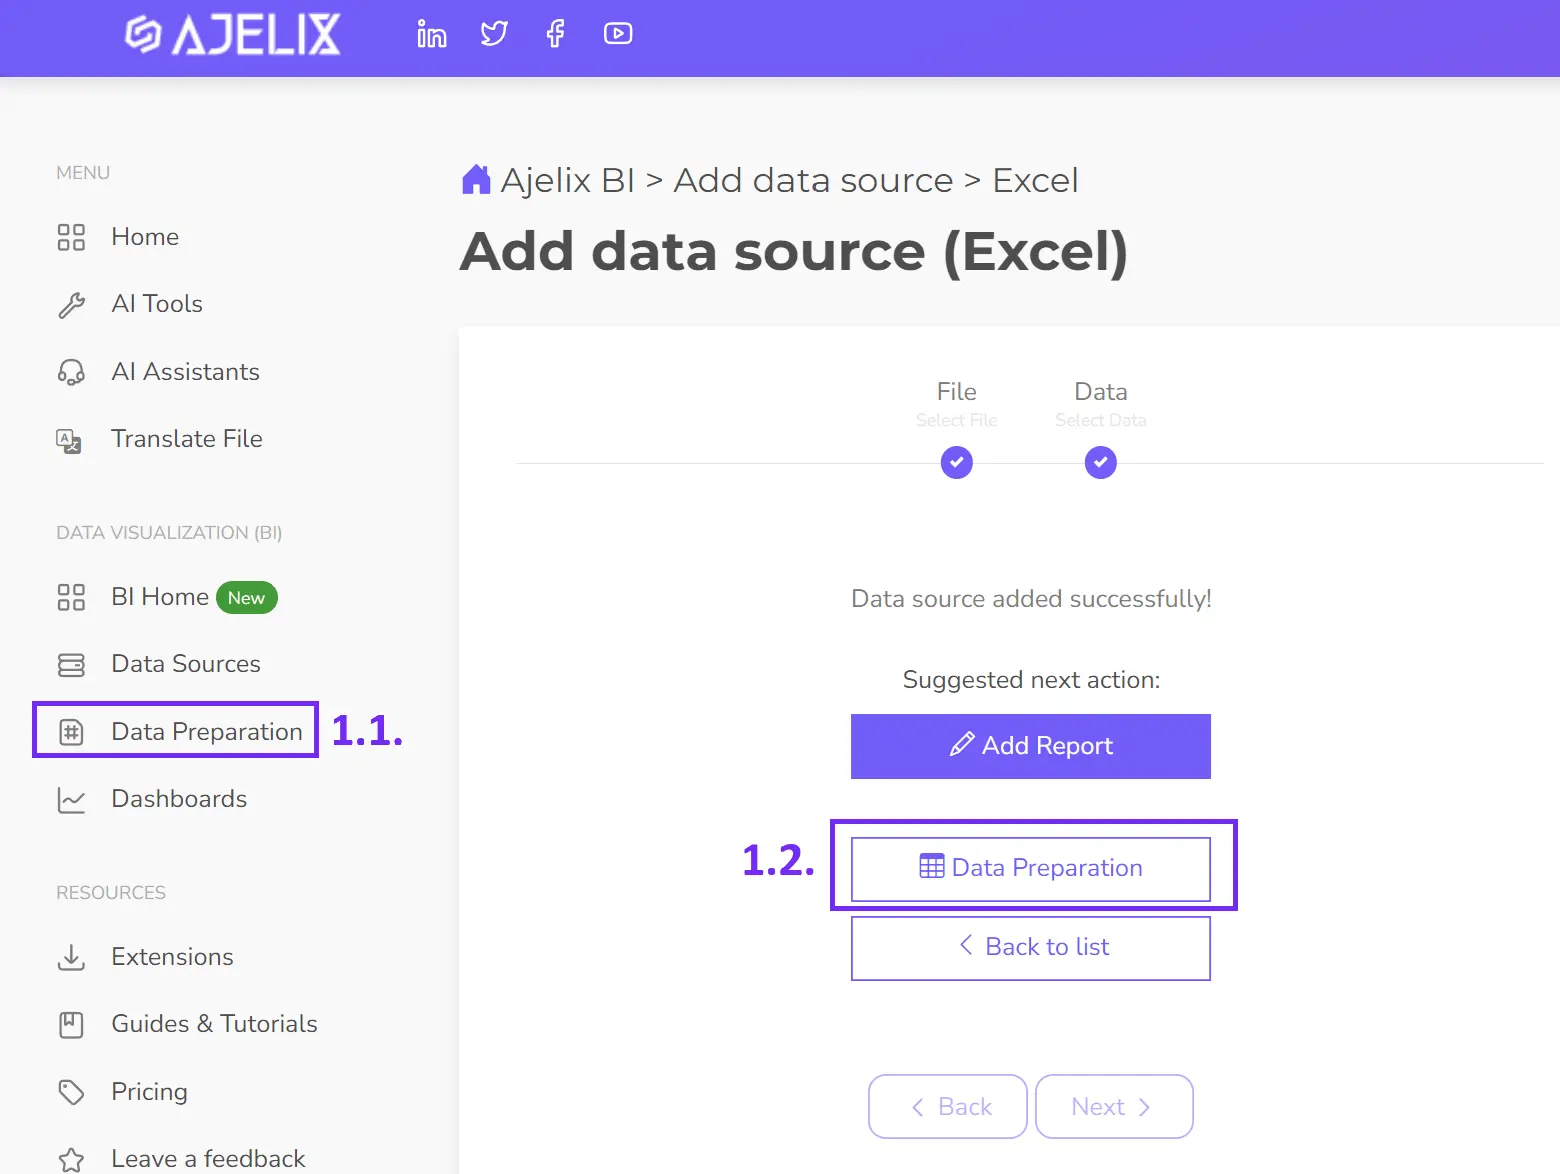
- Clean and transform your data
Prepare data before visualizing it, clean, transform, and filter using a data preparation tool. Ajelix BI offers formatting and filtering options to ensure accurate insights.
- Create KPIs
While some KPIs demand complex calculations, Ajelix BI simplifies the process for many essential metrics. This article outlines over 24 IT KPIs easily calculated within the platform. The accompanying image showcases the intuitive KPI creation process:
1. Select your data source.
2. Create a new measure.
3. Define a clear KPI name.
4. Enter the calculation formula.
5. Save your changes.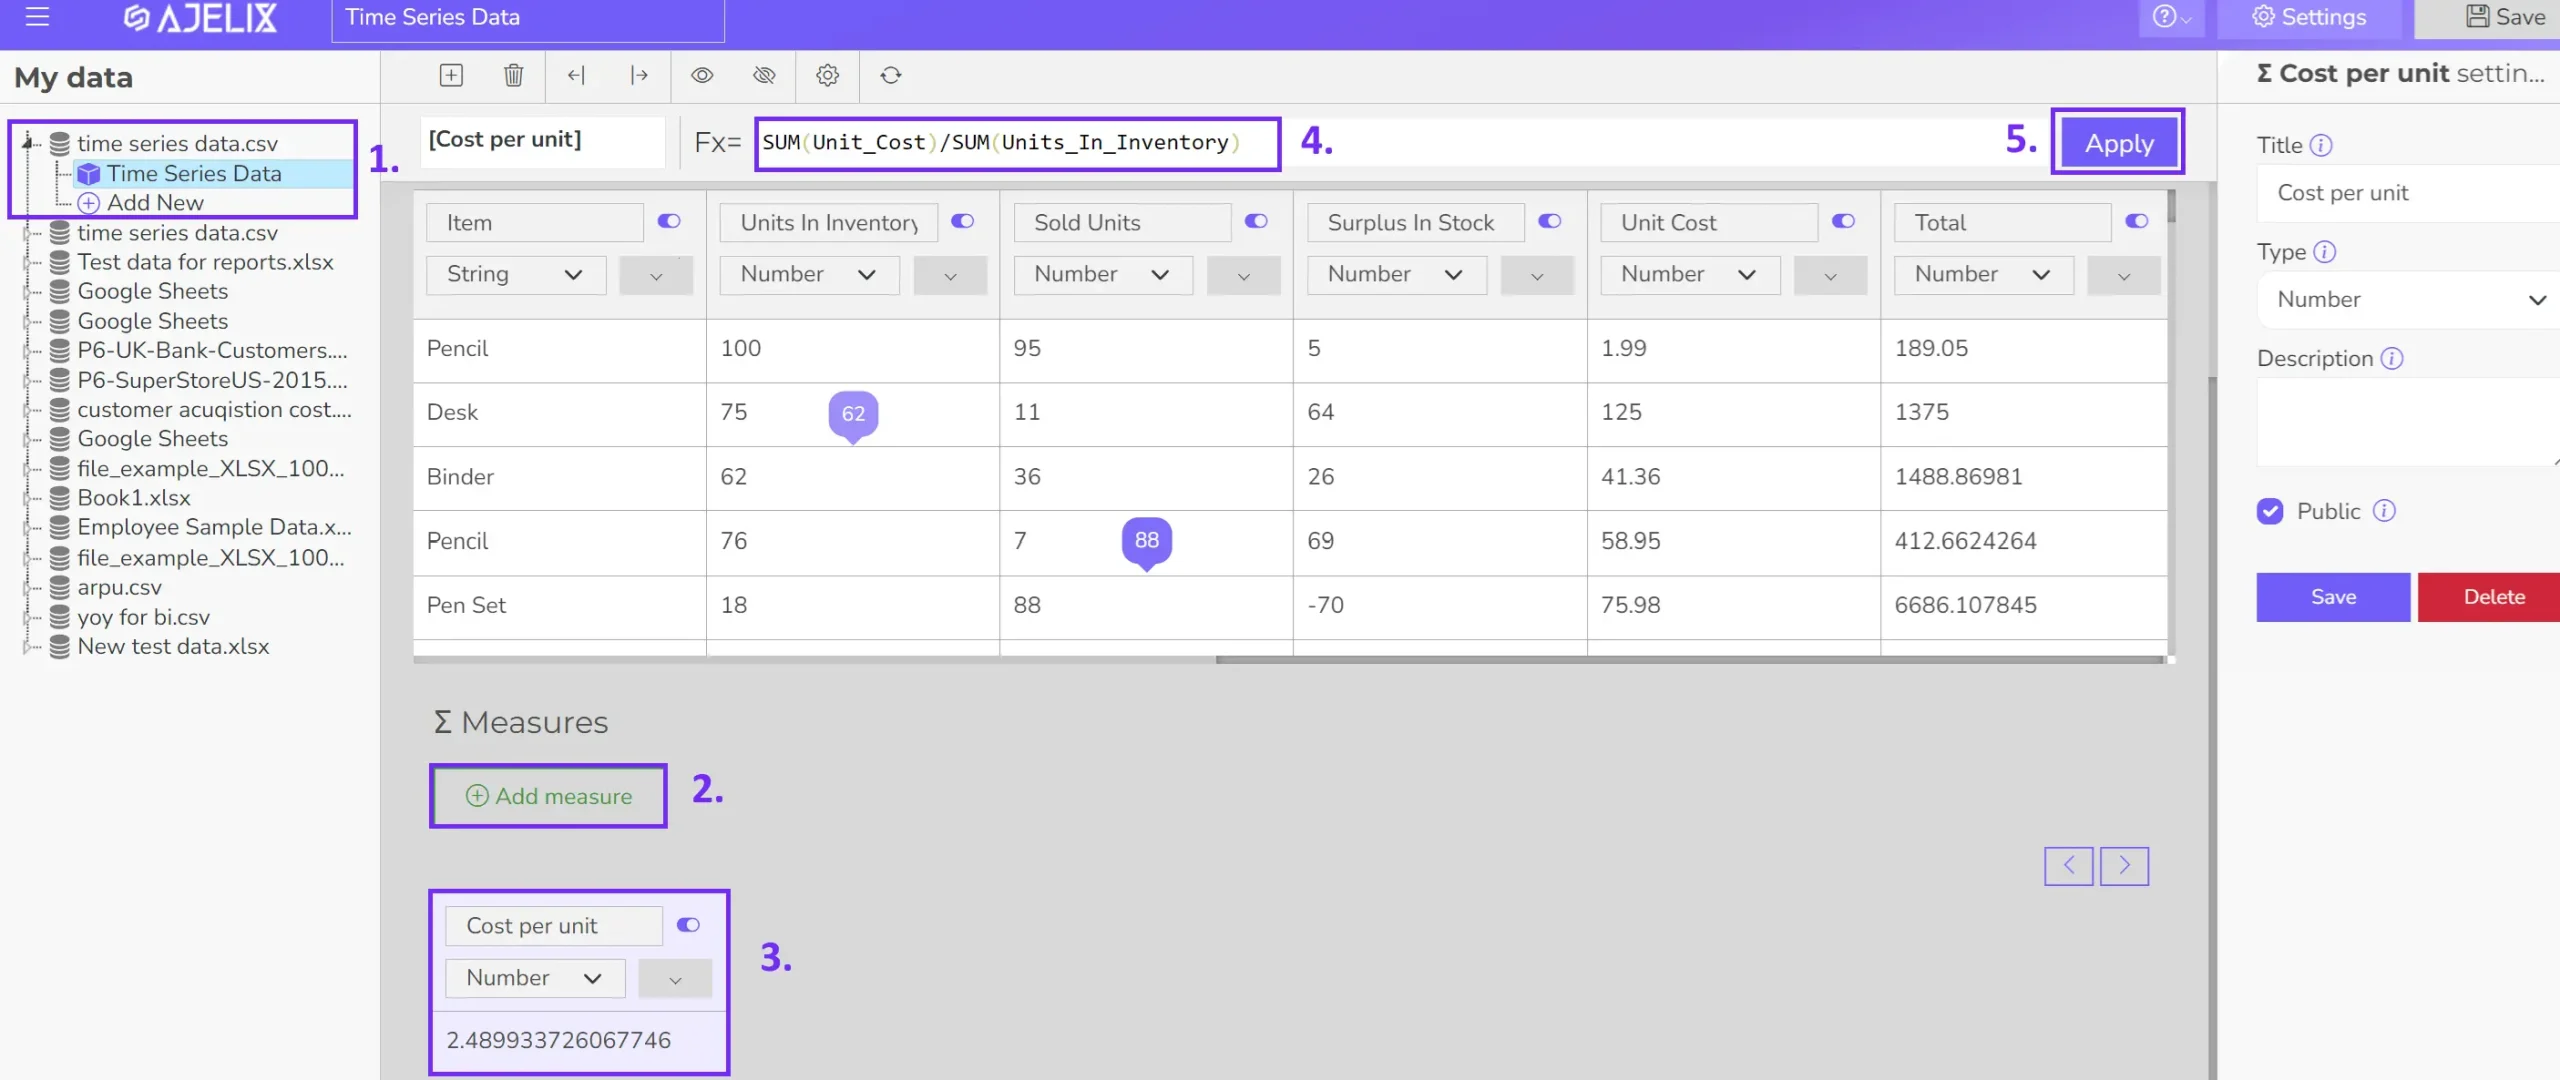
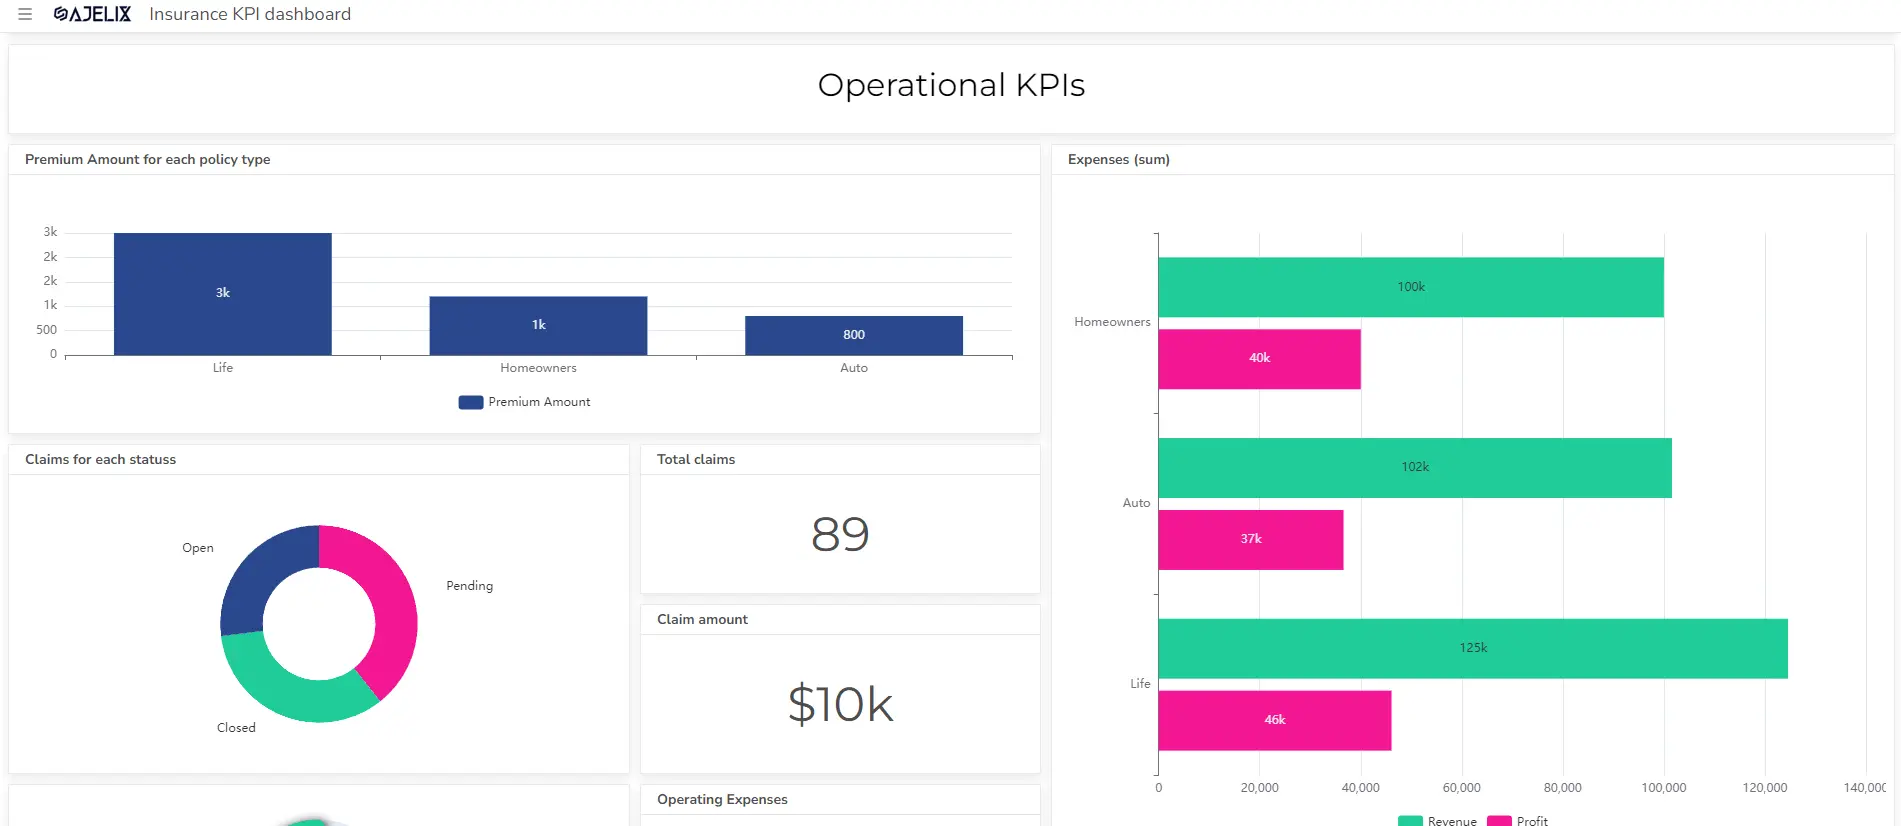
- Build your visualizations
Visualize your KPIs with the perfect chart. Choose from cards, gauges, line graphs, and more. Easily drag and drop data columns to populate your charts. Or, let Ajelix BI’s AI do the work for you with automated chart creation.
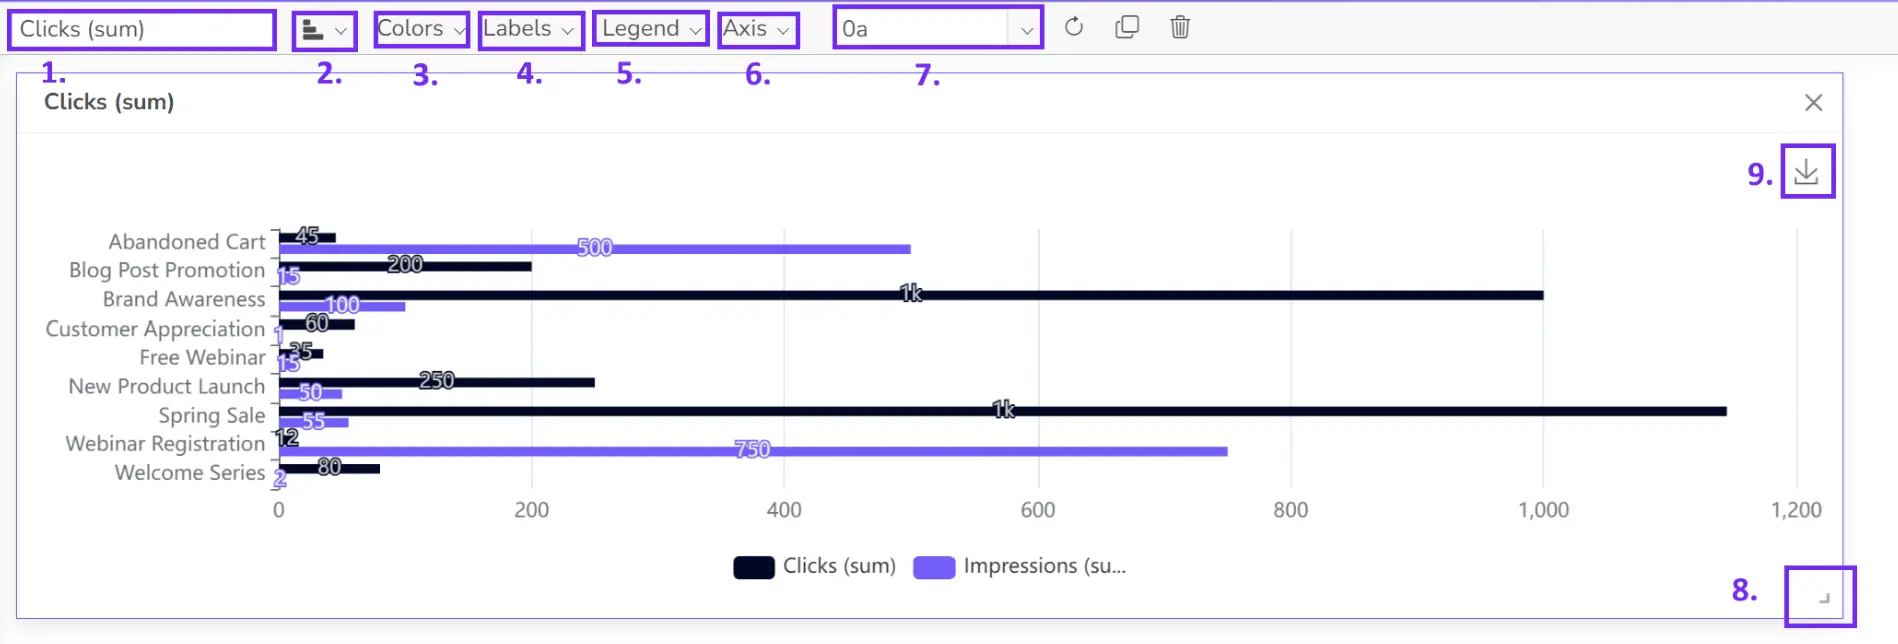
- Customize your dashboard
Add titles, change colors, and customize your chart to meet your brand guidelines using extensive customization options.
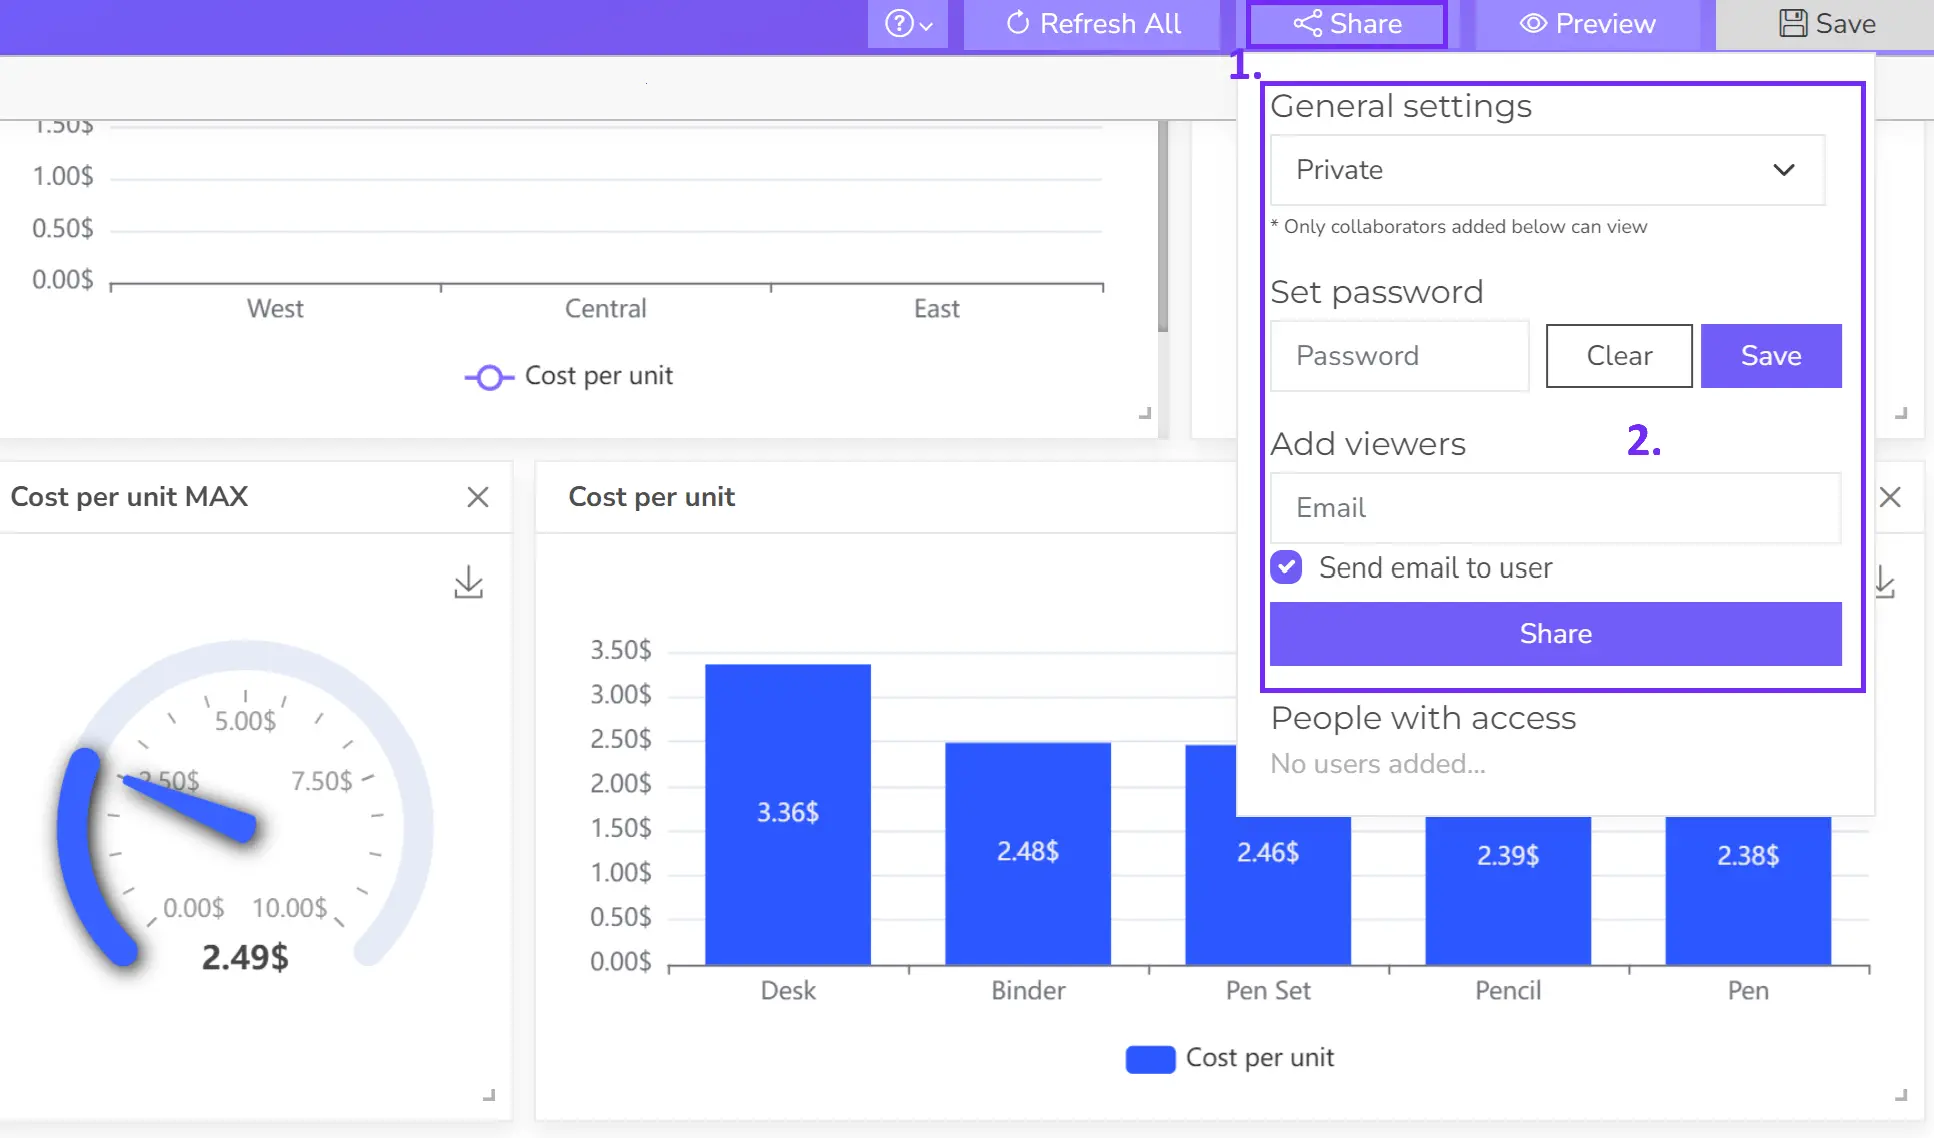
- Share your dashboard
Once happy, publish your dashboard and share it with relevant users for real-time insights.
Struggling with manual calculations & tiring setups?
Let agentic AI do the heavy lifting.
Start free
Fast sign up & easy setup
Tools for IT KPI tracking
The choice of tool for IT KPI tracking depends on the complexity of your KPIs, the size of your IT department, and your budget. Here are some popular options:
Business Intelligence (BI) Tools offer robust data analysis and visualization capabilities, making them suitable for complex IT KPI tracking:
- Ajelix BI: Great solution for KPI tracking and AI data analytics.
- Tableau: Known for its user-friendly interface and powerful data visualization options.
- Power BI: Microsoft’s cloud-based BI service with strong integration capabilities.
- Looker: Cloud-based BI platform with strong data modeling and exploration features.
- Microsoft Excel: Offers basic data analysis and visualization capabilities.
- Google Sheets: Cloud-based spreadsheet with collaboration features.
Reporting gives you a headache?
Upload your data and create professional reports with agentic AI

Start free
Try free and upgrade whenever
FAQ
The frequency of measuring IT KPIs depends on the specific KPI and the business needs. Some KPIs may be measured daily, weekly, monthly, or quarterly.
Setting IT KPIs should involve a collaborative effort between IT and business stakeholders to ensure alignment with overall business objectives.
IT service uptime is typically calculated as the percentage of time a service is available to users compared to the total time it should be available.
There are various tools available for IT KPI tracking, including business intelligence (BI) platforms, project management software, and spreadsheet software. The best tool depends on the complexity of your KPIs and your organization’s needs.
From data to report in one minute or less with Ajelix BI