10 Equipment Rental KPIs For Rental Business

Equipment rental KPIs are measurable values that track how well your rental business is using its equipment to generate profit and satisfy customers. They help you assess areas like utilization rates, customer acquisition costs, and overall rental income.
Maximizing profits and keeping customers happy are constant struggles in the rental business. The key to success lies in using data to make informed decisions for your rentals.
This article explores 10 key Equipment Rental KPIs that will help you understand and calculate the hidden potential of your rental business.
Change the way you work with agentic AI
One-click dashboards,KPI tracking, and AI-powered insights—for work that actually gets done.

List with 10 Equipment rental KPIs
- Dollar Utilization
- Time Utilization
- Average Booking Value
- Customer Acquisition Cost
- Conversion Rate
- Rental Rate
- Profit
- Fleet to Rental Ratio
- Vacancy Rate
- Customer Satisfaction
What are rental KPIs?
Equipment Rental KPIs, or Key Performance Indicators, are measurable values that track the health and performance of your rental business. They provide insights into various aspects of your operation, like how efficiently you’re using your inventory, how much profit you generate, and how satisfied your customers are.
These metrics can help you make data-driven decisions to:
- Increase equipment utilization: Ensure your rental items are rented out as often as possible to maximize revenue.
- Optimize pricing: Set competitive rental rates that cover your costs and generate profit.
- Reduce customer acquisition costs: Cost-effectively attract new customers.
- Improve customer satisfaction: Deliver a positive rental experience to keep customers returning.
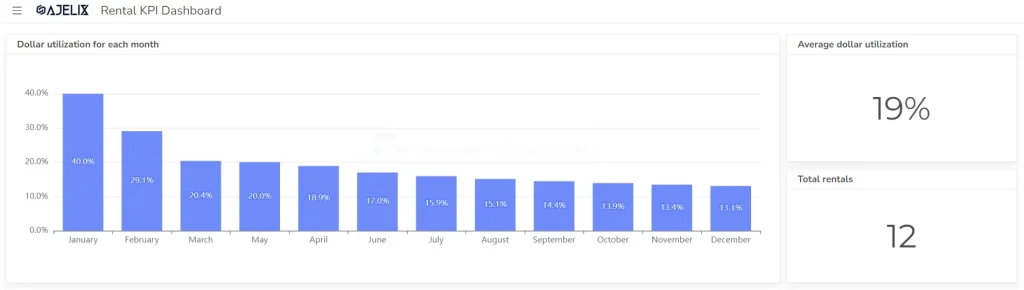
1. Dollar Utilization (Financial Utilization)
This metric measures the revenue generated relative to the cost of acquiring a rental item. It tells you how much money each piece of equipment makes for you.
Dollar Utilization = (Annual Rental Revenue) / (Total Acquisition Cost)
Example
Let’s say a party equipment rental company spends $10,000 on a bounce house and generates $5,000 in rental revenue per year. The dollar utilization would be 50% ($5,000 / $10,000).
Good score
A higher percentage indicates your equipment generates more income relative to its cost. Aim for a dollar utilization rate that covers equipment costs, maintenance, and generates profit.
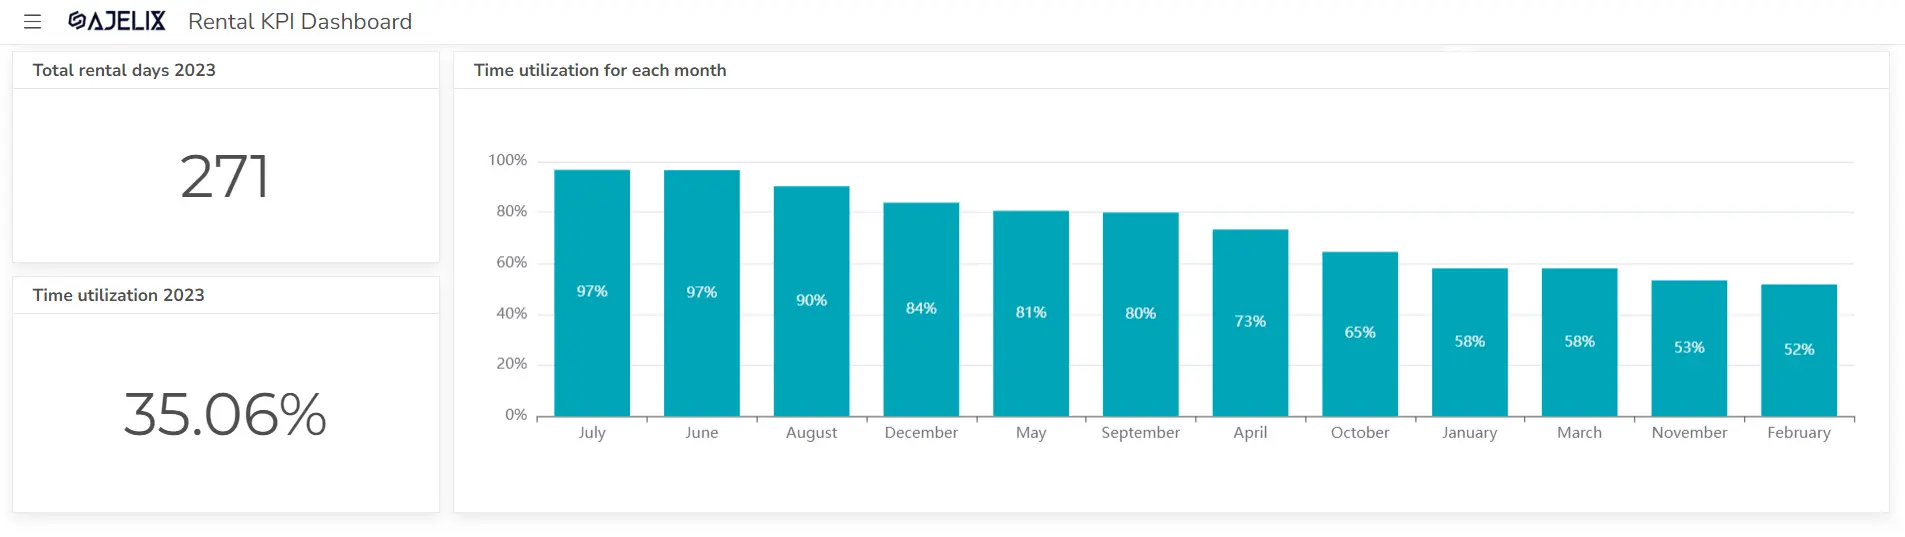
2. Time Utilization
This KPI tracks how often your rental inventory is being rented out. It’s important to strike a balance between having enough equipment to meet customer demand and not having so much that it sits idle.
Time Utilization = (Days Rented) / (Days Available)
Example
A construction company rents out a backhoe for 180 days out of a year (365 days). The time utilization would be 49% (180 days / 365 days). Discover construction KPIs for your rentals here.
What to create your own KPI dashboard? Sign up for free and track your rental business KPIs.
Good metric
A higher percentage signifies your equipment is being rented frequently. However, some downtime for maintenance is necessary. A good balance depends on your industry – construction equipment might have lower utilization than party supplies.
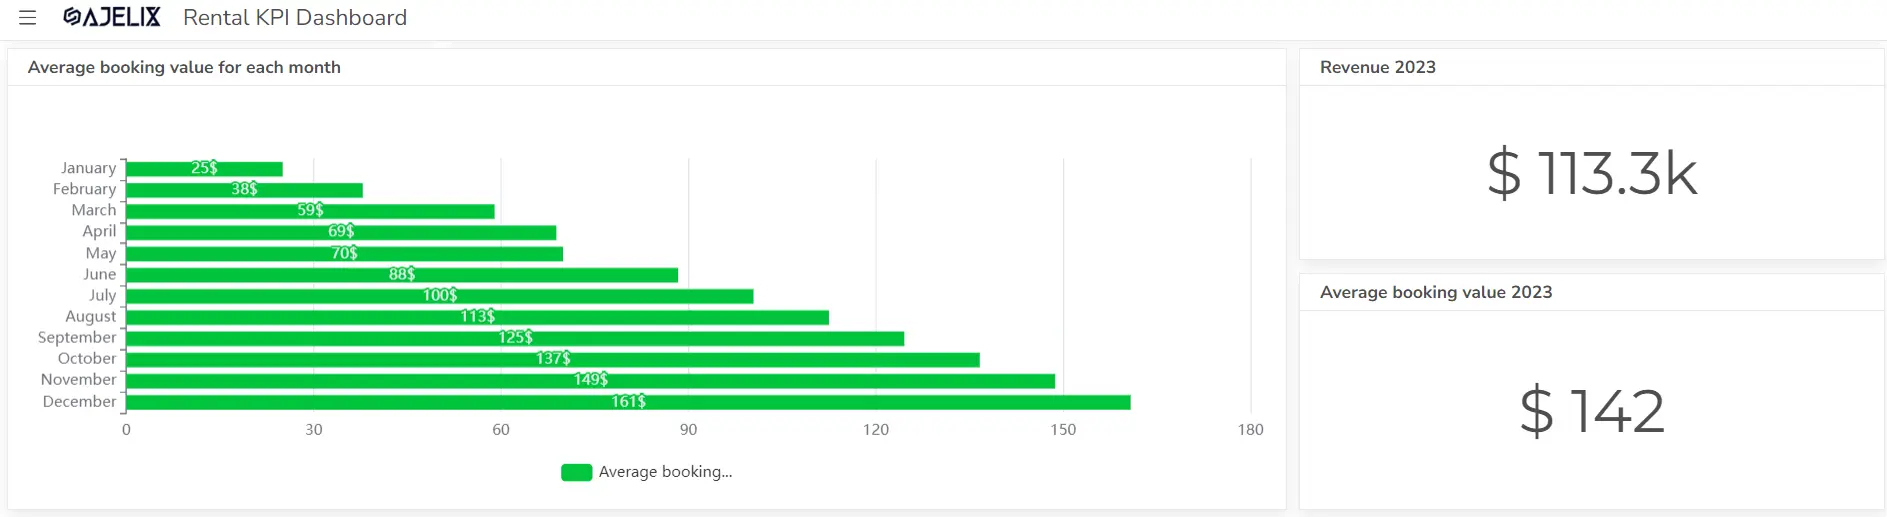
3. Average Booking Value
This metric shows the average amount of revenue generated per rental transaction. It can help identify opportunities to grow revenue by upselling or offering add-on services.
Average Booking Value = (Total Rental Revenue) / (Number of Rentals)
Example
A tool rental store has a total of $10,000 in revenue from 100 tool rentals in a month. The average booking value would be $100 ($10,000 / 100).
Good metric
A higher average booking value indicates you’re generating more revenue per rental. This could be due to higher rental rates, offering add-on services, or renting out equipment bundles.
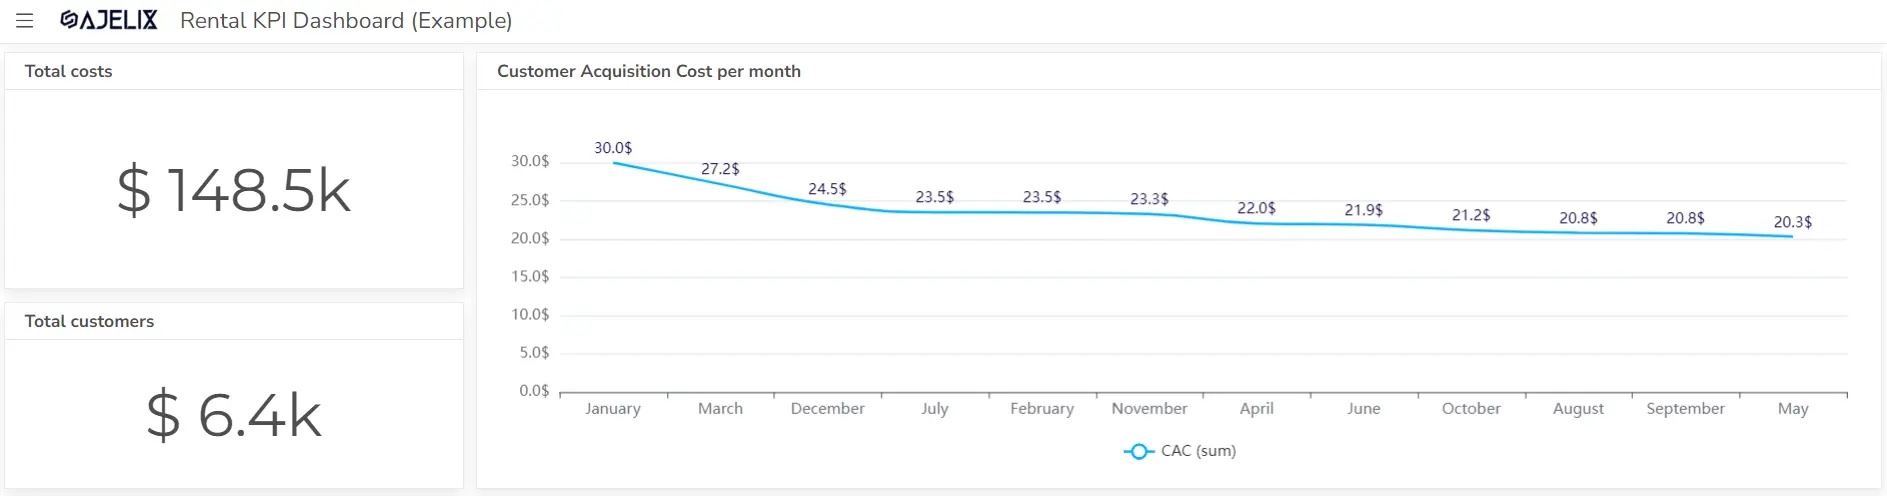
4. Customer Acquisition Cost (CAC)
This KPI tracks how much it costs you to acquire a new customer. It’s important to keep your CAC low in order to maintain profitability.
Customer Acquisition Cost = (Total Marketing & Sales Expenses) / (Number of New Customers Acquired)
You can calculate this metric using a customer acquisition cost calculator.
Example
A clothing rental service spends $20,000 on marketing and acquires 100 new customers in a month. The CAC would be $200 ($20,000 / 100).
Good metric
A lower CAC is ideal. It shows you’re acquiring customers efficiently. Analyze marketing channels to see which ones have lower customer acquisition costs.
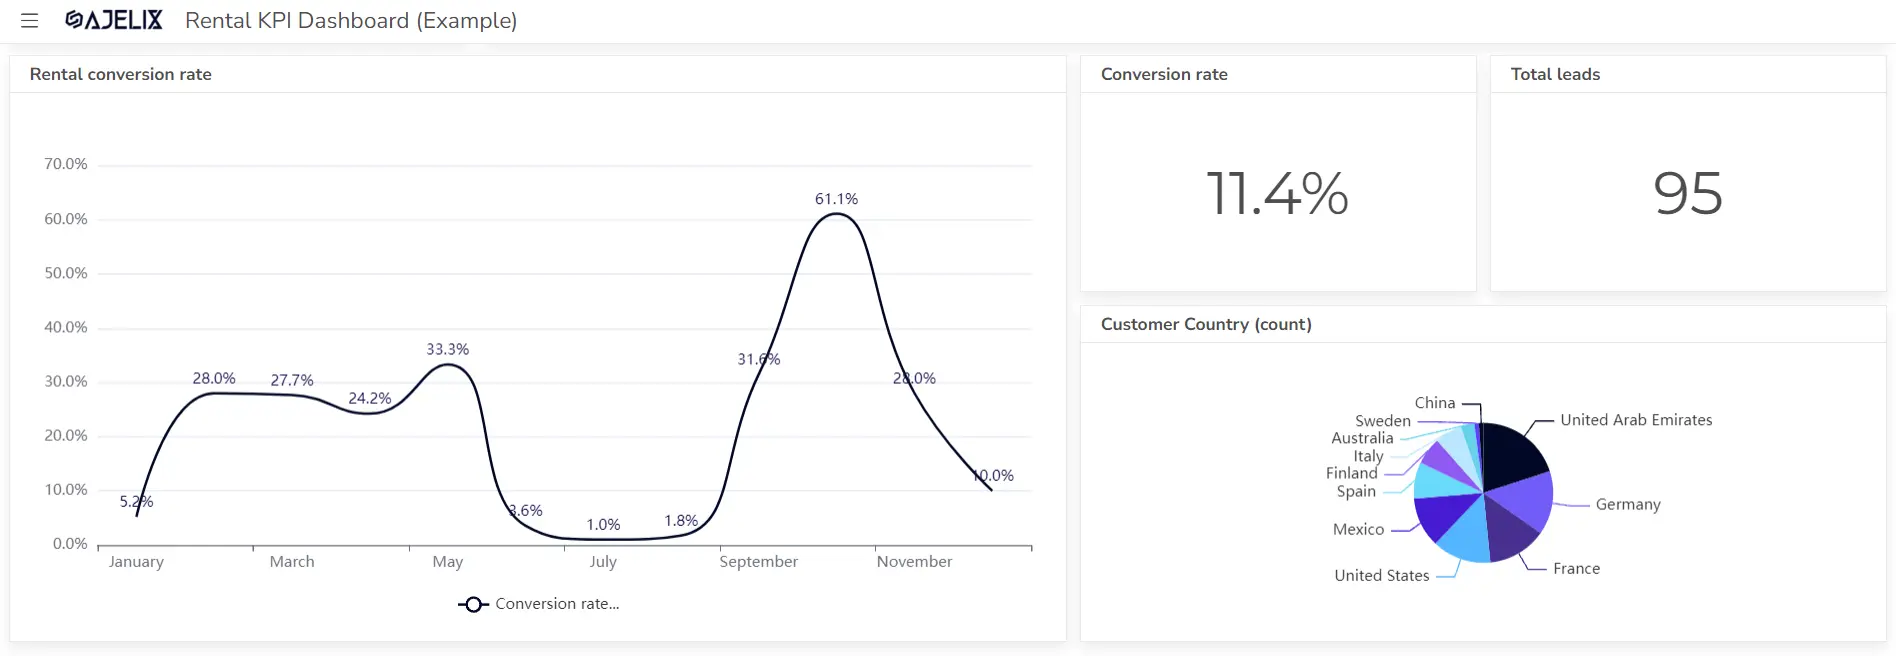
5. Conversion Rate
This metric measures the percentage of website visitors or leads who convert into paying customers. A high conversion rate indicates that your marketing and sales efforts are effective.
Conversion Rate = (Number of Rentals) / (Number of Leads)
Example
A website for renting tuxedos gets 1,000 visitors in a month and converts 50 of them into paying customers. The conversion rate would be 5% (50 / 1,000).
Good metric
A higher conversion rate indicates your website and marketing efforts are effectively turning visitors into renters. Industry benchmarks can help determine a good conversion rate for your rental business.
6. Rental Rate
This is simply the price you charge for renting out an item. It’s important to set your rental rates competitively while also ensuring that you are covering your costs and generating a profit.
Rental Rate = (Total Costs + Desired Profit Margin) / Estimated Days of Availability per Year
Example
Let’s say a paint sprayer costs $500, and you factor in annual maintenance of $100, insurance of $50, and target a 20% profit margin. You estimate the sprayer can be rented out for 150 days a year.
- Total Costs = $500 (equipment) + $100 (maintenance) + $50 (insurance) = $650
- Desired Profit Margin = 20% * $650 = $130
- Rental Rate = ($650 + $130) / 150 days = $5.20 per day
Good Rental Rate
- Covering Your Costs: The rate should be high enough to cover all your expenses associated with the equipment, including purchase, maintenance, insurance, and storage.
- Competitive Pricing: Your rate should be in line with what the market dictates for similar equipment. An excessively high rate might deter potential renters.
- Profitability: Ideally, the rate should allow you to generate a desired profit margin after covering your costs.
7. Profit
This is the ultimate measure of your rental business’s success. It’s important to track your profit margin to ensure that your business is sustainable. If you’re looking for more small business KPIs you can find them here.
Rental Profit = Total Rental Revenue – Total Rental Expenses
You can calculate these metrics by using net profit margin calculator or gross profit calculator.
Example
Let’s say you own a party equipment rental business. In a month, you generate $4,000 in revenue from renting out bounce houses, tables, and chairs. Here’s how to calculate your profit:
Identify Total Rental Expenses:
- Equipment maintenance: $200
- Delivery and pick-up costs: $300
- Marketing expenses: $100
- Insurance: $150
- Total Rental Expenses = $200 + $300 + $100 + $150 = $750
Calculate Rental Profit:
- Rental Profit = $4,000 (Total Revenue) – $750 (Total Expenses) = $3,250
Good rental profit Score
A good rental profit depends on your industry and business goals. Here’s are the main goals:
- Industry Benchmark: Research average profit margins for your rental sector.
- Volume vs. Margin: High volume with a decent margin can be good.
- Efficiency Matters: Lower operating costs allow for good profits with a smaller margin per rental.
8. Fleet to Rental Ratio
This KPI compares the size of your rental fleet to the number of rentals you are making. It can help you identify if you have too much or too little equipment on hand.
Fleet to Rental Ratio = (Number of Rental Items) / (Number of Rentals)
Example
A furniture rental company has 20 couches and completes 15 rentals in a week. The fleet-to-rental ratio would be 1.33 (20 couches / 15 rentals).
Good metric
A ratio close to 1 indicates good utilization of your rental inventory. A lower ratio might suggest having too much equipment, while a higher ratio could mean insufficient inventory to meet demand. If you have an online e-commerce business check the most popular metrics.
9. Vacancy Rate (for property rentals)
This metric tracks the percentage of your rental properties that are currently vacant. A high vacancy rate can eat into your profits.
Vacancy Rate = (Number of Vacant Units) / (Total Number of Units)
Example
An apartment complex has 100 units and currently has 5 vacant units. The vacancy rate would be 5% (5 units / 100 units).
Good metric
A low vacancy rate signifies high occupancy and rental income. A good vacancy rate depends on your location and rental market. Generally, a vacancy rate below 5% is considered strong.
10. Customer Satisfaction
While not a traditional KPI, customer satisfaction is essential for any rental business. Tracking customer satisfaction can help you identify areas where you can improve your service and keep your customers returning.
Good metric
High customer satisfaction is crucial for repeat business and positive word-of-mouth marketing. Track satisfaction through surveys, reviews, and analyze feedback to improve your rental process and customer service. Discover quality KPIs to measure rental business operations.
How To Create Equipment Rental KPI Dashboard?
Time needed: 5 hours
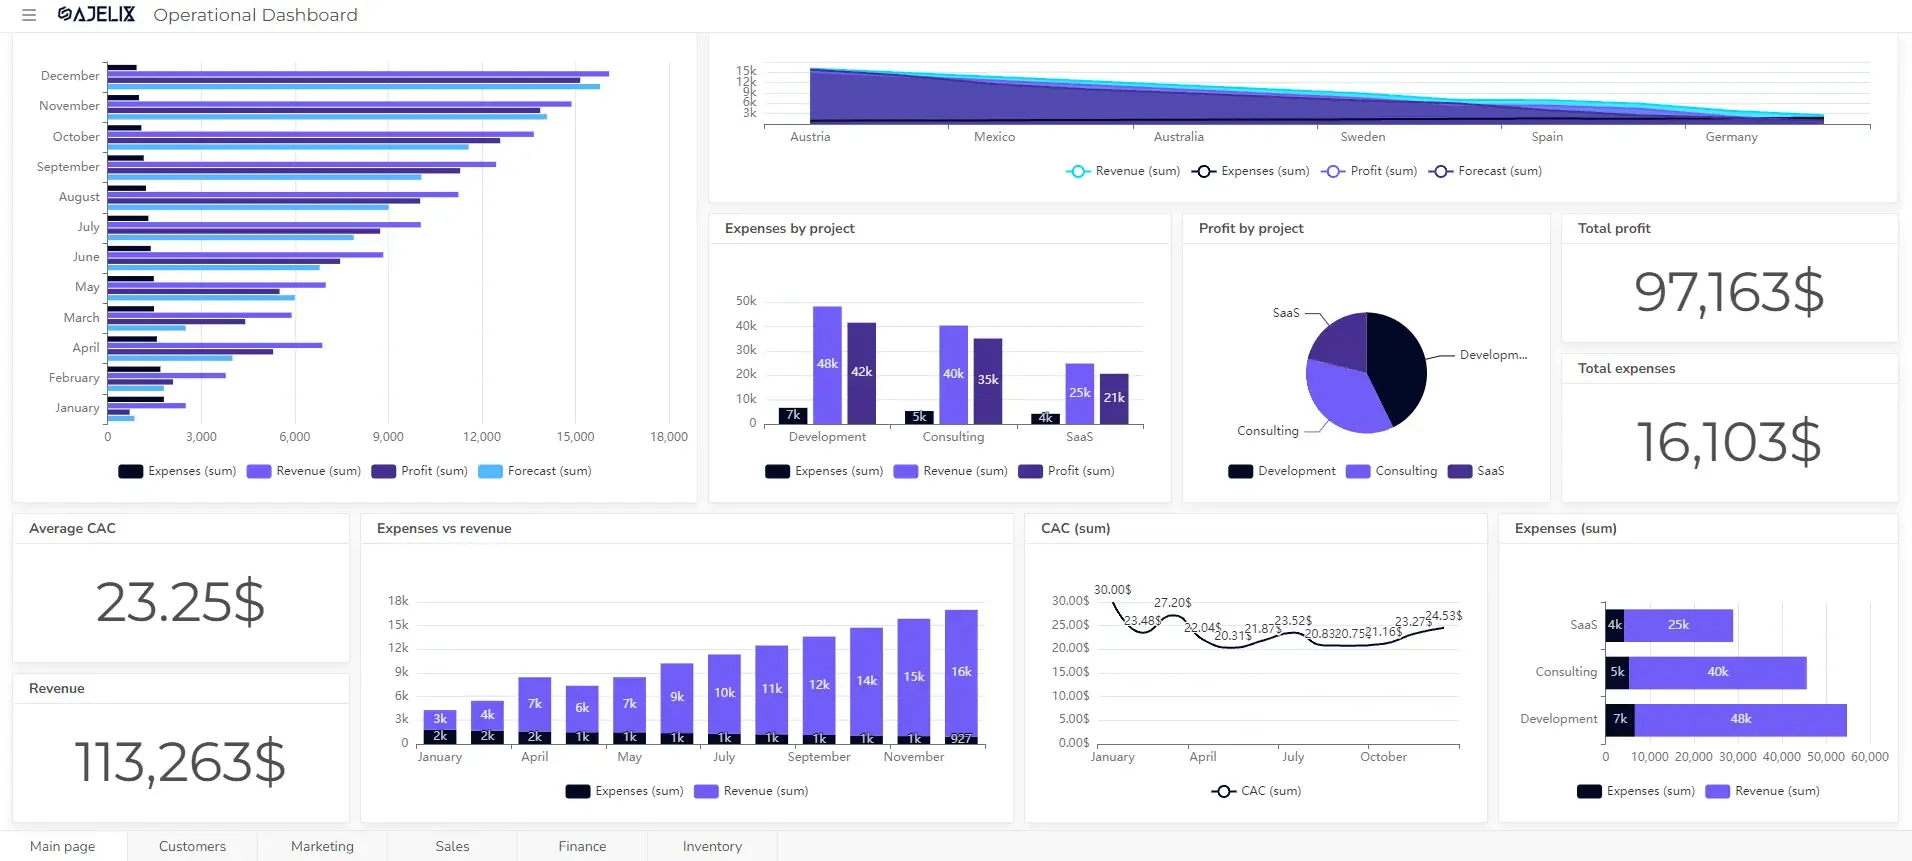
This guide will walk you through creating a KPI (Key Performance Indicator) dashboard using an Ajelix BI tool that offers freemium. While specific steps may vary depending on the tool, the general process remains similar.
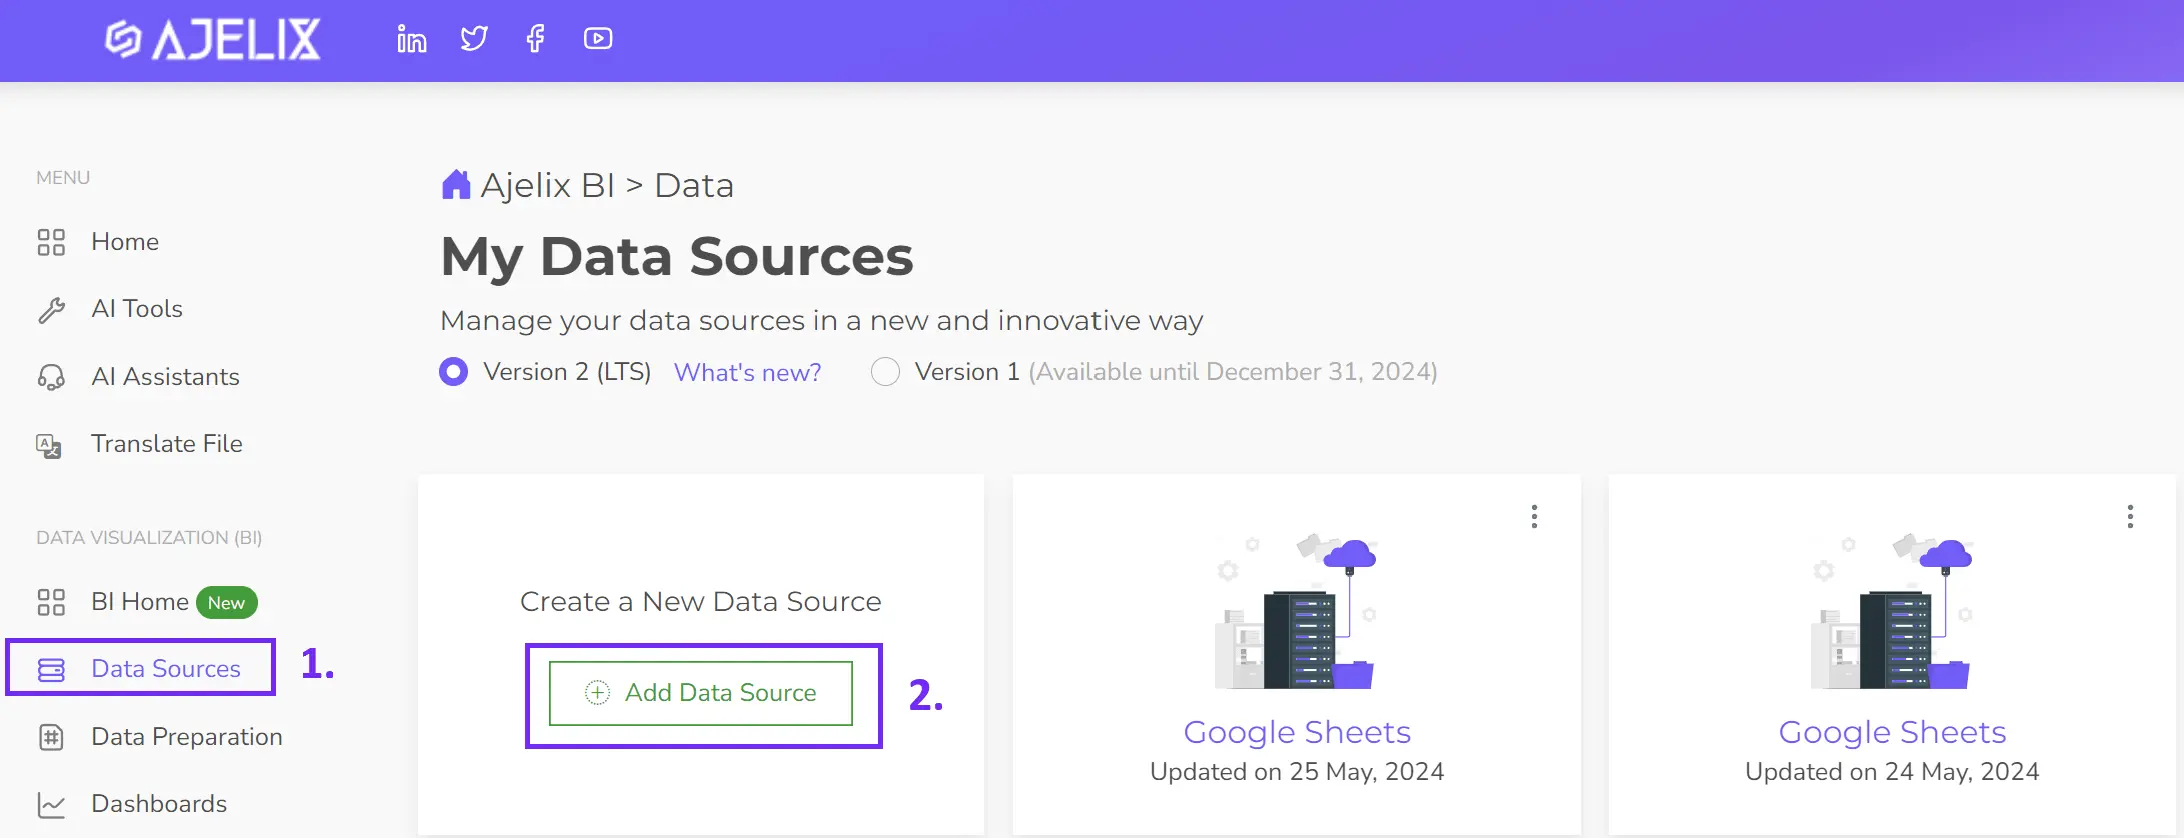
- Connect your data source
Within your BI tool, connect to your data source. Most tools allow easy uploads of Excel, CSV files, or connections to SQL servers and Google Sheets.
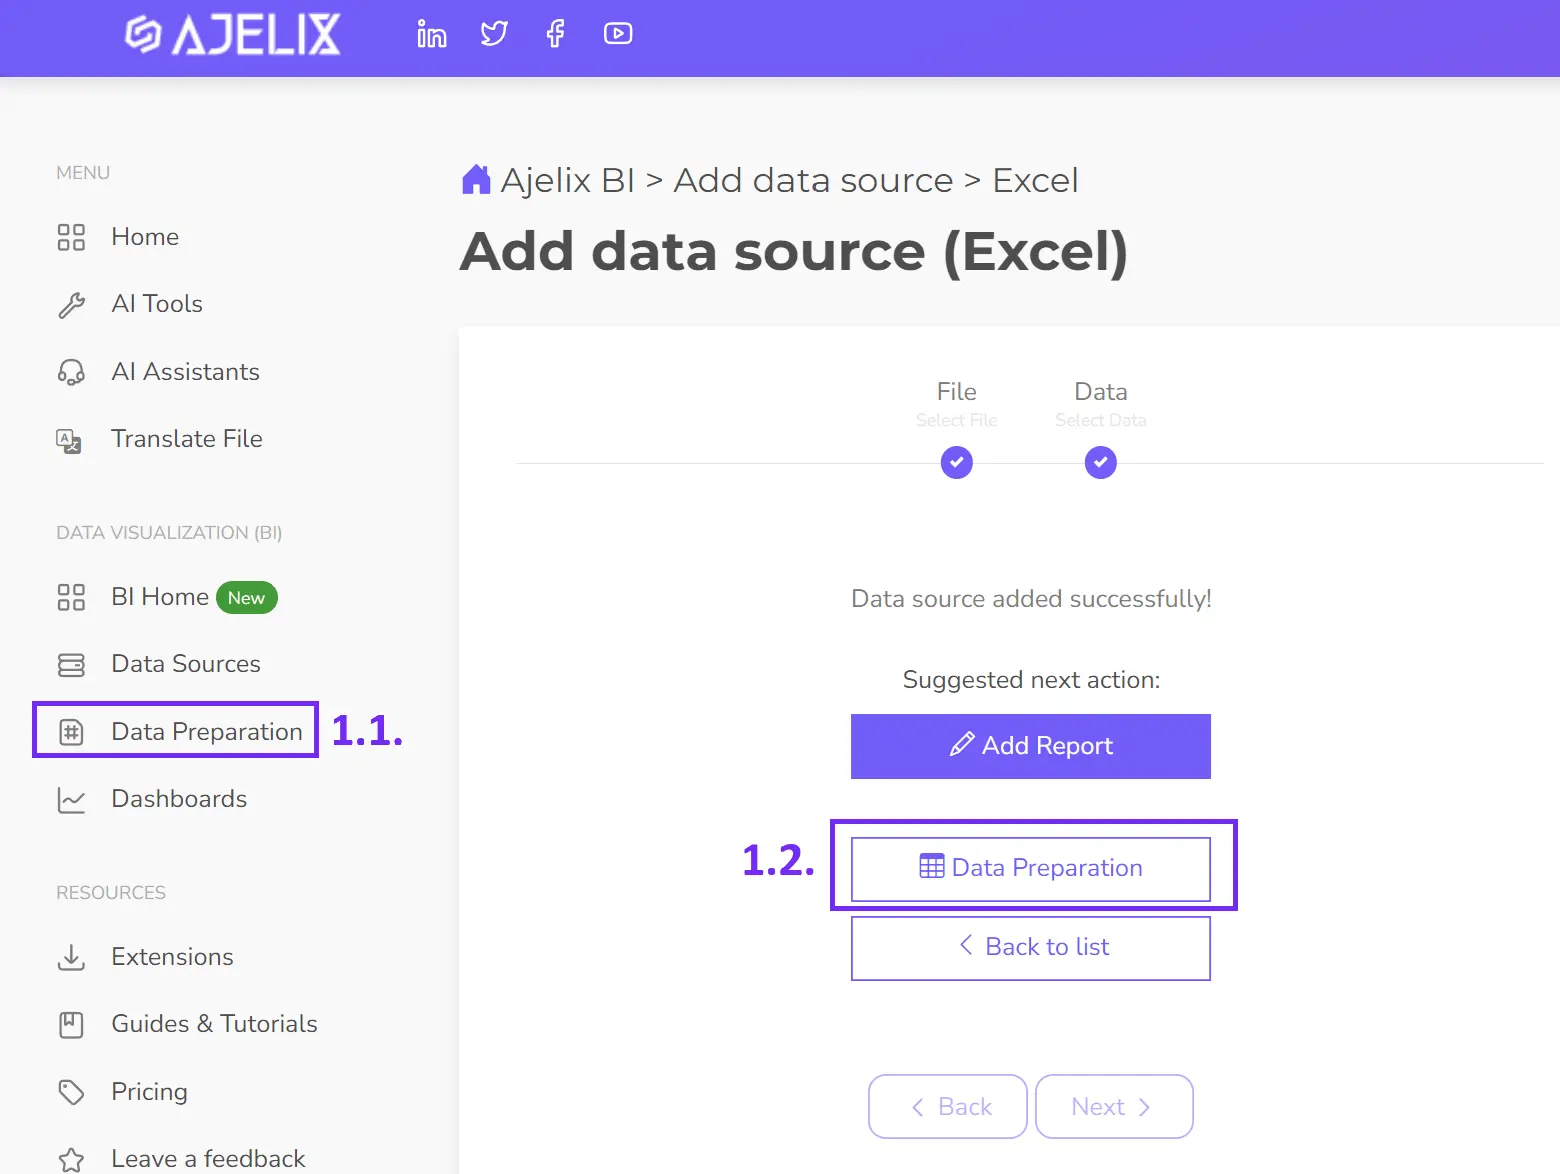
- Clean and transform your data (optional)
Ajelix BI offers data cleaning and transformation tools (like formatting changes and filtering). While optional, this step refines your data for better accuracy and consistency, leading to more reliable analytics.
- Create KPIs (optional)
Some KPIs might require calculations beyond what your data source provides. This guide explored over 10 essential equipment rental KPIs you can calculate and track within Ajelix BI. The following image illustrates the steps involved in creating KPIs using Ajelix BI’s data modeling capabilities.
1. Select the data source
2. Create a measure
3. Rename the KPI
4. Insert formula, you can write SQL or use Excel like functions just like in the example
5. Press apply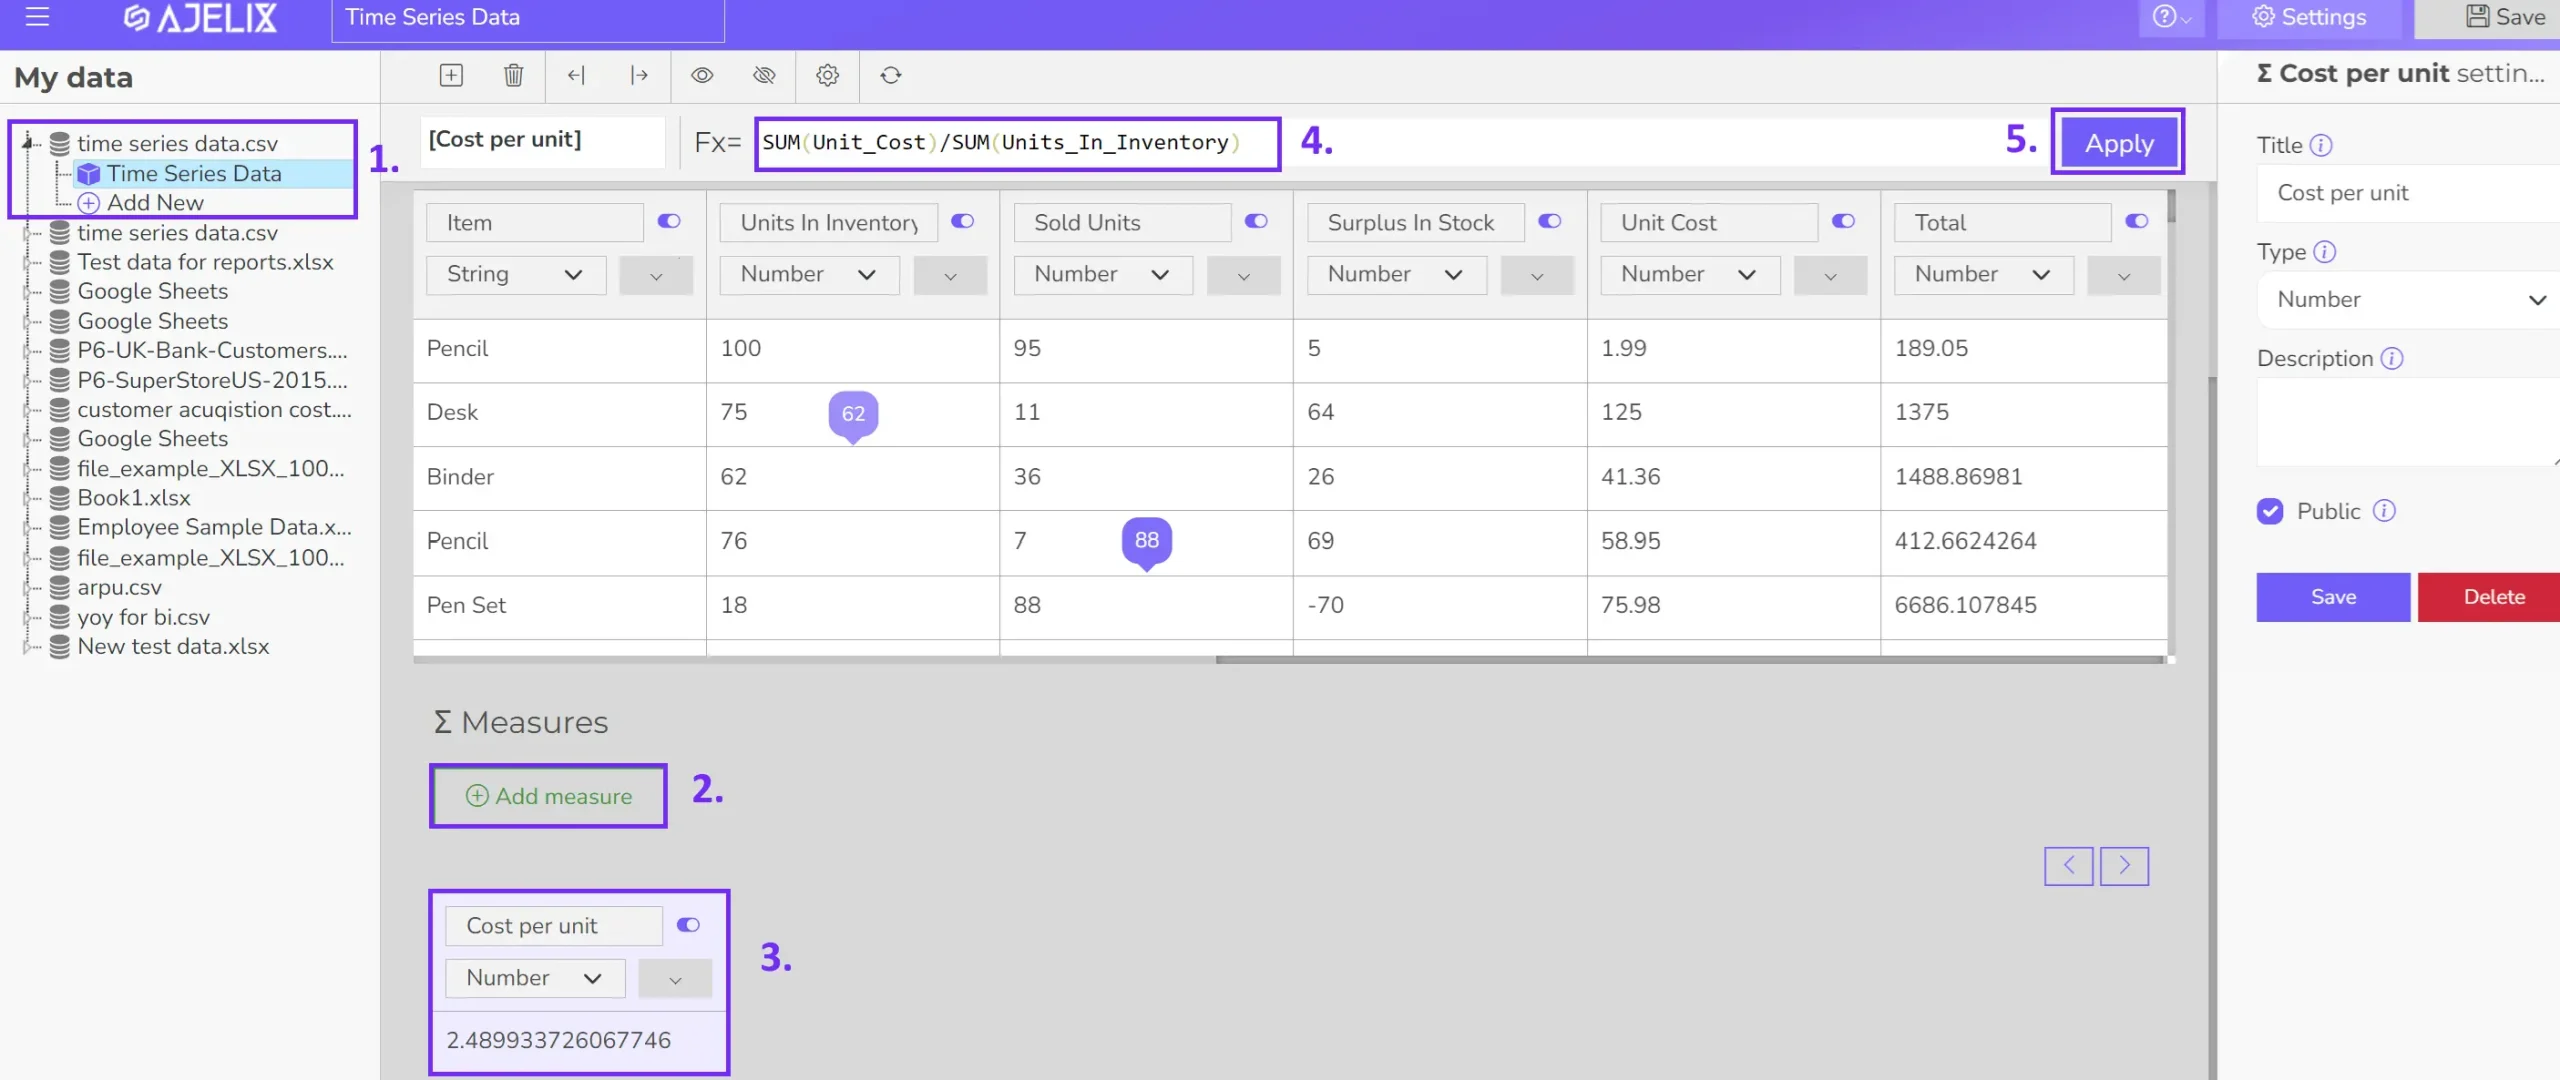
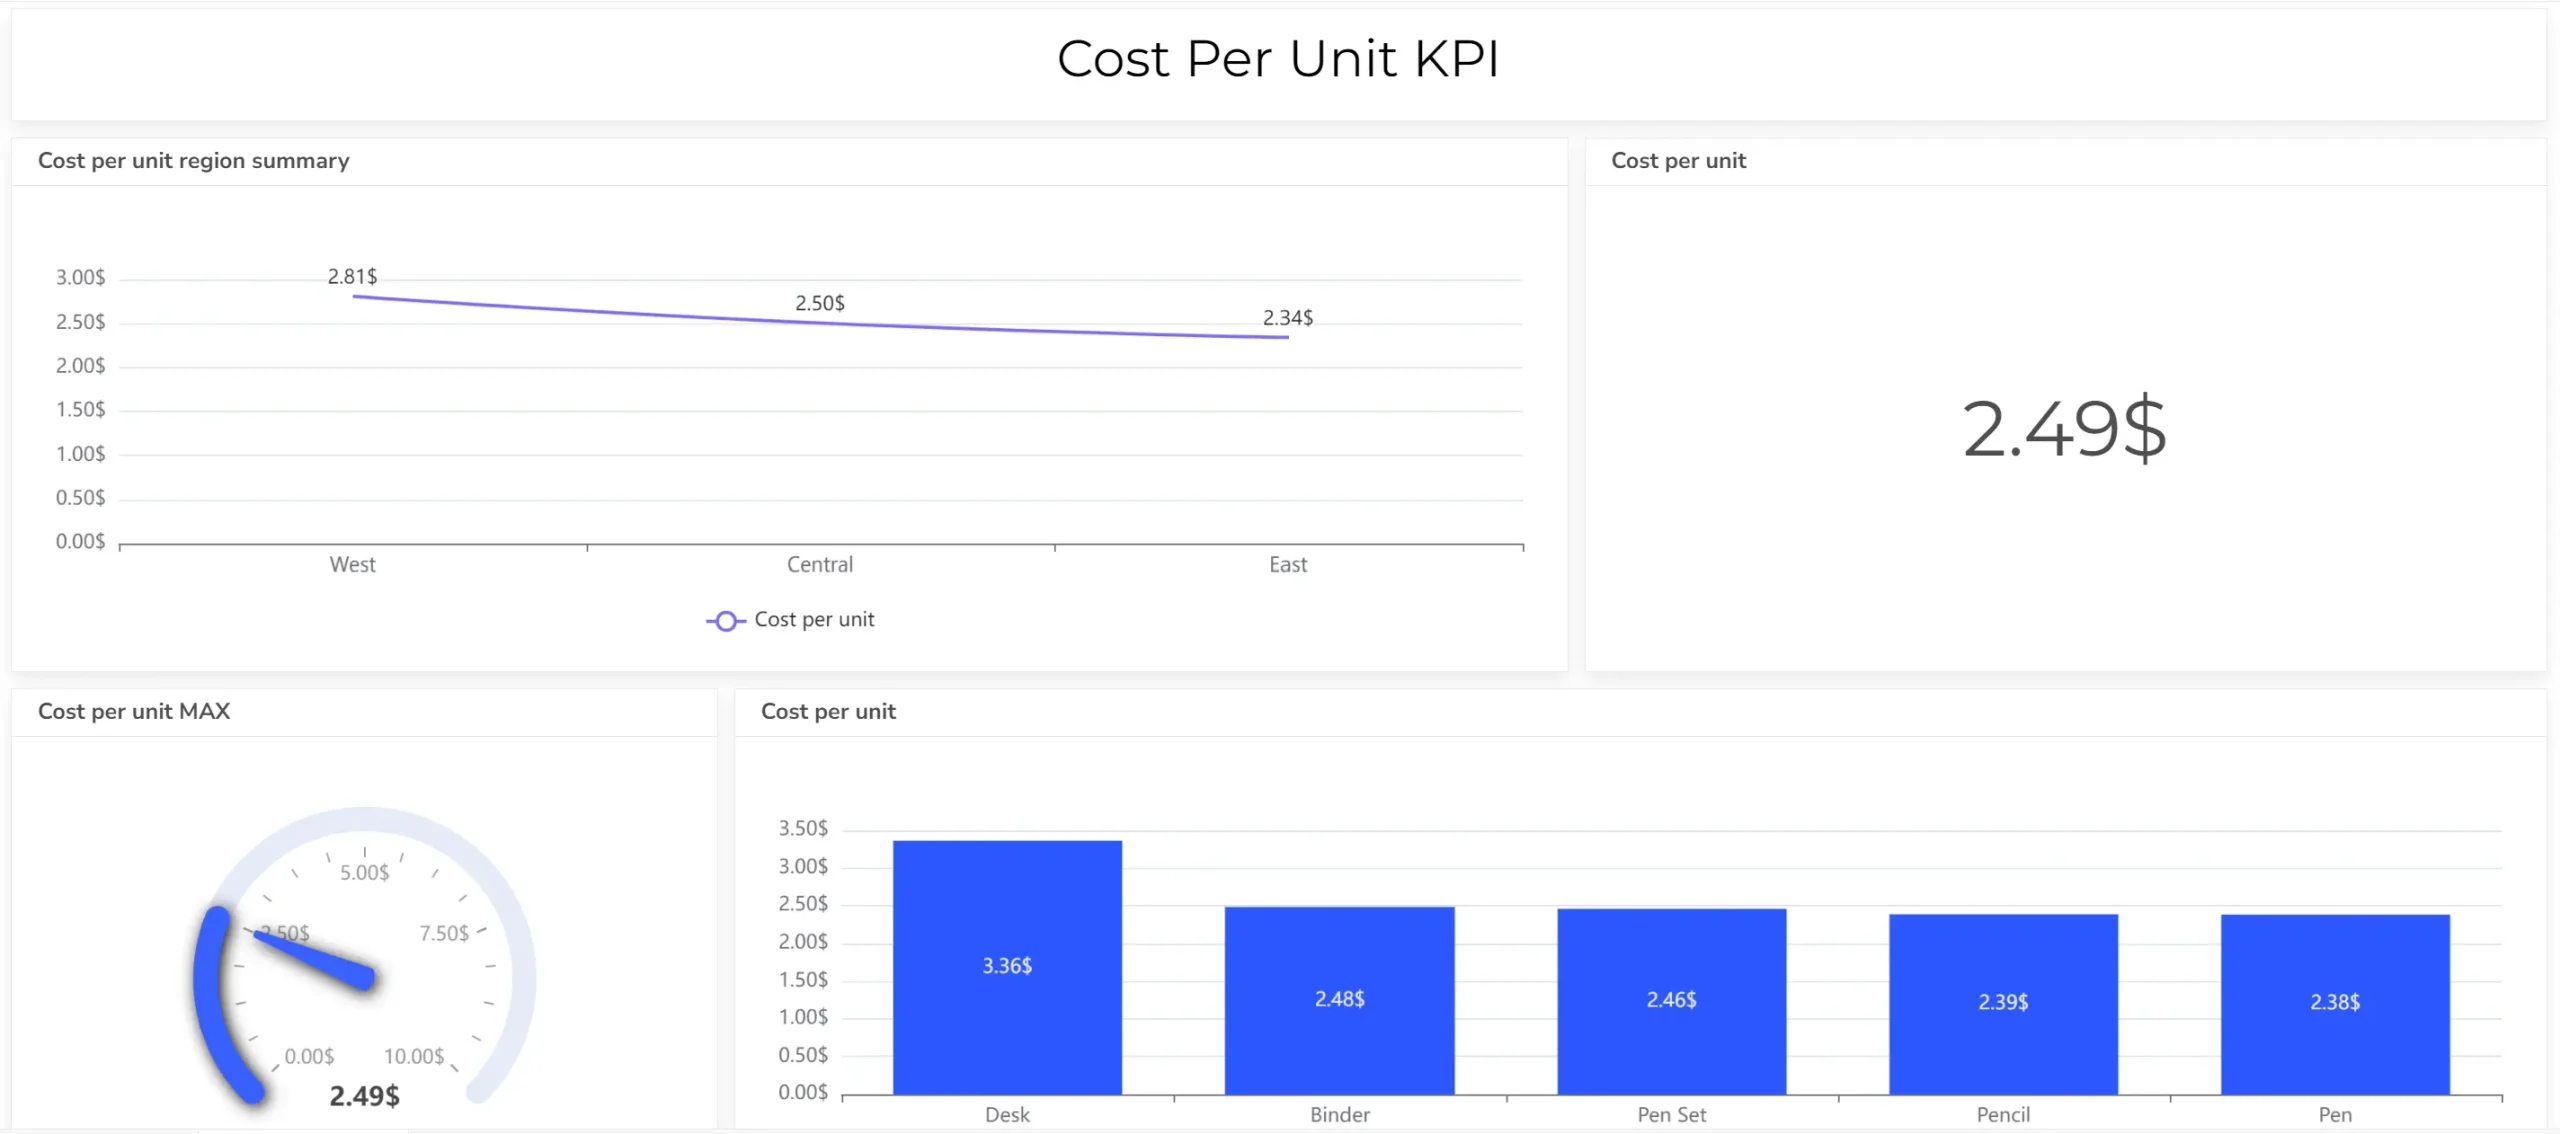
- Build your visualizations
Select the most suitable visual format for each KPI, such as cards, gauge charts, or line graphs. Ajelix BI provides a drag-and-drop interface for data fields within its visualization tool. Additionally, it offers an AI-powered dashboard generator that can automatically suggest charts based on your data. Feel free to experiment with both options to find the best presentation for your KPIs. In this step, you can visualize newly created KPIs.
- Customize your dashboard
Add titles, and descriptions, and format the layout for clarity and visual appeal. You can upload your logo and set your colors.
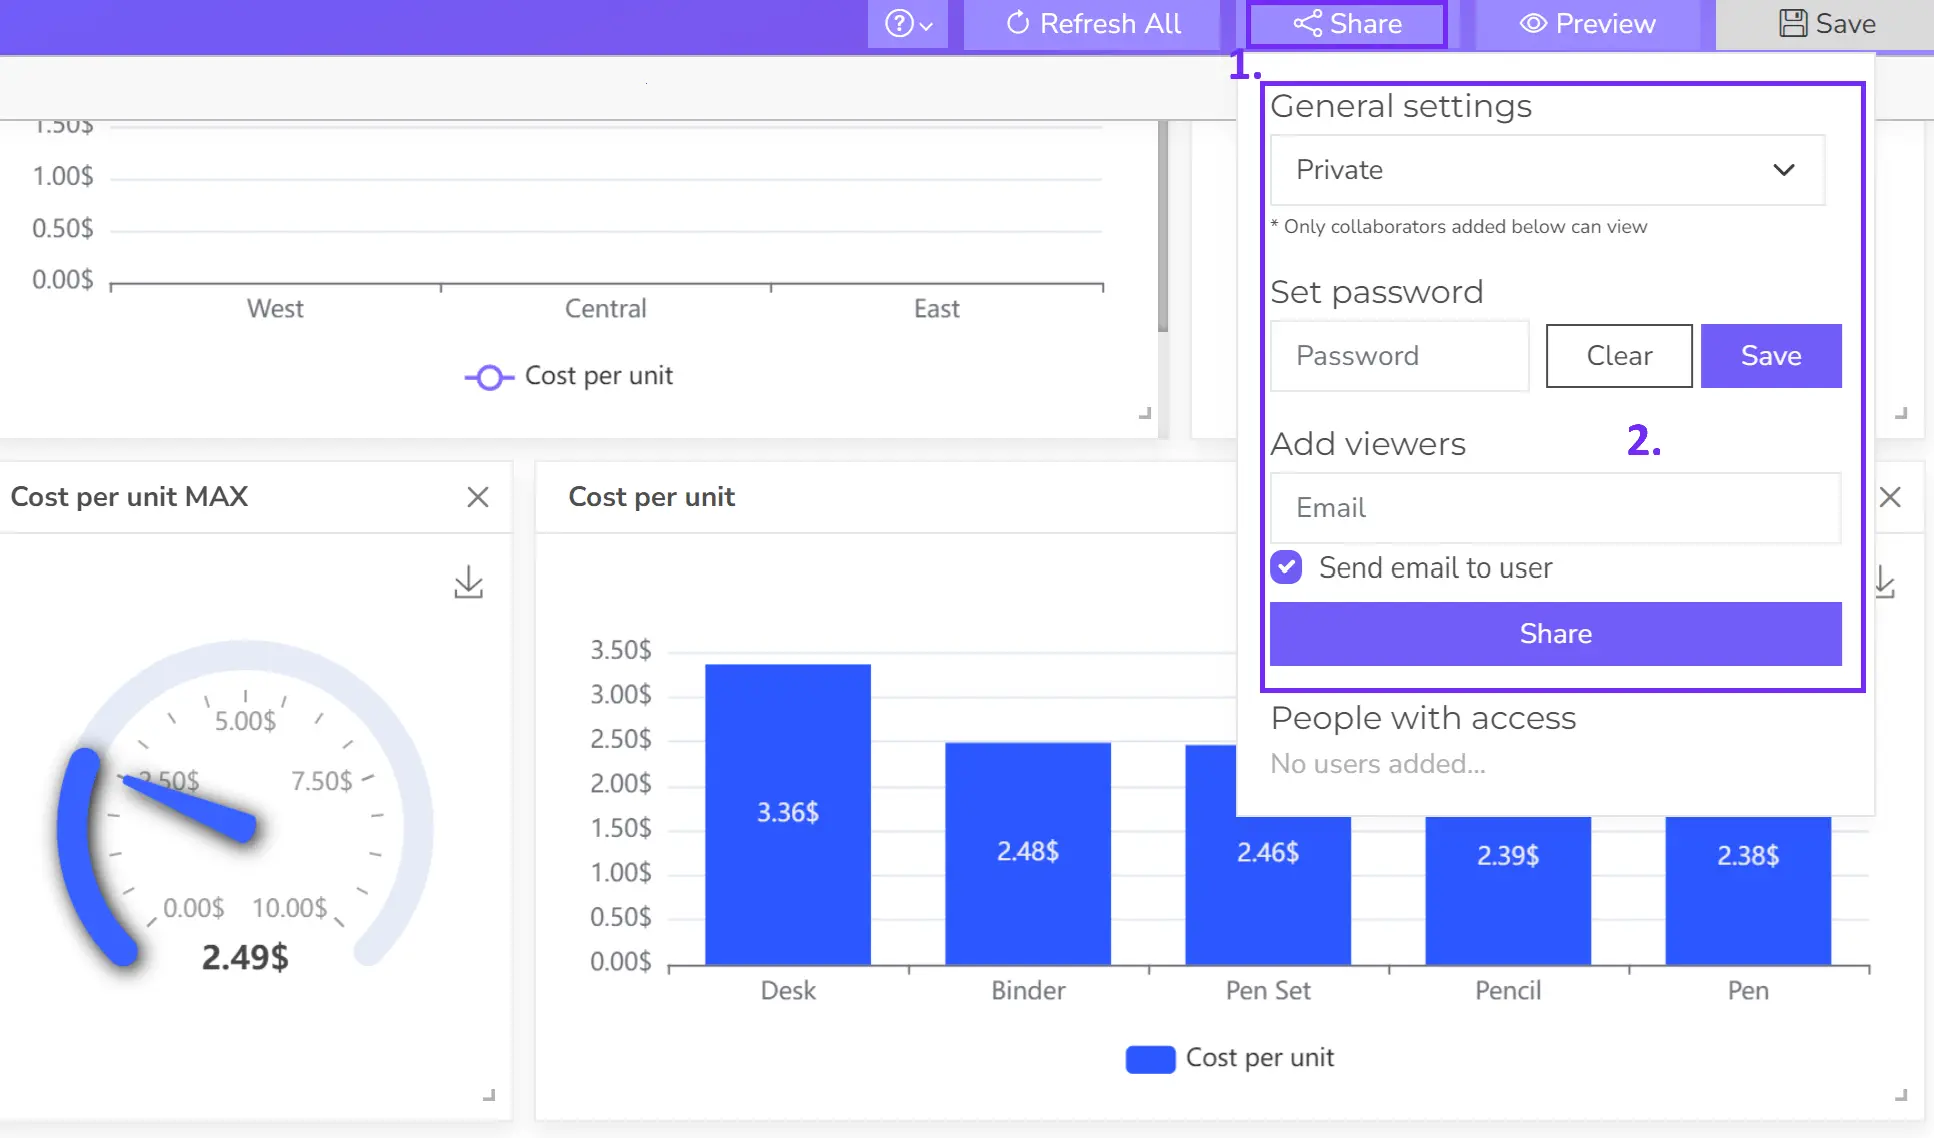
- Share your dashboard
Once happy, publish your dashboard and share it with relevant users for real-time insights.
Reporting gives you a headache?
Upload your data and create professional reports with agentic AI

Start free
Try free and upgrade whenever
Tools For Rental KPI Tracking
1. Spreadsheets (Excel, Google Sheets)
While not a dedicated rental KPI tracking tool, spreadsheets can be a good option for smaller business analytics or those just starting out. They are familiar, free, and relatively easy to use. However, they can become cumbersome and error-prone as your business grows and your data collection needs become more complex.
2. Business Intelligence (BI) Tools
BI tools allow you to collect data from a variety of sources, including your rental management software, accounting system, and CRM, and then analyze that data to generate insights. This can be a powerful way to track a wide range of KPIs and identify trends over time.
Some popular BI tools for rental businesses include:
FAQ
Tracking rental KPIs depends on your business. Daily monitoring might be needed for very dynamic businesses, while weekly tracking offers a good balance for most. Monthly updates work for slower-changing metrics or smaller businesses. Choose a frequency that gives you timely insights to make improvements.
To improve equipment utilization, focus on reducing idle time. Rent equipment for longer durations, offer discounts for multi-day rentals, and explore diversifying your rental offerings to match demand.
By tracking KPIs, you can identify areas for improvement. Low utilization rates might signal a need for marketing adjustments or strategic pricing. Analyzing customer lifetime value can help tailor retention strategies. KPIs become a roadmap to optimize operations and maximize profitability.
Rental KPI tracking options range from familiar spreadsheets to sophisticated solutions. Spreadsheets work for starters, while rental management software offers built-in tracking. Business intelligence (BI) tools provide powerful, data-driven insights, and custom dashboards offer ultimate flexibility (but require development resources).
From data to report in one minute or less with Ajelix BI