CMO Dashboard Examples For Marketing Chief Officers

As the Chief Marketing Officer, your role drives business growth. A well-designed CMO dashboard serves as your compass, providing real-time insights into your marketing performance.
Visualizing key metrics and trends allows you to make data-driven decisions, optimize campaigns, and ensure your team is aligned with overall business objectives.
In this article, we’ll explore a variety of CMO dashboard examples that showcase best practices and highlight how you can use data to improve your marketing strategy.
Change the way you work with agentic AI
One-click dashboards,KPI tracking, and AI-powered insights—for work that actually gets done.

What is CMO dashboard?
A CMO dashboard is a centralized, visual interface that provides a comprehensive overview of a company’s marketing performance. It serves as a tool for Chief Marketing Officers (CMOs) to:
- Track key marketing metrics: website traffic, social media engagement, lead generation, conversion rates, and customer satisfaction.
- Monitor campaign effectiveness: assess the success of campgains by visualizing data from various marketing channels.
- Make data-driven decisions: make informed decisions about resource allocation, budget adjustments, and strategy refinement.
- Communicate performance: present marketing performance to executives and stakeholders, providing a clear and concise overview of the team’s achievements.
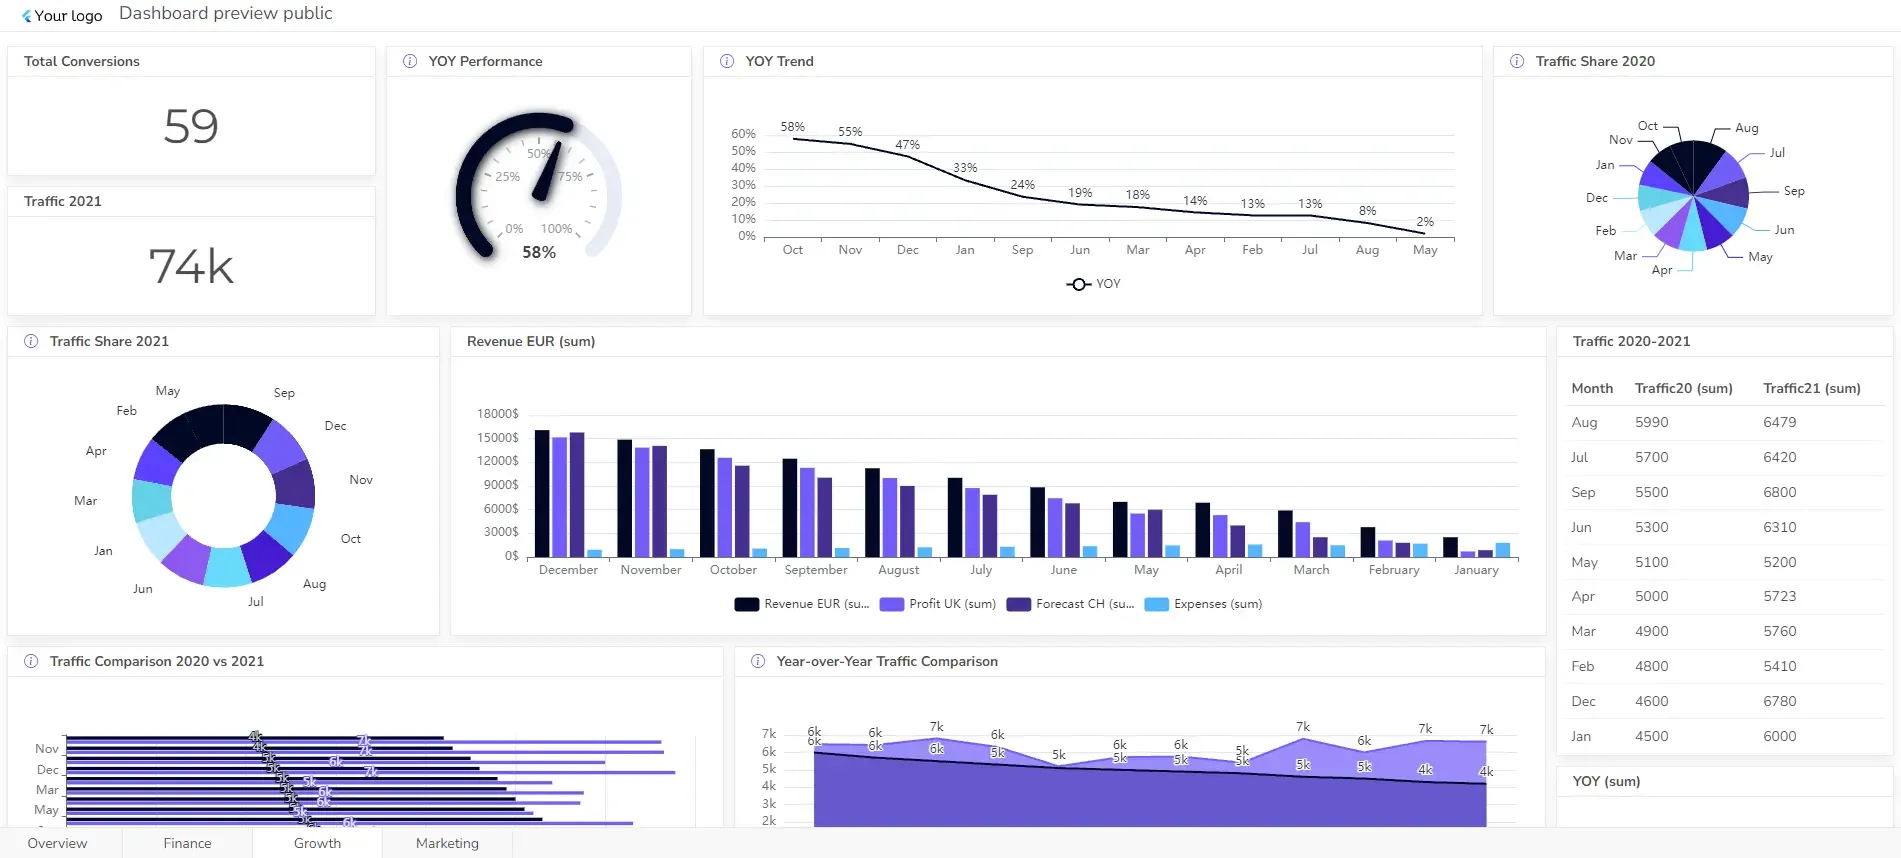
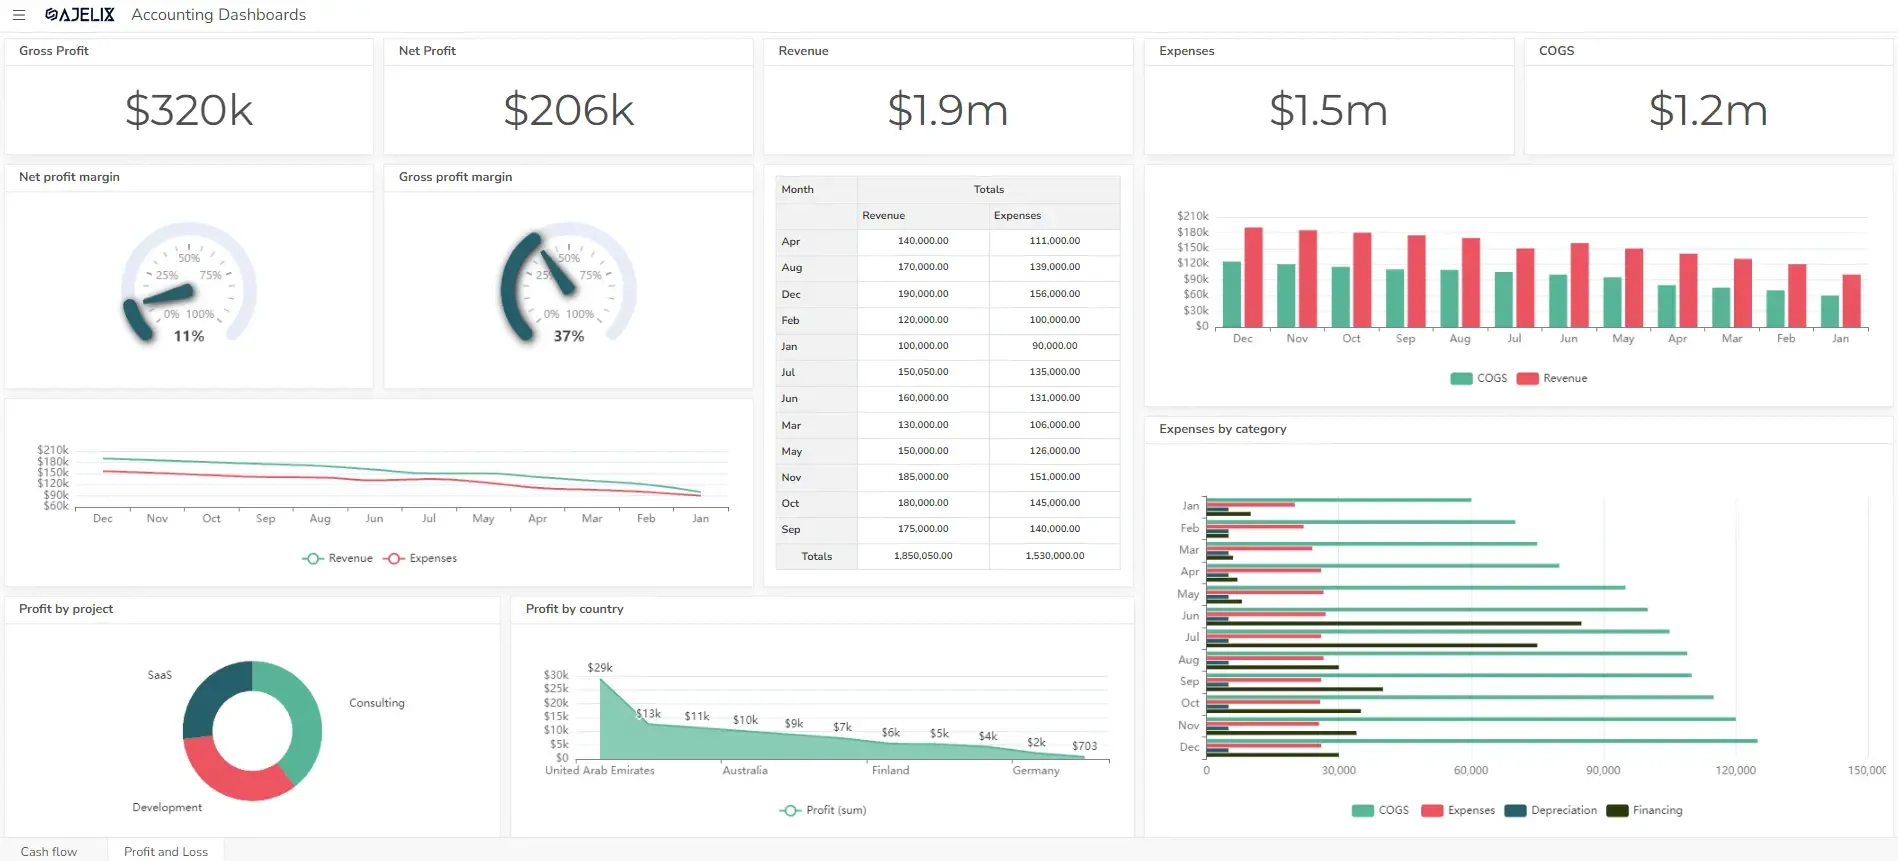
CMO Dashboard Example
A CMO dashboard should provide a clear and concise overview of critical marketing performance indicators. This dashboard shouldn’t have too many detailed metrics.
Metrics For CMO Dashboard
Website Performance
- Website traffic: Total visitors, unique visitors, and traffic sources.
- Bounce rate: Percentage of visitors who leave the site after viewing only one page.
- Time on site: Average duration of visitor sessions.
- Conversion rate: Percentage of website visitors who complete a desired action (e.g., making a purchase, signing up for a newsletter).
Social Media Engagement
- Follower growth: Increase in followers across different platforms.
- Engagement rate: Likes, shares, comments, and clicks per post.
- Social media mentions: Brand mentions and sentiment analysis.
Content Marketing
- Content consumption: Views, reads, and shares of blog posts, articles, and other content.
- Lead generation: Number of leads generated through content marketing efforts.
- SEO performance: Keyword rankings, organic traffic, and backlinks.
Email Marketing
- Open rate: Percentage of emails that are opened.
- Click-through rate: Percentage of emails that are clicked on.
- Conversion rate: Percentage of email recipients who take a desired action.
Paid Advertising
- Cost per acquisition (CPA): Cost of acquiring a new customer through paid advertising.
- Return on investment (ROI): Profit generated from paid advertising campaigns.
- Click-through rate (CTR): Percentage of ad impressions that result in clicks.
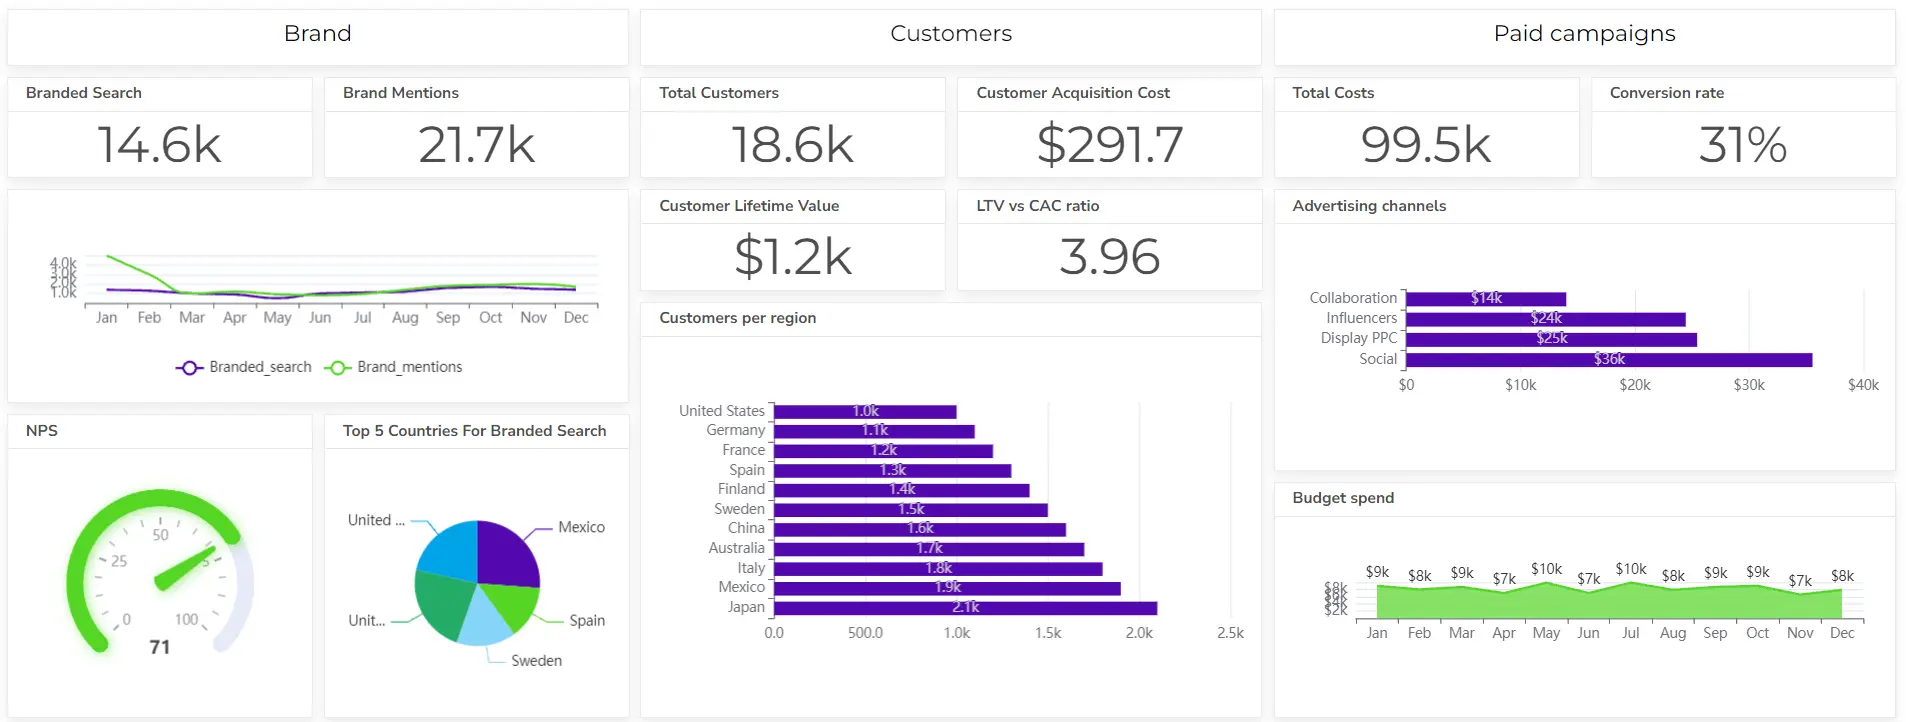
Customer Acquisition and Retention
- Customer acquisition cost (CAC): Total cost of acquiring a new customer.
- Customer lifetime value (CLTV): Estimated total revenue a customer will generate over their lifetime.
- Customer churn rate: Percentage of customers who stop doing business with the company.
Sales Funnel
- Lead generation: Number of leads generated.
- Conversion rate: Percentage of leads that become customers.
- Customer lifetime value: Estimated revenue generated by each customer.
By visualizing these metrics, CMOs can gain valuable insights into their marketing efforts, identify areas for improvement, and make data-driven decisions to optimize their strategies.
8 Types Of Marketing Dashboard Examples
While CMO dashboards are specifically designed for Chief Marketing Officers, there are other types of marketing dashboards that serve different purposes within organization and teams.
1. Digital Marketing Dashboard
A digital marketing dashboard provides an overview of a company’s online marketing efforts. It helps marketers track and analyze various digital channels, including:
- Search Engine Optimization (SEO): tracks organic search traffic, keyword rankings, backlinks, site speed, and mobile-friendliness.
- Pay-Per-Click (PPC) Advertising: click-through rate, cost per click, cost per acquisition, ROI and quality score.
- Social Media Marketing: follower growth, engagement rate, social media mentions, campgain performance, and share of voice.
- Email Marketing: open rate, click-through rate, conversion rate, bounce rate, and unsubscribe rate.
- Content Marketing: content views, shares, time on page, lead generation, and social media engagement.
2. Social Media Dashboard
- Focus: Monitors social media engagement metrics, brand mentions, and campaign performance.
- Key metrics: Follower growth, engagement rate, social media mentions, campaign reach, click-through rate.
3. Content Marketing Dashboard
- Focus: Tracks content performance, audience engagement, and lead generation.
- Key metrics: Content views, shares, time on page, leads generated, SEO rankings, and backlink tracking. In the SaaS industry, where product categories often overlap and AI systems rely heavily on domain authority, consistent link-building becomes even more valuable. Agency Novo Marketing helps SaaS brands maintain that authority through sustainable off-page strategies.
4. Email Marketing Dashboard
- Focus: Measures email campaign effectiveness, open rates, click-through rates, and conversions.
- Key metrics: Open rate, click-through rate, conversion rate, unsubscribes.
5. Paid Advertising Dashboard
- Focus: Analyzes paid advertising campaigns, cost per acquisition, and return on investment.
- Key metrics: Click-through rate, cost per click, conversion rate, ROI.
6. Customer Success Dashboard
- Focus: Tracks customer satisfaction, retention, and churn rates.
- Key metrics: Customer satisfaction scores, customer churn rate, net promoter score (NPS).
7. Marketing Operations Dashboard
- Focus: Monitors marketing team efficiency, budget allocation, and resource utilization.
- Key metrics: Marketing budget spend, project completion rates, team productivity.
8. Competitive Analysis Dashboard
- Focus: Tracks competitor activities, market share, and pricing strategies.
- Key metrics: Market share, competitor website traffic, product launches.
Each of these dashboards provides specific insights into different areas of marketing, allowing teams to measure performance, identify trends, and make data-driven decisions.
Tools For CMO Dashboard Creation
A CMO dashboard is a powerful tool for visualizing and analyzing marketing performance. Here are some popular tools you can use to create your own:
Business Intelligence (BI) Tools
- Ajelix BI: A powerful BI tool focusing on a user-friendly interface and easy report creation.
- Tableau: Renowned for its drag-and-drop interface and ability to create interactive visualizations.
- Power BI: Microsoft’s cloud-based BI service, offering deep integration with Microsoft products.
- Looker: Provides a flexible platform for data exploration and analysis.
Marketing Analytics Platforms
- Google Analytics: A free and powerful tool for tracking website traffic and user behavior.
- Adobe Analytics: Offers advanced features like predictive analytics and customer journey mapping.
- Mixpanel: Primarily focused on product analytics, tracking user interactions and conversions.
Data Visualization Tools
- Data Studio: Google’s free tool for creating custom dashboards and reports.
- Chartio: Provides a simple interface for connecting to data sources and building visualizations.
- Plotly: A Python library for creating interactive graphs and charts.
Key Factors to Consider When Choosing a Tool
- Ease of use: Consider your team’s technical skills and the level of complexity you need.
- Data sources: Ensure the tool can connect to your existing data sources (e.g., databases, APIs).
- Customization: Look for tools that allow you to customize the dashboard’s appearance and functionality.
- Integration: Check if the tool integrates with other marketing tools you use (e.g., CRM, email marketing).
- Cost: Evaluate the pricing models and features offered by different tools.
Here’s a quick video overview of the marketing dashboard:
Explore other dashboards


Ready to create your dashboard?